
By Lizzie Frost, China Analyst; Danny Hartono, Data Scientist; with contributions from Lauri Myllyvirta, Lead Analyst
China’s coal generation fell 8.9% year-on-year in October, the biggest drop since the COVID lockdowns. Solar, wind, and nuclear power all expanded strongly. Total power generation saw the biggest monthly fall since at least 2021. Electric vehicle exports continued to boom, surging 140% year-on-year.
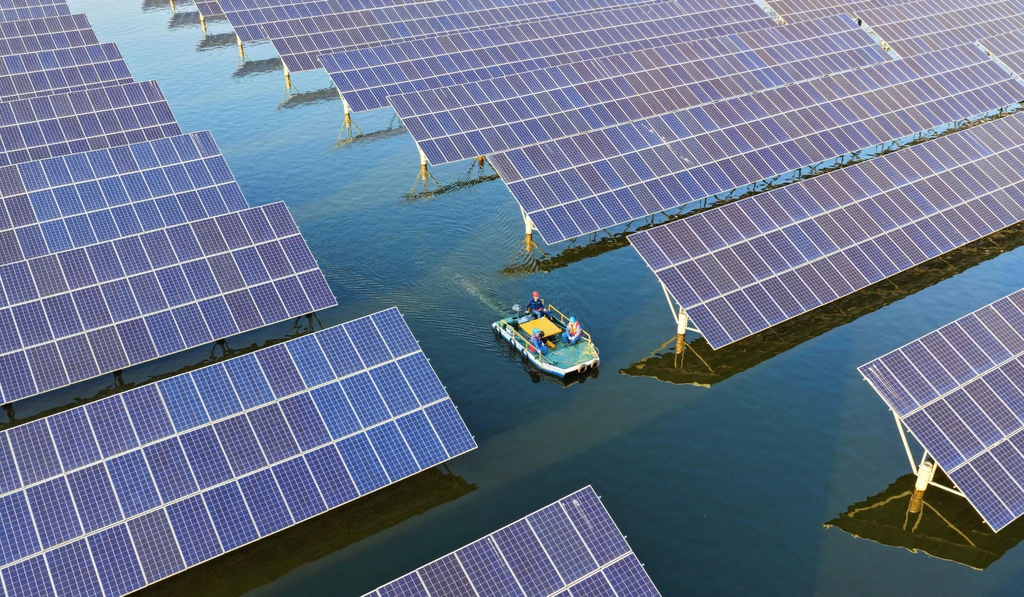
Inspections are carried out at the Sunji 30 MW Aquavoltaic Power Station in Chuzhou City, Anhui Province, China, on October 11, 2026. China has produced 651 GW of cells so far this year; this puts 2026 output on track to comfortably exceed the 660 GW of solar capacity installed globally in 2025. Photo: Cynthia Lee/Alamy
Key findings
- China’s coal generation saw the biggest drop since the 2022 COVID lockdowns, falling 8.9% year-on-year in October. Solar, wind, and nuclear power all expanded strongly, covering the drop in coal and hydropower generation. Total power generation saw its largest monthly fall in more than five years.
- China’s new energy vehicle (NEV) production continued to grow to meet the export boom: monthly exports surged 140% year-on-year. Domestically, NEV sales fell at a much lower rate than conventional vehicles. Meanwhile, China’s oil refinery throughput fell 8% in October, reflecting continued reductions in transport fuel sales and consumption and demonstrating that transport electrification continues to provide a structural buffer against elevated global oil prices.
- Solar cell production continued to bottom out, coming in at just 1% below last year’s level. China produced 73 GW of cells in October, and 651 GW in the first ten months of the year, signalling robust demand in China and overseas, with exports of wafers — the precursors to cells — also showing strong growth.
- Output of carbon-intensive materials, including steel, cement, glass, and coke, all fell, as demand for construction materials continued to decline.
Coal generation saw biggest drop since COVID lockdowns
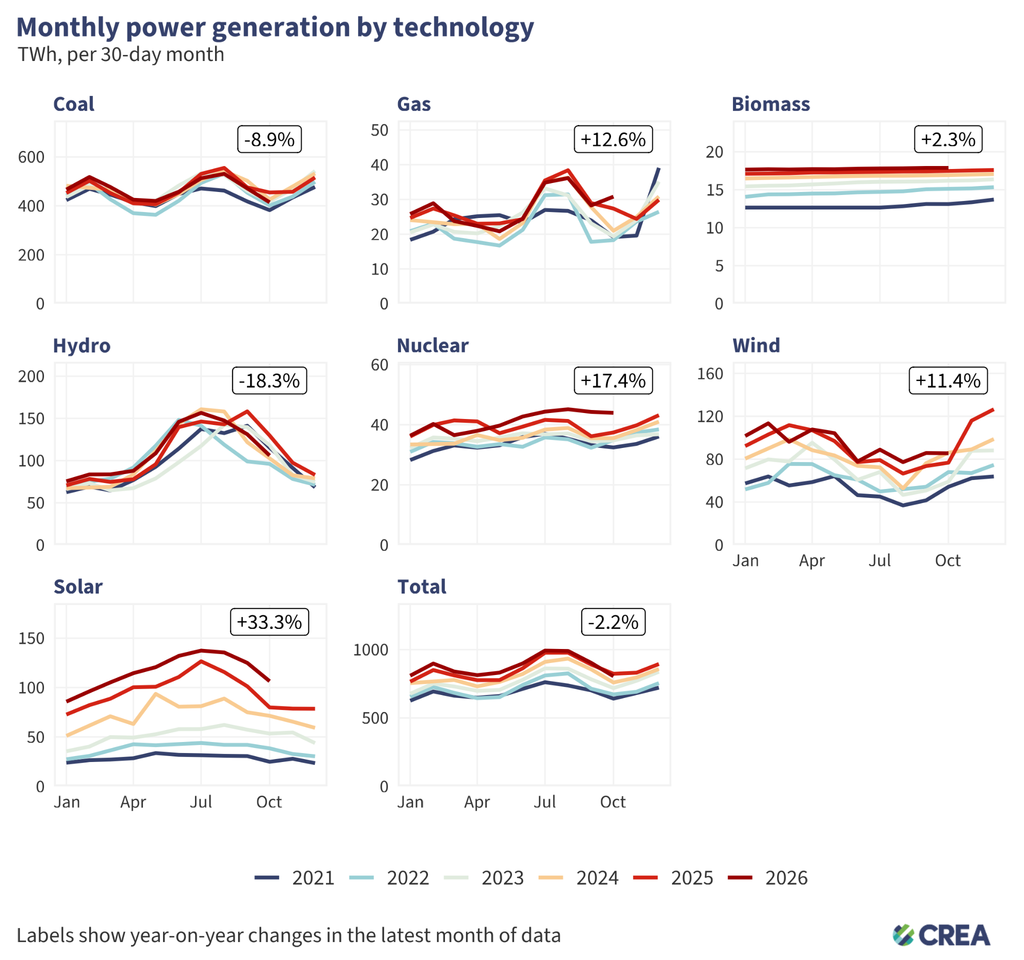
- Power generation by large-scale power producers fell 2.1% year-on-year in October, while total power generation is estimated to have decreased by 2.2%, the biggest monthly fall since at least 2021.
- Coal power generation fell 8.9% year-on-year, marking four consecutive months of decline and the largest fall since the COVID lockdowns of spring 2022. This followed China’s coal power generation falling for the first time in a decade in 2025.
- Gas power generation rose 12.6% year-on-year in October. However, because gas plays a minor role in China’s power mix, this increase had a limited impact on overall electricity generation: power generation from coal and gas combined fell 7.6% compared to the same period a year earlier.
- Solar generation rose 33.3% year-on-year in October, the fastest monthly growth so far this year.
- Wind generation rose 11.4% year-on-year, signalling wind utilisation is recovering after poor wind conditions and heavy curtailment in the first half of the year.
- Hydropower generation fell 18.3% year-on-year, largely reflecting an exceptionally high base in October 2025.
- Nuclear power generation grew 17.4%, near the record generation level set in August 2026. Nuclear power still plays a minor role in China’s power mix, so this increase had a limited impact on overall electricity generation.
*Thermal, nuclear, and hydropower generation are based on National Bureau of Statistics (NBS) data. Solar generation is estimated from installed capacity and projected utilisation rates, adjusted for weather and average curtailment over the preceding three months. Wind generation estimates are calculated using a wind projection model utilising NASA wind speed data. Figures for the most recent month are preliminary model estimates and may be revised once official generation and capacity data are released. Coal and gas generation are estimated by splitting total thermal generation using last year’s same-month fuel mix, adjusted by the year-on-year change in the fuel mix over the preceding three months.
Imports of coal and crude oil continued to fall
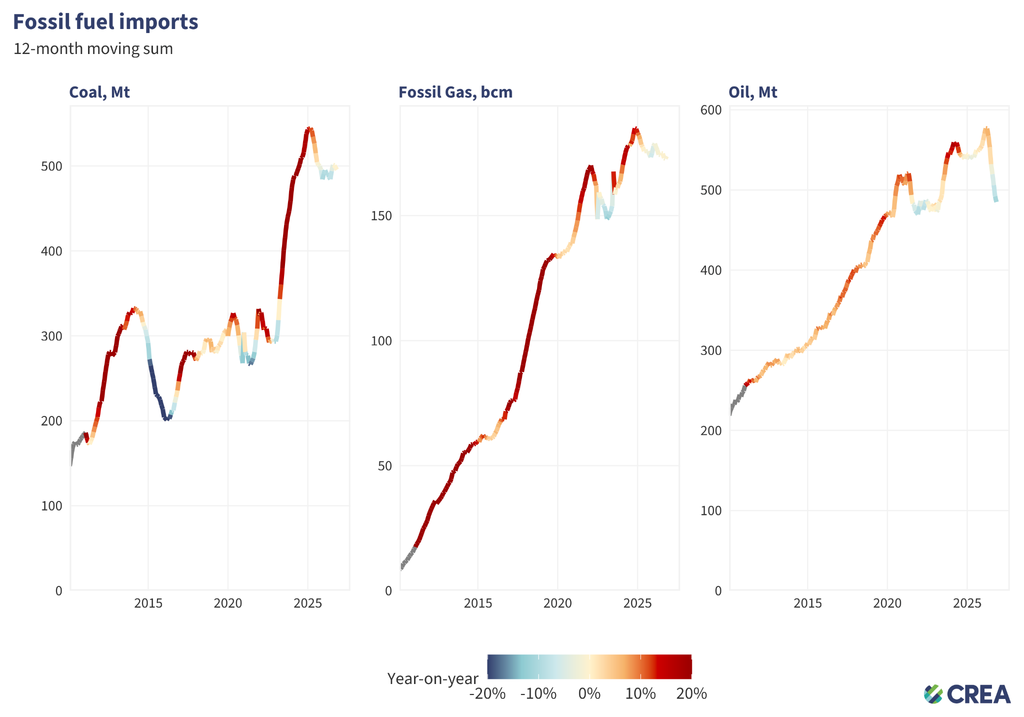
- China’s coal imports fell 5.5% year-on-year in October 2026, declining for the third consecutive month.
- China’s crude oil imports fell 13.3% from a year earlier, reflecting the continued impact of disruptions to shipments through the Strait of Hormuz. For the first ten months of the year, crude oil import volumes fell 15.1% year-on-year.
Read more: New CREA Analysis – China weathered the Hormuz shock. Clean energy can make that resilience last.
- Natural gas imports increased by 2.4% year-on-year. Cumulative imports in 2026 thus far were 2.8% lower than during the same period in 2025.
Domestic crude oil output grew slightly as coal output continued to contract
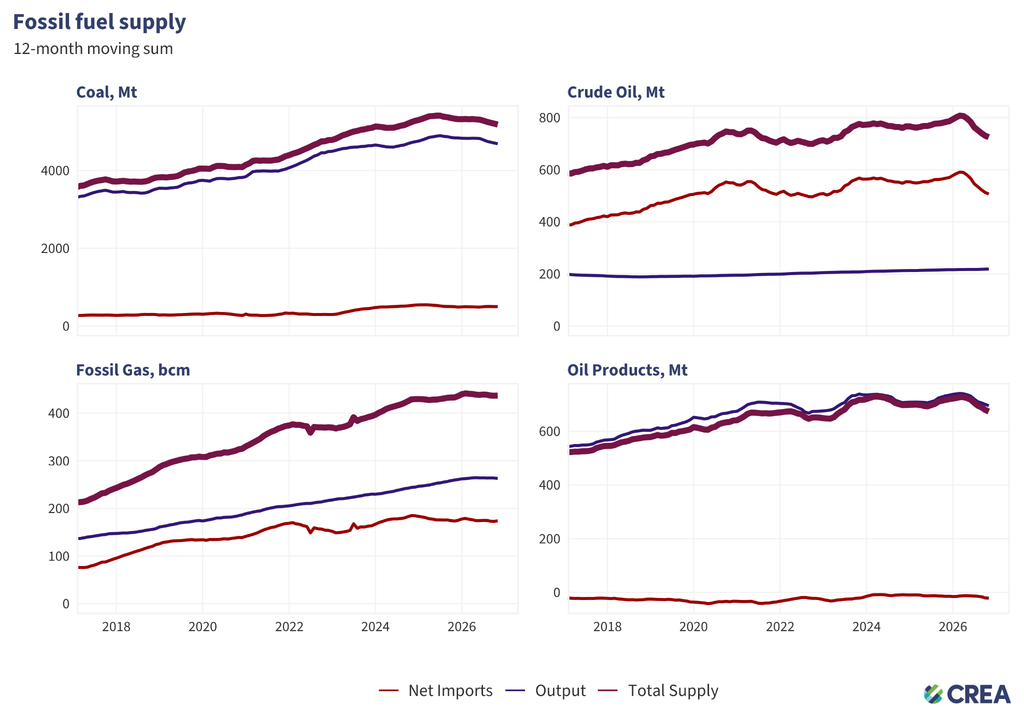
- Coal output fell 5.8% year-on-year in October 2026, bringing production in the first ten months of the year down 3.8% from the same period in 2025.
- Natural gas output increased 0.8% year-on-year in October, while total output across the first ten months of 2026 rose 0.9%.
- Crude oil production increased by 2.3% year-on-year. Output in the first ten months increased by 1.1%.
- Crude throughput fell 8.1% year-on-year in October.
Carbon-intensive industrial output contraction continued
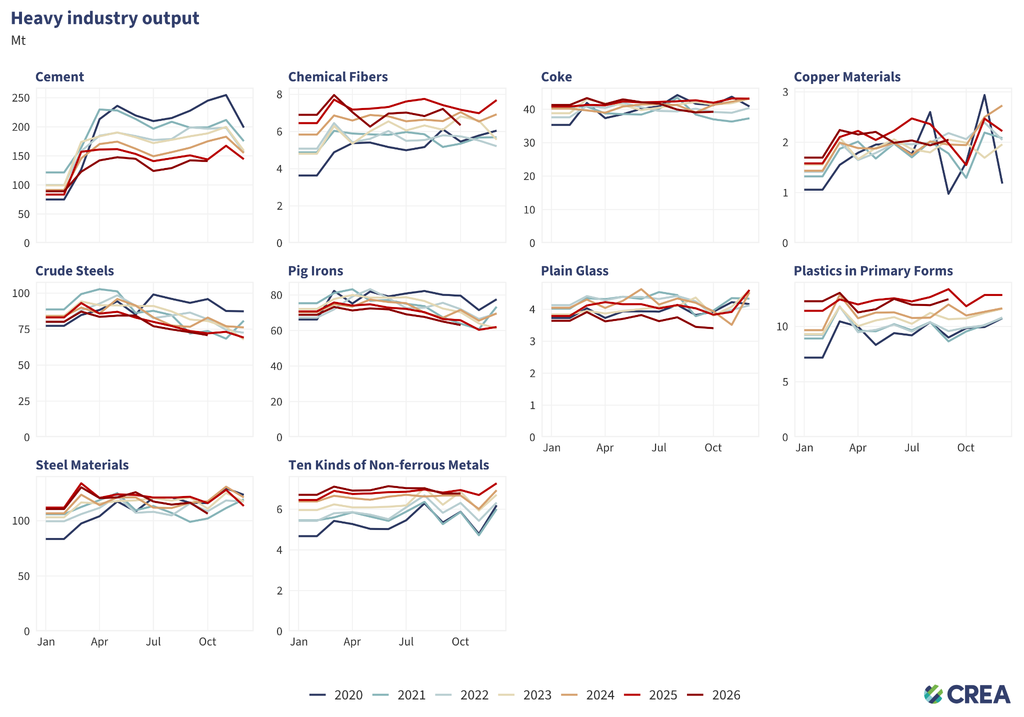
- Crude steel output fell 1.6% year-on-year in October, with cumulative output down 2.8% so far this year. Steel product output fell 5.1% year-on-year in October. Pig iron production remained at a multi-year low.
- Cement output fell 1.3% year-on-year in October, reaching the lowest level for the same period since at least 2020. Output in the first ten months of 2026 was down 7.9% year-on-year, reflecting the decline in China’s real estate sector.
- Chemical fibre output fell 2.9% year-on-year. Non-ferrous metal output fell 1.2% year-on-year.
- Sulfuric acid output fell by 8.6% in October due to the impacts of shipping disruptions in the Strait of Hormuz, which continue to affect supplies of this key input for phosphate fertiliser production.
The steel and cement industries are the largest CO2 emitters in China, when emissions from their electricity use are included. They are also bellwethers of real estate, infrastructure, and other fixed-asset investments that play an outsized role in China’s emissions and economy. Sulfuric acid and chemical fibre output indicate wider trends in China’s emissions-intensive chemicals sector.
Average daily steel output decline continued
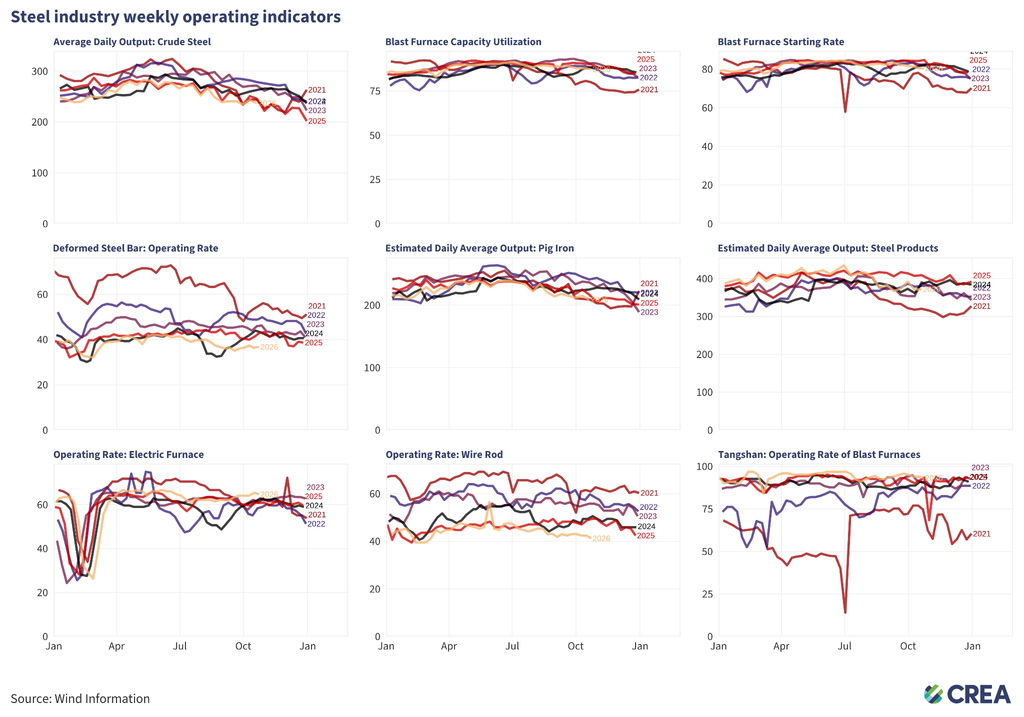
- Blast furnaces for steel production remained active in the last week of October, with a starting rate of 80.4% and utilisation reaching 87.2%. Electric furnace operating rates stayed at 64.7%, slightly above the same period last year.
- Daily crude steel output stayed at the lowest level for the same period since 2021, while daily pig iron and steel products output dropped 3.7% and 9% year-on-year, respectively.
- The operating rate of blast furnaces in Tangshan, China’s ‘steel capital’ and a major source of regional air pollution, reached 93.2% in late October, around the same level for this period as last year.
Hebei Province industrial output is a bellwether of national priorities: when air quality and emissions are priorities, it is the most tightly regulated area because of its impact on Beijing’s pollution levels. Read our October 2026 Air Quality Trends Snapshot here.
Thermal power additions remained at a record high
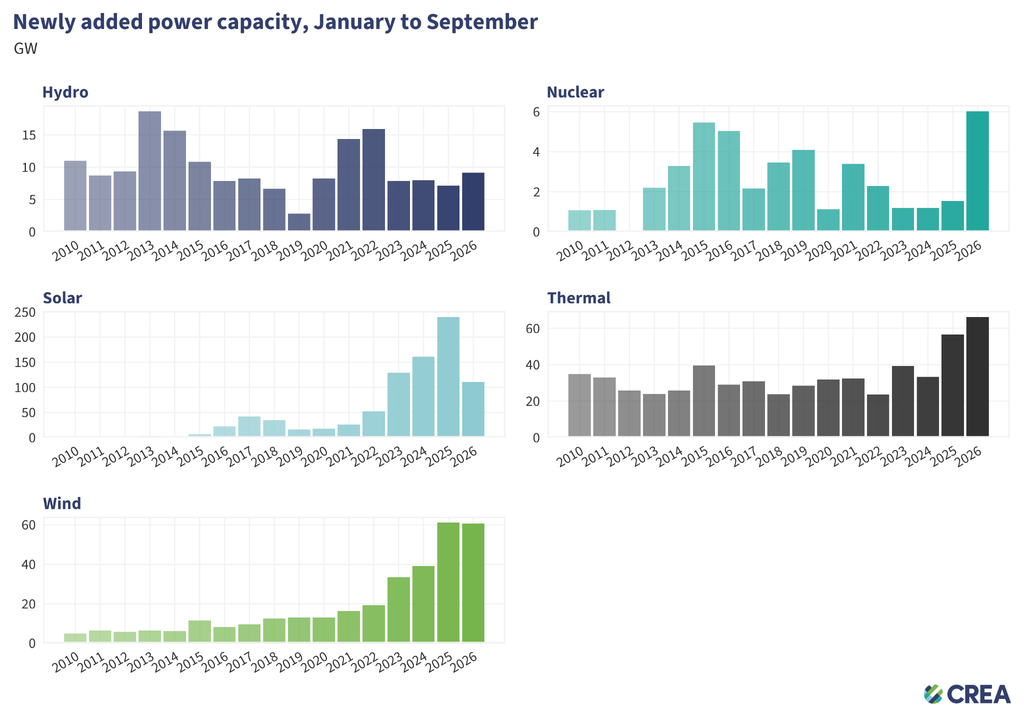
In the first nine months of 2026, China added:
- 110.8 gigawatts (GW) of solar power capacity, down 54% from a very high baseline in 2025.
- 60.7 GW of wind power capacity, down 1% from 2025’s high baseline last year, but still higher than the level of additions in any year prior to 2025.
- 66.2 GW of thermal power capacity, up 17% from last year, a record high for the same period. 2026 is expected to be one of the highest years on record for new coal power capacity coming online, with CREA’s latest coal power biannual review finding that new coal power plants entering operation in China in H1 2026 reached the highest first-half year level since 2016.
- 9.2 GW of hydro power capacity, up 28% from last year.
- 6.0 GW of nuclear power capacity, up from 1.5 GW over the same period last year.
Large-scale clean energy bases continued to lead in wind and solar installations
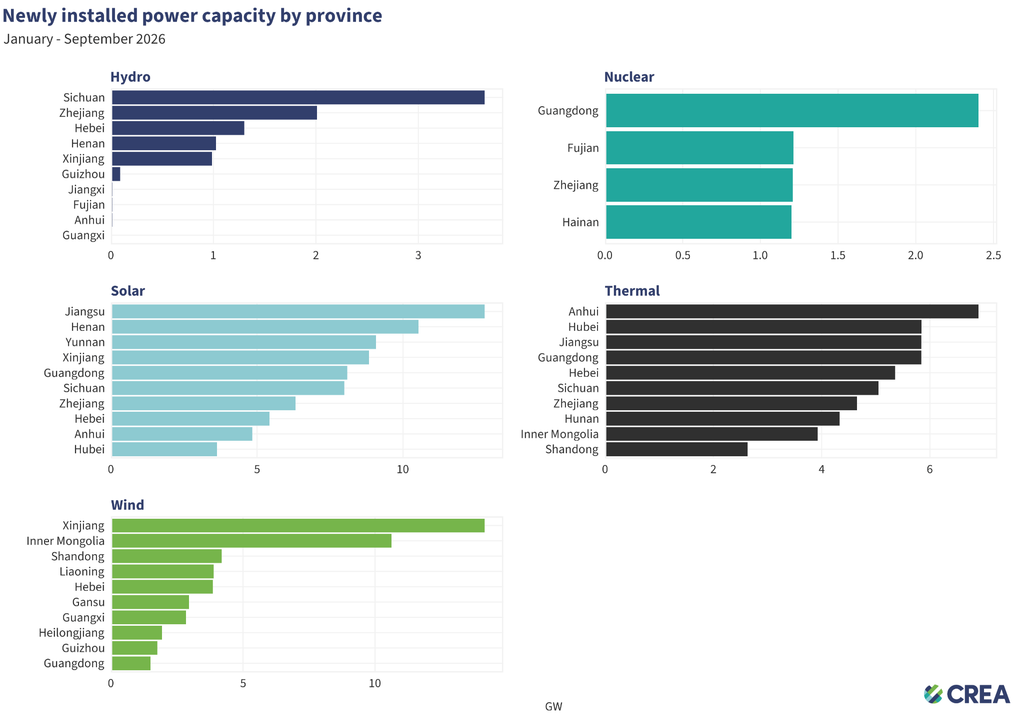
- Solar power installations this year are led by Jiangsu, Henan, Yunnan, and Xinjiang. Yunnan and Xinjiang’s strong showing is notable, as both are set to host new large-scale clean energy bases under a 15th Five-Year Plan (FYP) initiative.
- Wind development was led by Xinjiang, Inner Mongolia, and Shandong. Inner Mongolia is also part of the 15th FYP large-scale clean energy bases initiative.
- Thermal (mainly coal) power additions were led by Anhui, Hubei, Jiangsu, and Guangdong.
Read more: China Coal Power Biannual Review – H1 2026
Solar production decline slowed
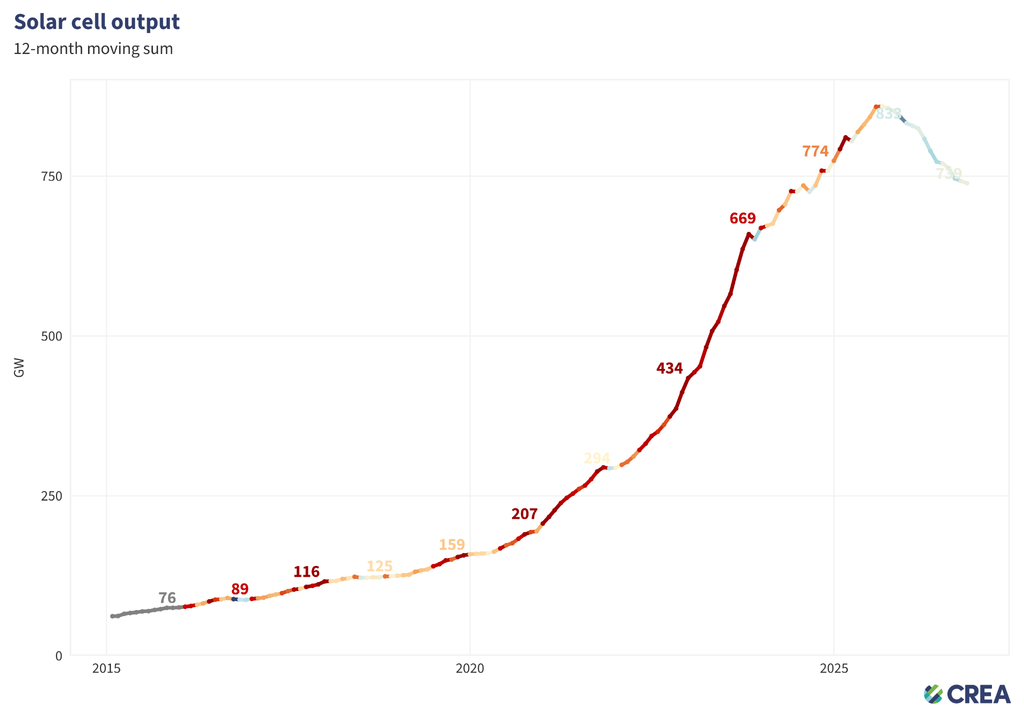
- Solar cell production fell 1.3% year-on-year in October, but the contraction has slowed significantly compared with earlier in the year, suggesting production is bottoming out. In the first ten months of the year, China produced 651 GW of cells; this puts 2026 output on track to comfortably exceed the 660 GW of solar capacity installed globally in 2025, signalling robust demand for solar panels from overseas and domestic markets.
NEV production continued to grow to meet export boom
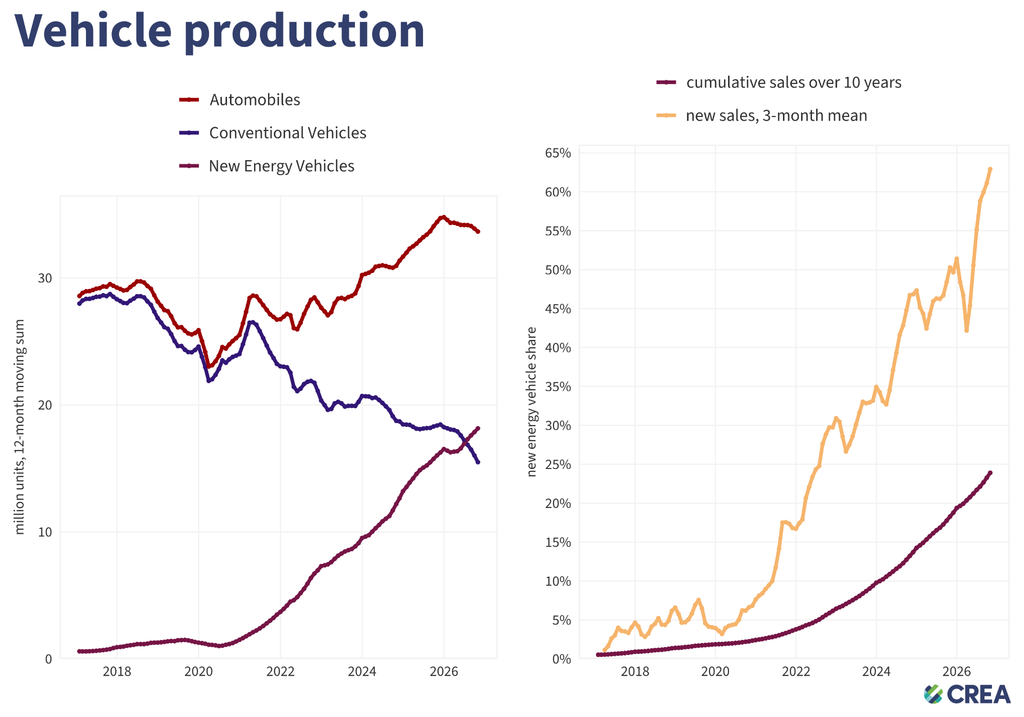
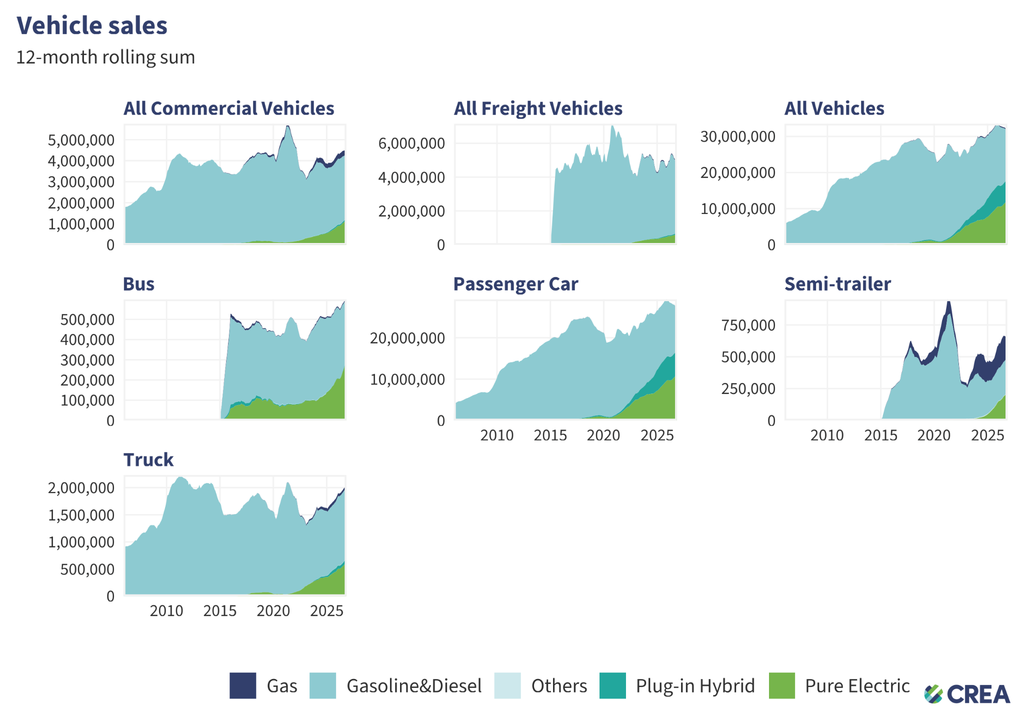
- New Energy Vehicle (NEV) production continued to expand in October, rising 13.8% year-on-year. Production in the first ten months of 2026 was up 11.5%. Overall vehicle production fell 8.8% in October, bringing NEVs to 66% of all vehicles produced.
- NEVs’ share of domestic sales reached 68.4% in October. Domestic NEV sales fell 8.6% year-on-year in October, below the overall decline in domestic vehicle sales — internal combustion engine (ICE) vehicle sales fell by 48.5%.
- NEV exports surged by 140% year-on-year in October, and made up 56.8% of vehicle exports. In the first ten months of the year, NEV exports reached 4.6 million units, up 130% year-on-year.
*NEV production and domestic sales are based on China Association of Automobile Manufacturers (CAAM) data. NEV exports are based on China Automobile Enterprise International Development Innovation Alliance (CAIA) data.
Relevant analysis by CREA:
China weathered the Hormuz shock. Clean energy can make that resilience last.
Analysis: China’s quarterly CO2 falls 3% in largest drop since Covid – Carbon Brief
Analysis: China’s clean-tech exports in 2026 to avoid as much CO2 as Brazil emits in a year – Carbon Brief
Beyond the headline targets: What China’s 15th Five-Year Plans mean for its green transition
Five years on: China seeds overseas renewables growth but coal ban gaps persist
Built for backup, contracted to run: China’s coal support system risks crowding out clean power | China Coal Power Biannual Review H1 2026
China’s new carbon metric leaves Germany-sized gap in its emissions
Reclaiming credibility in China’s steel industry: Climate ambition, financial resilience, and market trust