
By Qi Qin, China Analyst; Danny Hartono, Data Scientist; Lauri Myllyvirta, Lead Analyst; with contributions from Luke Wickenden, Energy Analyst
The disruption to oil flows through the Strait of Hormuz severely tested China’s energy security. Crude oil imports fell sharply, while oil prices and shipping risks increased. Yet, the import reduction did not produce the economic and social disruption in China one might normally expect from a shock of this scale, according to a CREA analysis. In fact, growth in non-fossil generation protected the country from economic costs more than any other in the world.
Key findings
- Temporary adjustments cushioned the oil-import shock. Reduced crude oil stockpiling accounted for 47% of the year-on-year drop in imports between March and August 2026.
- Clean power and transport electrification provided a structural buffer. Electric vehicles (EVs) displaced 38 million tonnes of oil equivalent in March-August 2026, equivalent to around 13% of China’s crude oil imports in the same period of 2025.
- Growth in non-fossil generation reduced coal and gas requirements, saving an estimated USD 9.1 billion in fossil fuel imports since 2020, more than any other country.
- Lower oil and gas imports were not accompanied by a broad-based acceleration in coal use. Coal supply contracted by 3.4% and steam coal consumption fell sharply in Q3. Contrary to some expectations, growth from coal chemicals slowed after the crisis began.
- Further clean-power growth and electrification can meet rising demand while reducing exposure to fuel-supply risks. By 2030, non-fossil power could reach 54% of the generation, or 58% if it also offsets an annualised coal-supply shortfall like that seen in March-August 2026, both exceeding China’s 50% target.
- Additionally, deploying an additional 40 million EVs could save 45 million tonnes of oil annually, while cleaner petrochemical feedstocks could further reduce dependence on oil.
Temporary relief and structural change
China’s immediate adjustment combined changes in inventories, refinery operations, and trade. Changes in implied crude stock balance accounted for around 47% of the year-on-year decline in net crude imports during the first six months of the crisis (between March and August 2026). At the same time, refinery throughput fell by about 9.6%. Lower exports offset roughly 29% of the decline in domestic production of petrol, diesel, and jet fuel. These measures redistributed the shock; they did not necessarily remove the underlying demand for oil.
Accelerated transport electrification provided a structural buffer. In the first six months after the Hormuz crisis, China’s EV fleet displaced an estimated 38 million tonnes of oil equivalent, 52% more than the same period of 2025. This was equivalent to around 13% of China’s crude oil imports in March-August 2025. Clean power provided a complementary buffer. Growth in non-fossil generation since 2020 avoided an estimated USD 9.1 billion in fossil fuel import costs over the same period — the largest savings of any country — primarily by reducing coal and gas requirements. As transport electrification expands, continued clean-power growth can meet more of the additional electricity demand without increasing reliance on fossil fuels.
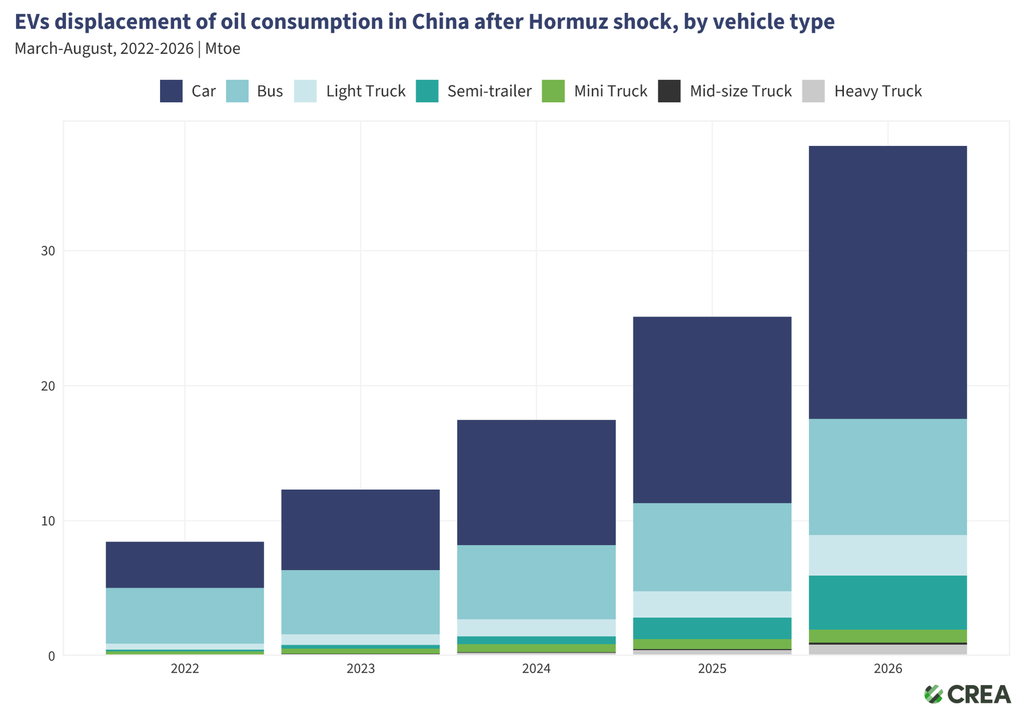
Figure 1 — EVs displacement of oil consumption in China after the Hormuz shock
China’s seaborne coal and gas imports for power generation mostly go to coastal demand centres such as the Yangtze River Delta, Guangdong, Fujian, Hebei, and Shandong. Around 34% of China’s clean power growth from 2020 to2025 happened in those fuel-importing provinces themselves. Including clean power delivered from the north-west via long-distance transmission, the share rises to 38%. The increase in clean power supply to fuel-importing provinces reached 730 TWh — 1.5 times China’s LNG imports if all that gas had been used for power generation.
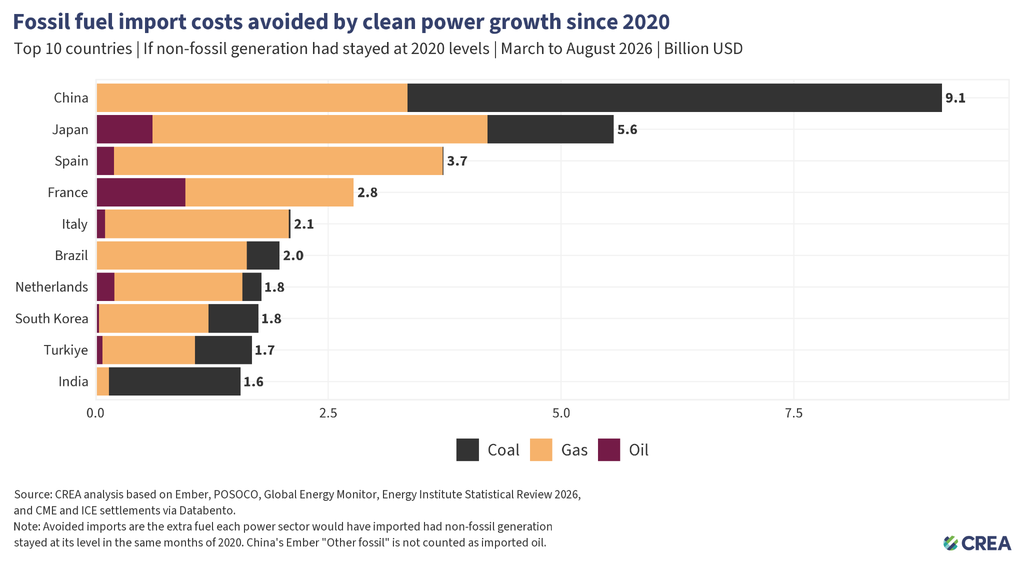
Figure 2 — Fossil fuel import costs avoided by clean power growth since 2020, top 10 countries, March to August 2026
Coal demand growth slows despite the oil and gas shock
China’s existing coal-based energy and industrial infrastructure offers some protection against disruptions to imported oil and natural gas. But this is different from turning to coal in response to the crisis.
China’s coal supply contracted in the six months after the crisis began. Between March and August 2026, domestic coal production plus coal imports fell by 3.4% year-on-year. On the consumption side, steam-coal consumption growth slowed from 4% year-on-year in the first quarter of 2026 to 2.1% in the second, before falling by 2% in July.
In the power sector, gas power generation fell by 4% year-on-year, around 7 TWh, in the first six months after the Hormuz crisis. Over the same period, hydro, nuclear, wind and solar generation rose by 139 TWh, far more than the gas shortfall, while coal power generation remained broadly flat. Additionally, according to the China Electricity Council, large-scale coal power plants used 0.4% less coal and generated 1.6% less electricity in the first nine months of 2026.
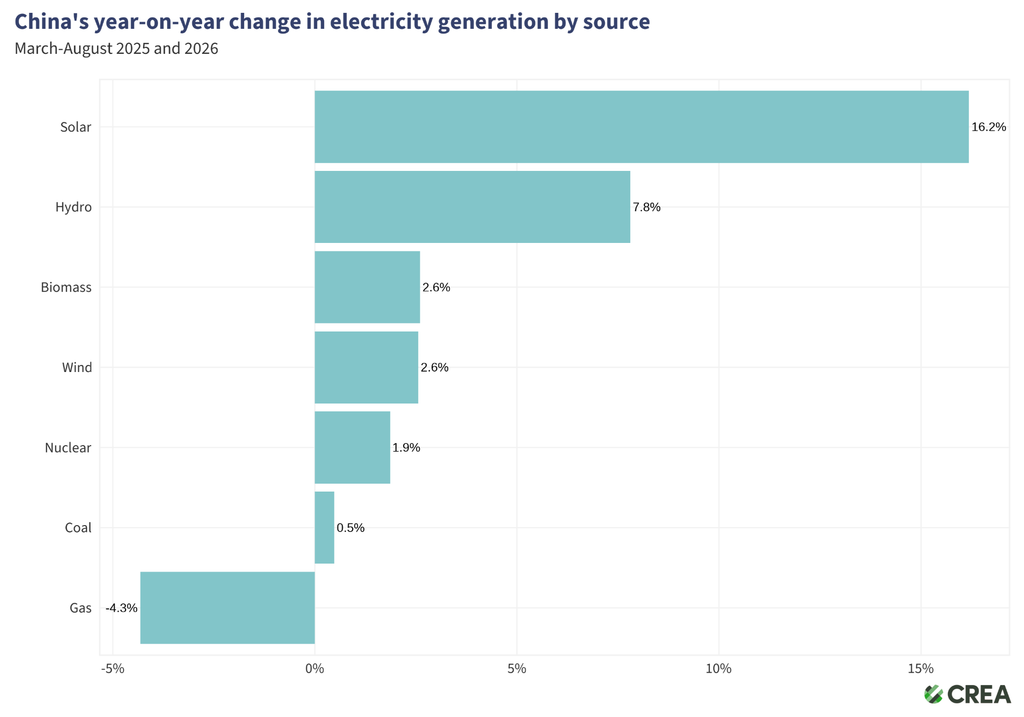
Figure 3 — China’s clean power growth far exceeded the decline in gas generation
Coal consumption in the chemical sector increased 11.6% between March and July 2026, although growth slowed from 18.9% in the first quarter to 8.5% in the second. Coal use in the sector was still rising, but it did not clearly accelerate after the oil shock. Company disclosures suggest that higher chemical output partly reflected earlier developments rather than a new response to the crisis. Chinese coal mining giant China Coal Energy’s first-half polyolefin output rose 14.5%, but the comparison was affected by scheduled maintenance a year earlier. Baofeng, China’s largest coal-to-chemicals producer, reported that feedstock disruptions and rising costs reduced petrochemical operating rates, while coal-based plants maintained high operating rates–a contrast that does not show increased coal-based output to offset the shortfall. Some producers nevertheless adjusted operations. Shenhua, China’s largest state-owned coal mining enterprise and the world’s largest coal producer, attributed higher chemical sales partly to changes in market demand and prices, as well as unusually low sales in 2025.
Some factories may also have used coal instead of natural gas to produce steam and heat for manufacturing. Coal consumption for the heating sector rose 4.6% in the second quarter. Meanwhile, the National Energy Administration reported that industrial gas consumption declined in the first half as some price-sensitive demand was substituted or priced out of the market.
Making energy resilience last to 2030 and beyond
China’s long-term goal is to meet growing energy needs with less exposure to imported fuels. Clean electricity, transport electrification, and cleaner alternatives to fossil-based chemical feedstocks offer complementary ways to achieve this.
China would need around 2,600 TWh of additional annual clean electricity supply by 2030, relative to 2025, to meet the IEA’s projected demand growth without increasing fossil-fuelled electricity supply. This would raise the non-fossil share of electricity generation to approximately 54%, up from 42% in 2025 and above the 50% target set out in China’s 15th Five-Year energy plan.
China’s net coal imports rose year-on-year in the six months following the Hormuz disruption. Higher imports helped compensate for domestic output losses, including those caused by mine closures and tighter safety inspections following the Shanxi mining disaster in May. Between March and August 2026, domestic coal output fell by around 98 million tonnes, while net imports increased by 9 million tonnes, leaving combined supply 89 million tonnes lower than a year earlier. If the same average daily supply shortfall persisted throughout an entire year and were absorbed entirely by the power sector, approximately 420 TWh of clean electricity would be needed annually to replace the associated coal power. This raises the requirement to around 3,030 TWh of additional annual clean electricity supply in 2030 relative to 2025, bringing the non-fossil share of electricity generation to 58%.
| Table 1 — How clean power could bolster China’s energy resilience | ||
| Benchmark | Key assumption | Indicative requirement |
| Clean power meets electricity-demand growth | Fossil-fuelled electricity supply remains at its 2025 level | Non-fossil share of electricity generation reaches 54% in 2030 |
| Clean power also absorbs a coal-supply contraction | The average daily coal-supply shortfall observed in March-August 2026 persists throughout the year and is absorbed by the power sector | Non-fossil share of electricity generation reaches 58% in 2030 |
| Transport electrification sustains lower oil consumption | An estimate of the EV deployment needed to sustain lower oil consumption as temporarily reduced activity recovers | 40 million additional EVs sold in China above the baseline fleet, delivering 45 million tonnes of annual oil savings |
Further transport electrification could help keep oil consumption lower as economic activity recovers. Before the crisis, the IEA expected China’s total oil demand in 2030 to remain broadly at its 2025 level, as declining transport fuel demand was offset by growth in petrochemical feedstocks and other sectors. Faster electrification could bring consumption below this pre-crisis trajectory as the economy recovers. To match the March-September 2026 decline of about 0.9 million barrels of oil per day, around 40 million additional EVs are needed to deliver roughly 45 million tonnes of annual oil savings. This would mean an extra 8 million EVs per year, equivalent to nearly two-thirds of the 12.6 million EVs added in 2025. This would provide lasting fuel savings beyond those already included in the baseline.
China is also exploring cleaner alternatives to petrochemical feedstocks. According to the IEA, China’s petrochemical feedstocks accounted for almost all of China’s oil demand growth in 2025, while transport fuel consumption remained largely flat. Reducing reliance on petroleum-based feedstocks through plastics recycling and cleaner production routes can help sustain the decline in oil demand from transport electrification. China’s recent carbon-peaking action plan calls for replacing oil used in chemical production and exploring green hydrogen, ammonia, and methanol. Further cost reductions and stronger incentives will be needed to scale up these alternatives.
| Methodology Unless otherwise stated, all figures compare March-August 2026 with the same period in 2025. Data sources: Domestic fuel production, refinery throughput and oil-product output are based on National Bureau of Statistics (NBS) data. Import and export volumes are from the General Administration of Customs (GACC). Inventory change: We estimated crude stock changes as domestic production plus net imports minus refinery throughput. The balance was 32 million tonnes lower than a year earlier, accounting for 47% of the decline in net crude imports. Refinery and fuel exports: Refinery throughput fell from 368.9 million tonnes to 333.5 million tonnes, a decline of 9.6%. Lower petrol, diesel, and kerosene exports offset around 29% of the fall in production: 6 million tonnes against 21 million tonnes. Clean electricity requirements by 2030: We subtract China’s estimated 2025 electricity demand of 9,639 TWh from IEA’s projected 2030 demand of 12,250 TWh. Coal-to-electricity conversion: We use a representative thermal-coal heating value of 5,000 kcal/kg (20.9GJ/tonne). Using the China Electricity Council (CEC)-reported 2025 thermal-power supply coal consumption of 301.9g of standard coal per kWh gives approximately 2.37 MWh of net electricity per tonne of coal. Applied to the 89.3 million tonnes supply reduction, this equals about 211 TWh, or 420 TWh if the same daily shortfall persists. EV oil displacement: We use China Association of Automobile Manufacturers sales data, accessed through the Wind Financial Terminal, broken down by vehicle type, size, and powertrain. Annual fuel savings per battery-electric vehicle are calculated by multiplying estimated mileage by the fuel consumption per kilometre of a comparable conventional vehicle. Mileage and fuel-consumption assumptions draw on sources including the International Council on Clean Transportation. For plug-in hybrids, we count 64% of the equivalent fuel savings, reflecting the assumed share of driving on electricity. EV deployment by 2030: We scale from China’s end-2025 fleet of 44 million EVs and estimated oil displacement of 1 million barrels per day. Matching the March-September 2026 decline of 0.92 million barrels per day implies around 40 million additional EVs on the road beyond the IEA’s pre-crisis baseline, assuming unchanged average savings per vehicle. This would deliver approximately 45 million tonnes of annual savings. Spread over 2026-2030, it means 8 million extra EVs per year, equivalent to 64% of the 12.6 million added in 2025. |