Welcome to the Centre for Research on Energy and Clean Air (CREA).
We are an independent research organisation focused on revealing the trends, causes, and health impacts, as well as the solutions to air pollution.
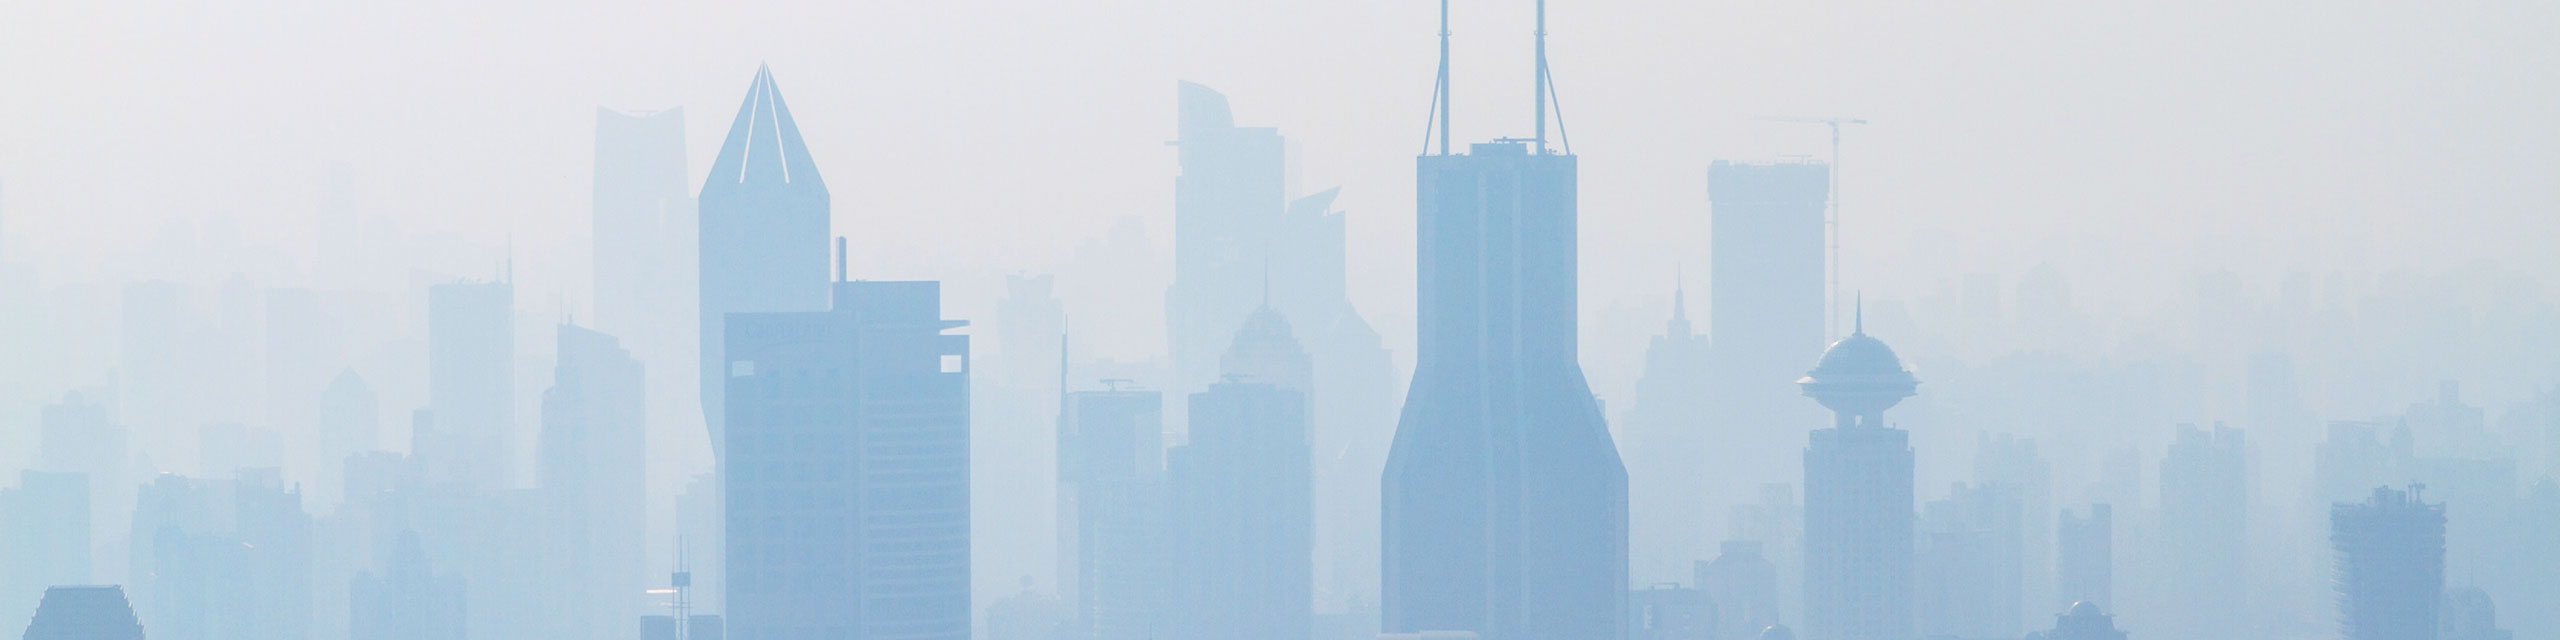
Health-harming pollutants from burning fossil fuels are responsible for at least 3 million air pollution deaths per year. However, rapid advances in modern, clean energy technologies are a key opportunity to improve air quality and protect public health.
We use scientific data, research and evidence to support the efforts of governments, companies and campaigning organizations worldwide in their efforts to move towards clean energy and clean air. We believe that effective research and communication are the key to successful policies, investment decisions and advocacy efforts.
Recent publications
CREA is looking to expand its team, if you are passionate about fighting climate change through data, tracking pollution and supporting organisations to enable the energy transition please consider applying for one of the following jobs.
Latest news
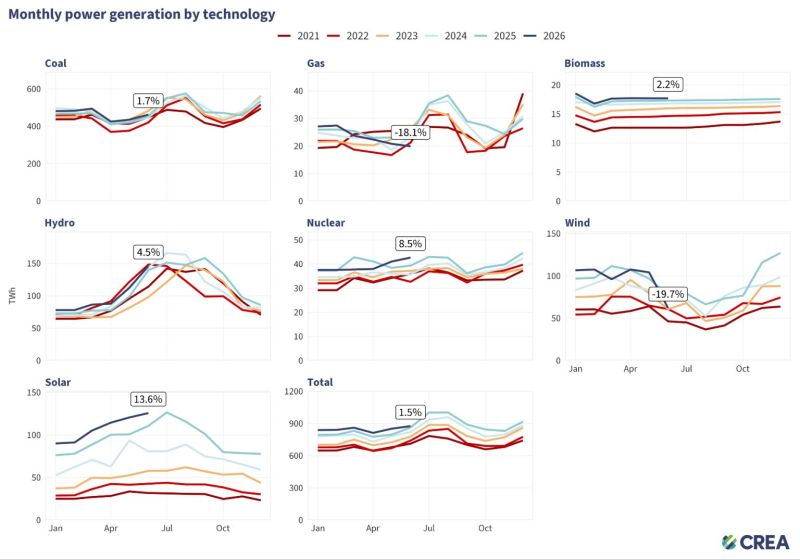
Quarterly energy snapshot for India: Q1 2026-27
Fact sheet: Georgian ports suspected of violating sanctions on Russian oil
China Energy and Emissions Trends – June 2026 snapshot
Latest publications
Exempted but emitting: The largest SO2 sources around Delhi NCR continue operating without control technology
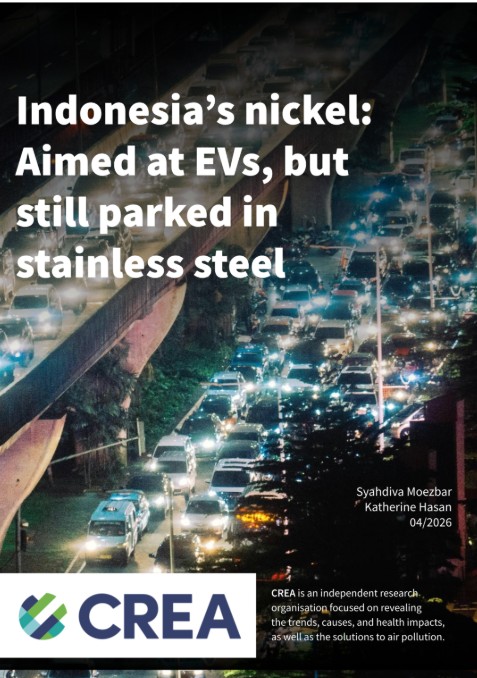
Indonesia’s aluminium downstream: Following nickel into a captive coal boom
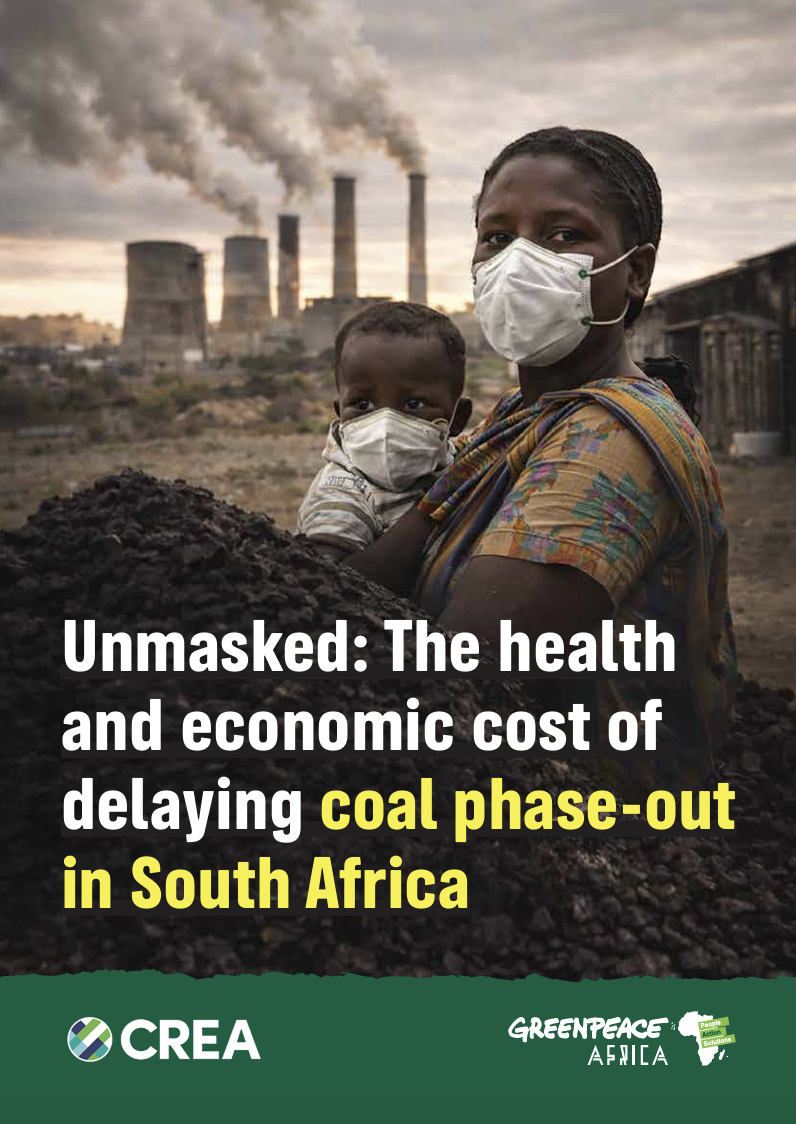
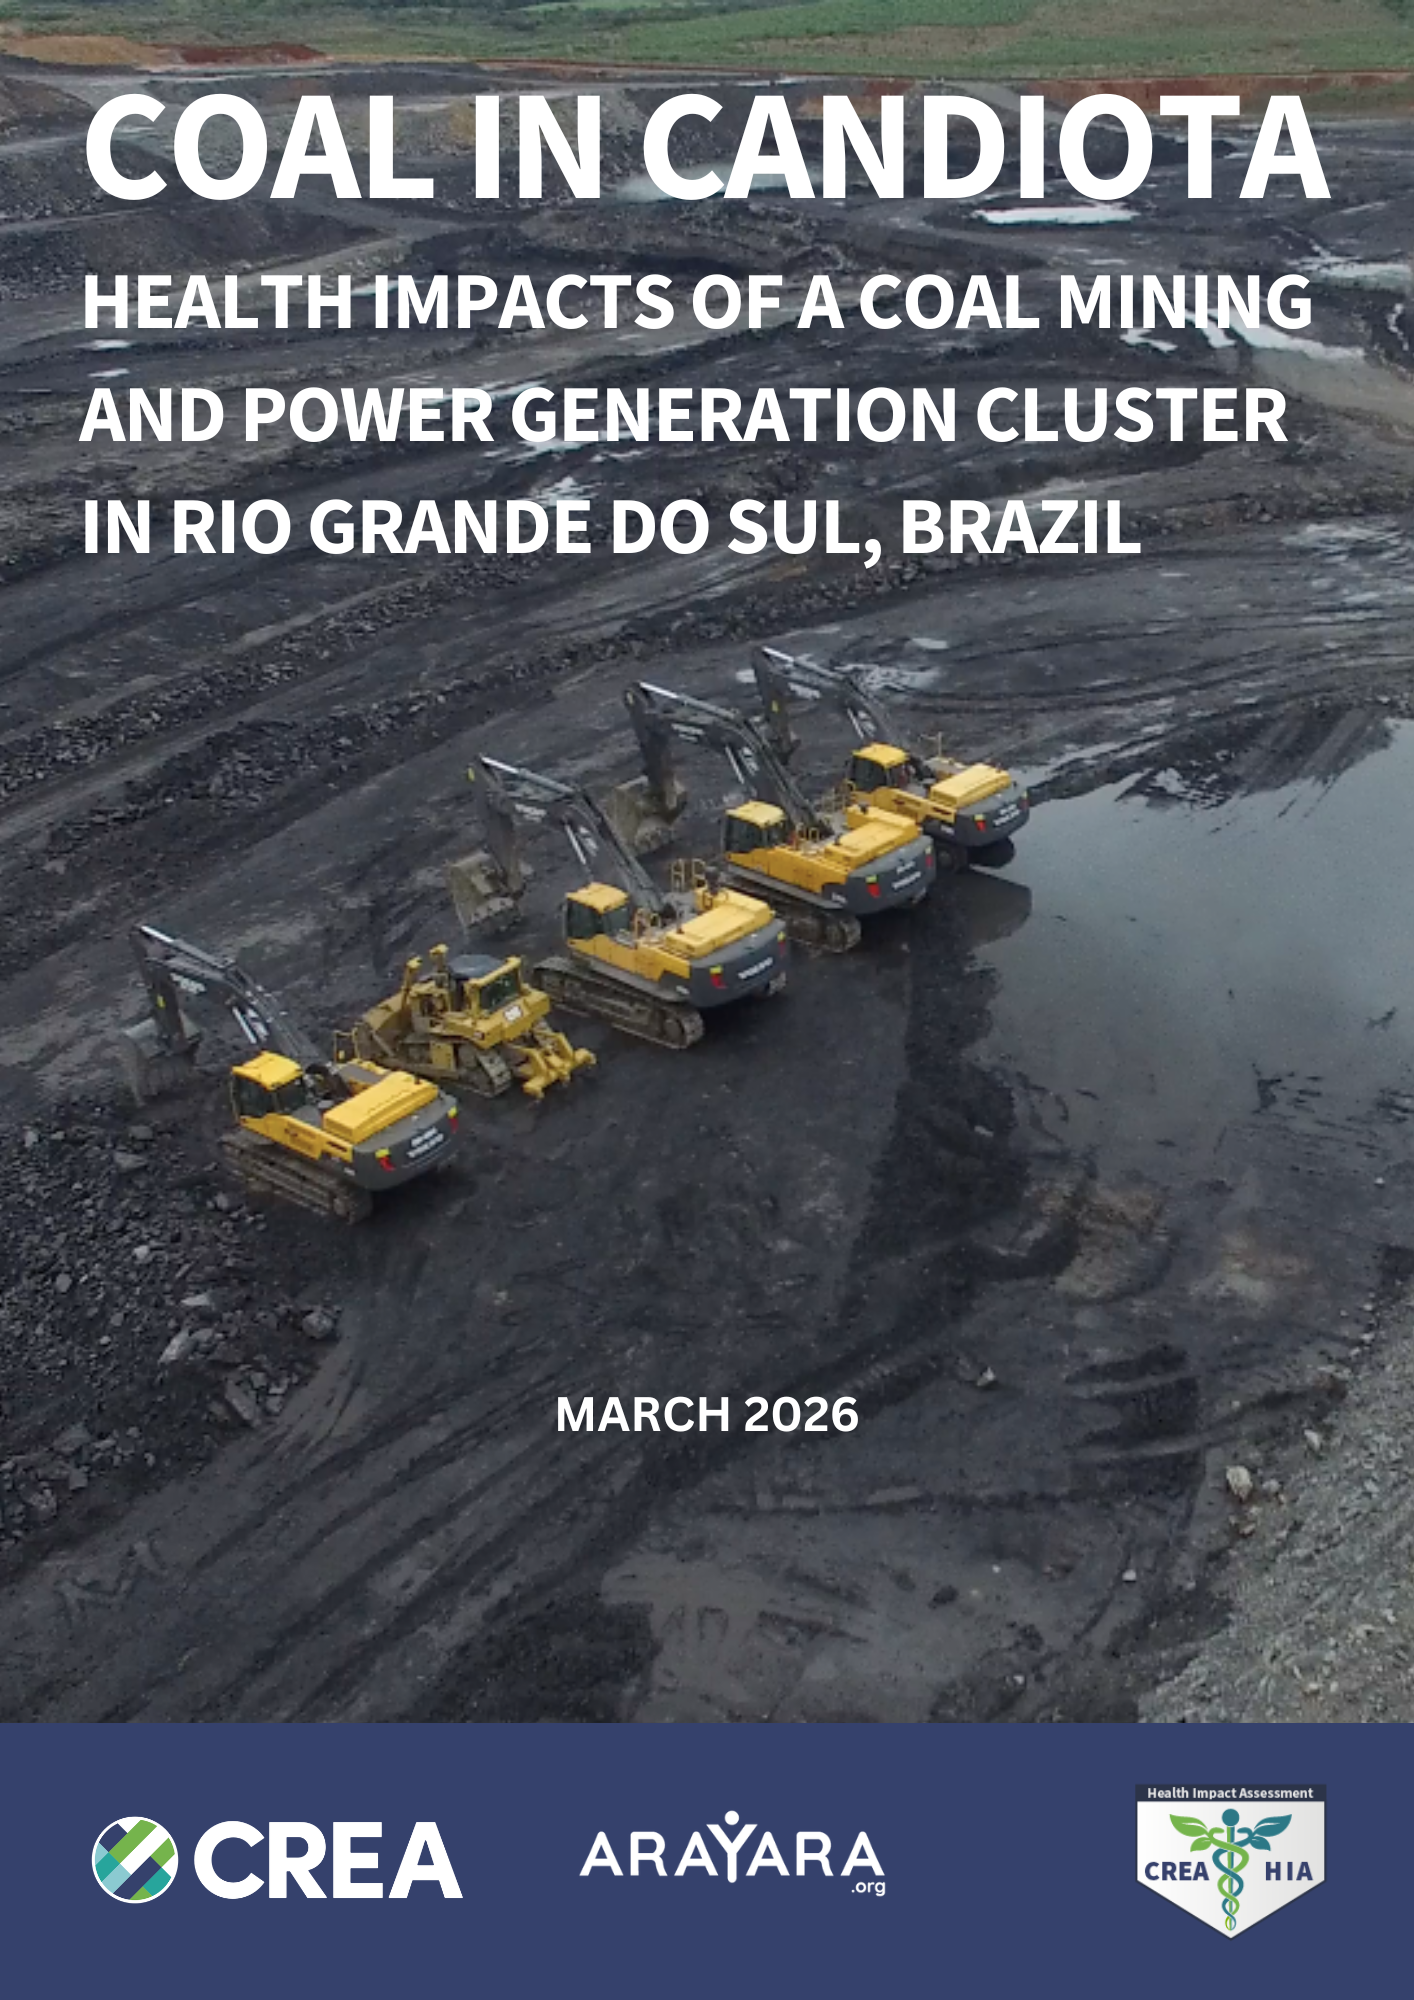
Unmasked: The health and economic cost of delaying coal phase-out in South Africa
CREA @Instagram
🇮🇳 A Super El Niño is coming that will affect energy systems across the world, but India will be hit harder than anywhere else.
🌦️ Due to El Niño, wind and rain patterns will be affected, leading to a cut in India’s hydro and turbine power generation. Extreme high temperatures will drive up the demand for air conditioning. Within a year, India could be looking at a power gap of 18 TWh.
⚡️ This power demand gap could lead to a surge in coal-fired power that is estimated to release 17 million tonnes of CO2.
💨 Consequently, increased carbon dioxide emissions will cause more extreme temperatures and air pollution, leading to an estimated 2,700 deaths.
☀️ There is another way. Less affected by El Niño, solar power is playing an increasingly pivotal role in powering India’s grid, now meeting 24% of daytime power demand.
💡 Every additional solar panel and battery installed is a step towards future-proofing the grid against an extreme weather pattern like this one.
#India #ElNiño #heatwave #solarpower #fossilfuel

🇮🇩 Indonesia’s aluminium industry is expanding rapidly through downstream industrialisation, but a critical question remains: what will power this exponential industrial growth?
🚨 9.8 GW, or 78% of identified power capacity (operational and planned) for aluminium projects, comes from captive coal power plants. This figure risks locking the aluminium industry into carbon-emitting fossil fuels, similar to Indonesia’s nickel boom.
💡Indonesia’s aluminium industry has a geographical advantage over high-carbon emitter industries: Indonesia’s bauxite reserves are highly concentrated in West Kalimantan, the Riau Islands, and Central Kalimantan, with significant potential for regional grid integration and access to renewable energy resources. Note: North Kalimantan’s mega-hydropower projects and high-yield solar corridors.
🍃 The aluminium sector possesses both the utility and geographic positioning to increasingly decouple from fossil-fuel dependencies.
Read the full briefing, tap link in bio
#energytransition and #Indonesia #Aluminium #coal #crea
[CleanEnergy,Solar, Cleanair, Sustainable-development, Hilirisasi,Bauxite, Hydropower, Kalimantan]
🇨🇳 NEW | China Energy and Emissions Trends – May 2026 snapshot | EN & CN
In May 2026:
🪨 📈 Fossil power generation rose 2% YoY, with curtailment possibly playing a role but weak wind as the key driver and likely to reverse quickly
🔥 📈 Thermal power commissioning in the first four months of 2026 surged by 116% YoY
☀️ 🍃 Solar power capacity additions fell by 52% YoY due to the high base in the same period last year, while wind power additions rose by 6.5%
🏗️ 📉 Industrial value-added growth rebounded modestly in May but remained weak, with steel and cement output continuing to fall YoY
:car: :chart_with_upwards_trend: New energy vehicles (NEVs) continued to outperform the broader auto sector share of total vehicle production at 57% & exports more than doubled to a record high; fuel-burning vehicle production fell sharply by 22%
Read the full snapshot, tap the link in bio
#China #AirQuality #CREAmonthlies #Energy #fossilfuels
In early June this year, #IndonesianRupiah hit a record low against the US dollar. 💵
Our lead analyst, Lauri Myllyvirta, shares his insights into the key reasons behind it. He attributes this depreciation in the currency’s value to Indonesia’s
🛢️ heavy reliance on fossil fuel subsidies,
💸 vulnerability to global oil price spikes, and
🔋 slow pace of its transition to clean energy.
Read the full piece to understand how Indonesia can future-proof itself against such vulnerabilities, link in bio.
#TransisiEnergy #Fossilfuel #Oil #Indonesia
Do you remember the Dieselgate Scandal? 🚗💨
In 2015, it was found that certain car manufacturers were bypassing emissions standards by installing illegal defeat devices in diesel vehicles. These defeat devices would allow these cars to emit twice the legal limit of Nitrogen Oxide (NOx).
🌱 This #cleanairday 2026, we revisit our health impact assessment, ‘Health impacts of diesel vehicles suspected of using prohibited defeat devices in the EU and UK’, which found that in the UK, such vehicles are responsible for causing,
💨 41,000 new childhood asthma cases
💨 22,000 premature deaths
💨 500 preterm births
CREA advocates and urges policymakers to further investigate and vehicle recall to identify and prevent the usage of illegal defeat devices in diesel vehicles.
To read the full report, comment ‘UK’
#airpollution #UK #cleanair #dieselvehicles
In this health impact assessment (HIA), the air quality impacts of the South African government’s plan to delay the phase-out of coal-fired power plants point to a substantial increase in public health burden.
In this video, CREA’s lead author on the report reveals the devastating health and economic consequences of delaying the phase-out of coal-fired power in South Africa. He highlights how this delay will affect large populations far from the original source because #airpollution is transboundary in nature. This makes air pollution from delaying the coal phase-out a national issue, and not just a local one.
Tap link in bio to learn more
#SouthAfrica #Greenpeace #CREA #coal
[public health, data, research, coal power, Johannesburg, children, health, asthma, economic loss, economy, health impacts]
🍃From Europe to Indonesia, from India to Brazil, this #worldenvironmentday, the Centre for Research on Energy and Clean Air revisits some of its evidence-based research revealing the impacts of fossil fuel usage on economies and public health across the globe, as well as the solutions in the energy transition 🌎⚡️
✉️ To learn more about the impacts of nonfossil fuel sources in your country, tap the link in bio and subscribe to our newsletter
In our latest China Energy and Emissions Trends – April 2026 snapshot, data shows that coal power is on the rise in China again despite continued growth in wind and solar. The key takeaways of the snapshot are:
🌿❗Weak clean power growth this year reflects not just poor weather but also grid congestion & rising clean power curtailment
🪨 🌿 This is exposing the structural tension between continued coal expansion and clean energy growth during a fossil fuel crunch
🔥 📈 Thermal power commissioning in Q1 surged by over 160% YoY, reaching a record high
☀️ 🍃 Solar power capacity additions fell by 31% YoY due to the high base in the same period last year; wind rose by 8%
🛢️ 📉 Shipping disruptions in the Strait of Hormuz saw crude oil & natural gas imports falling by around 20% and 13% YoY, respectively
🏗️ 📉 Industrial value-added growth weakened, with parts of the chemical sector weakening due to Strait of Hormuz disruptions
☀️ 📉 Solar cell production fell 25.6% YoY, suggesting China’s sector is adjusting after last year’s rapid deployment boom
🔋 📈 Battery output remained strong, rising 55.6% YoY, supported by energy storage demand and exports
🚗 📈 NEVs continued to outperform the broader auto sector, with share of total vehicle production rising to 51% & exports more than doubling to a record high for the month
To learn more, tap on the link in bio
#china #energy #creamonthlies #fossilfuels #renewable
🇨🇳 China air quality trends snapshot, April 2026
In April 2026, after China tightened annual PM2.5 standards from 35 to 30 µg/m³ in March, the number of provincial capitals failing to comply rose sharply from 6 in Feb to 17 by the end of April.
Further key insights of the April 2026 China air quality trends snapshot:
⚠️💨 Non-compliant cities were concentrated not only in the Beijing-Tianjin-Hebei region but also in parts of the Northeast and Northwest
📈🌦️ PM2.5 levels rose YoY in only 3 provincial capitals in April, compared with 18 in March. Weather strongly shaped PM2.5 outcomes, especially in northern cities
⚠️💨 Several northern industrial or transport-hub cities showed consistently high PM2.5 and O₃ levels (Zhengzhou, Lanzhou, Yinchuan, Xi’an, Taiyuan, Shijiazhuang)
⚠️💨 Tianjin, Xi’an, Taiyuan, and Lanzhou all ranked high for NO₂ and also appeared among the higher-ranking cities for PM2.5 and/or O₃
📉💨 Many southern capital cities saw notable drops in Ozone and PM2.5 simultaneously (Chongqing, Guangzhou, Changsha, Hefei, Guiyang, Shanghai)
Tap the link in bio learn more
#china #airpollution #CREAmonthlies #Beijing #cleanenergy
In 2025, the South African Department for Mineral Resources and Energy (DMRE) released a new Integrated Resources Plan that continues and formalises plans to extend the operating lifetimes of ten Eskom-operated coal-fired power plants, with some plants running for at least an additional decade.
This shift delays coal phase-out and is in direct opposition to South Africa’s climate commitments. The transboundary nature of air pollution makes it impossible to ignore, as climate change is already intensifying across Africa. Increasing heat, drought, floods, food insecurity, water stress, and health risks are placing growing pressure on livelihoods and public systems.
The latest health impact assessment (HIA) from CREA, Greenpeace Africa and GroundWork quantifies the air quality impacts of the South African government’s plan to delay the phase-out of coal-fired power plants and reveals that this delay will result in devastating health and economic consequences.
Keeping plants open beyond their planned retirement dates will cause an estimated 32,000 additional premature deaths between 2026 and 2050. The health burden extends heavily to children. The delay will result in 41,000 additional preterm births and 17,000 new cases of childhood asthma.
Read our full analysis to learn more, link in bio
#SouthAfrica #Airpollution #Greenpeace #CREA #Coal
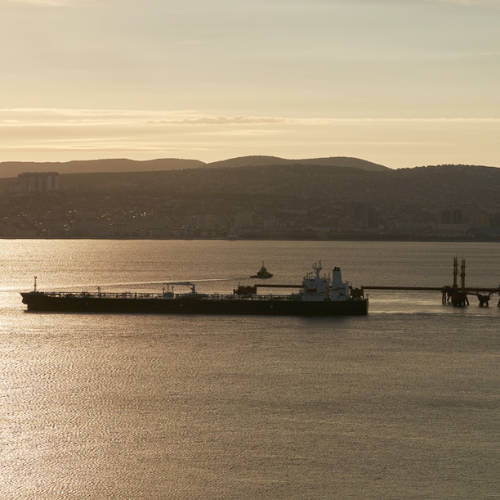
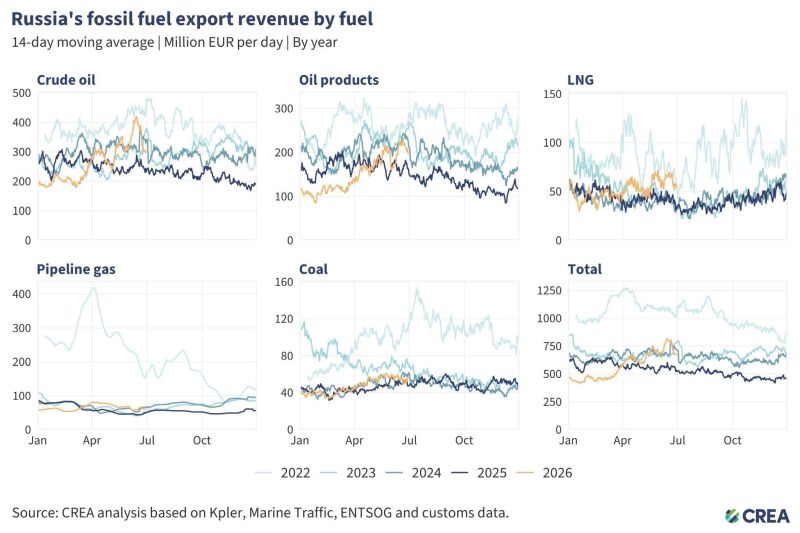
📈 In April 2026, Russia’s monthly fossil fuel exports recorded the highest revenues in two and a half years – EUR 734 mn per day
In April, the top importers of RU fossil fuels were:
🇨🇳 China
🇮🇳 India
🇹🇷 Turkiye
🇪🇺 EU
🇸🇦 Saudi Arabia
🇪🇺 Despite the EU’s ban on Russian spot LNG imports taking effect on 25 April 2026, unloaded volumes fell by just 8% month-on-month
In March, the top EU importers were:
🇫🇷 France
🇭🇺 Hungary
🇧🇪 Belgium
🇸🇰Slovakia
🇪🇸 Spain
📈 Russia exported EUR 189 mn of crude oil via the Druzhba pipeline in April. This was delivered to Hungary and Slovakia after the pipeline resumed operations following nearly three months of inactivity
⚠️ Despite the EU’s ban on oil products made from Russian crude, 8 shipments still unloaded at EU ports from refineries running on Russian crude
💡 A massive spike in oil prices following the closure of the Strait of Hormuz has led to a rethink of a maritime services ban for Russian oil to ensure supplies for global markets
🏛️ CREA reiterates the need to practice strong enforcement of the price cap policy & address attestation fraud to adequately crunch Russian revenues
🇷🇺 Head to the link in bio and read CREA’s monthly analysis on fossil fuel exports from Russia
#russia #ukraine #eu #fossilfuels #straitofhormuz
⚡On January 9, 2026, India saw a new peak power demand at 245 GW. This peak demand was largely met by thermal power providing 67%, but renewable energy, notably solar at 20%, fulfilled the remaining demand, rendering the potential of renewable energy evident.
In the first edition of our newly launched India Quarterly Energy Snapshot – Q4 2025-26, analysts highlight that in India, renewable energy can meet the power demands yet a robust infrastructure of battery energy storage systems is the need of the hour.
Here are the key takeaways of the assessment:
☀️📈 India generated 464 BU of electricity, up 3% YoY and driven by strong growth in non-fossil power generation, particularly solar
🪨📉 Coal & lignite generation both declined by 1%, while solar (+24%), wind (+11%), nuclear (+10%), & large hydro (+75%) all increased
❗Roughly 27 GW of solar and 4 GW of wind were curtailed, while an additional 83 GW of solar and 11 GW of wind were curtailed under India’s Tertiary Reserve Ancillary Service (TRAS)
❗Gujarat in Western India recorded the highest levels of direct and TRAS-related curtailment, highlighting growing challenges in integrating clean energy into India’s grid
🥇Maharashtra in Western India recorded the highest state-level peak demand (32 GW) in Q4 2025-26, followed by Gujarat (25 GW) & Uttar Pradesh (23 GW)
🔌🌿Capacity additions were led by renewables at 16.2 GW, compared with 2.3 GW of thermal and 0.5 GW of large hydro
🔥India commissioned 2.3 GW of new thermal capacity (all coal-based), down 18% YoY; no thermal capacity was retired
To read the full snapshot, tap on the link in bio.
#airpollution #renewableenergy #solarpower #india #cleanenergy
CREA @X
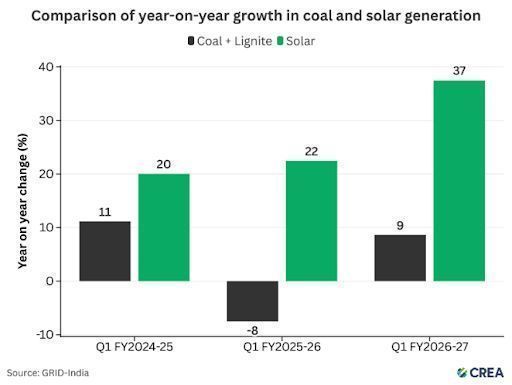
🇮🇳 NEW | #India Quarterly #Energy Snapshot is out now!
☀️ 📈 India’s #solar generation rose 37% YoY in Q1 2026–27 as fastest-growing major source of #electricity generation
💡🌙 #EnergyStorage began contributing to nighttime peak demand⤵️
https://energyandcleanair.org/quarterly-energy-snapshot-for-india-q1-2026-27/
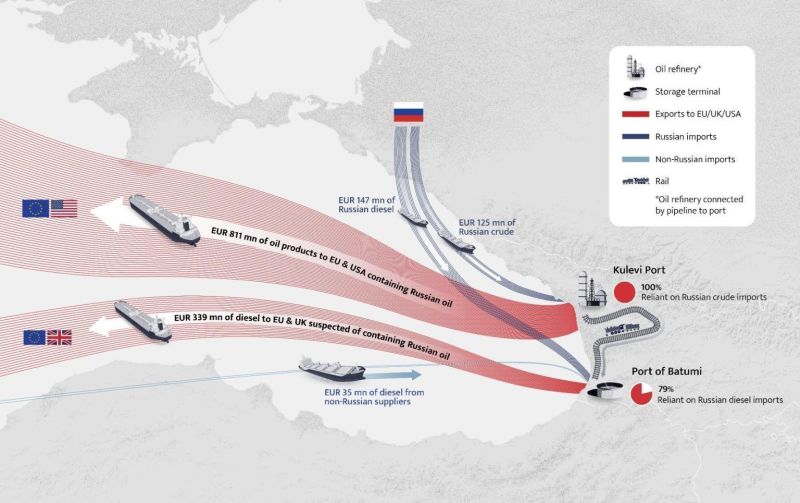
🇷🇺 🇬🇪 NEW | FACT SHEET: Georgia's Black Sea ports of Kulevi & Batumi exported EUR 1.2 bn of fuels suspected of containing Russian oil to sanctioning countries
🏛️ Sanctions must address Russian-supplied oil hubs
http://energyandcleanair.org/fact-sheet-georgian-ports-suspected-of-violating-sanctions-on-russian-oil/
@IsaacLevi777 @ifactgeorgia
@IsaacLevi777 @ifactgeorgia 📣 🇪🇺 🏛️ UPDATE: On 23 July 2026, the EU's 21st sanctions package against Russia was announced and includes Kulevi refinery:
https://www.consilium.europa.eu/en/press/press-releases/2026/07/23/21st-package-of-sanctions-eu-hits-russian-energy-financial-services-and-crypto-hard/
Read more here:
https://sovanews.tv/en/2026/07/23/eu-includes-kulevi-refinery-in-21st-sanctions-package-against-russia/

📢 We are hiring!
📊 Data Scientist - Energy & Air Quality
📍Remote - Europe
The Data Scientist will sit within new responsive unit with new Insights Analyst & work with diverse datasets to respond quickly to emerging energy & AQ events👇️
https://energyandcleanair.org/jobs/?jobId=L8F3HqO8_v8O
#ClimateJob

📢 We are hiring!
Insights Analyst - Energy & Air Quality
📍Remote - Europe
The Insights Analyst will sit within new responsive unit with new Data Scientist & produce high-impact analysis on fast-moving energy & AQ developments👇️
https://energyandcleanair.org/jobs/?jobId=WHZ5cGNitd-C
#ClimateJob #Job

🇨🇳 NEW | #China #Energy and #Emissions Trends – June 2026 snapshot
🪨📈 #Fossil power generation rose 0.5% YoY in June and 2% in Q2, but remained below its 2023 peak. Bad wind conditions and #solar curtailment left space for coal to inch up despite huge capacity increases
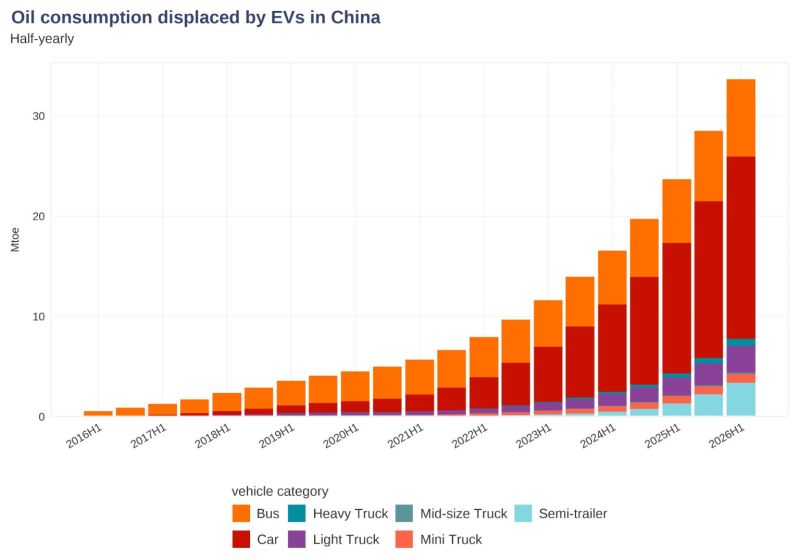
🚗📈NEVs accounted for over 50% of monthly vehicle exports for the first time in June, as NEV exports surged 160% YoY. In H1 2026, NEV exports grew 120% YoY

🇨🇳 CREA's June 2026 China Energy and Emissions Trends is now available in EN & CN👇
http://energyandcleanair.org/china-energy-and-emissions-trends-june-2026-snapshot/
*Image: Imaginechina/Sipa USA/Alamy

Every delay in controlling SO₂ emissions means another day our children breathe toxic air. We cannot keep trading public health for administrative convenience. Reinstate mandatory FGD installation, publish real time emissions data & put people's health before polluters' profits.
🇨🇳 NEW | #China H1 2026 #Airquality review| EN & CN
#EV-related oil cuts drove China’s clean air progress in H1 after #Hormuz disruption 🧵⤵️
📈🌦️Northern cities saw the clearest PM2.5 rebound in H1 2026, largely due to unfavourable weather conditions
🇨🇳 CREA's China H1 2026 Air quality review is now available in EN & CN👇
http://energyandcleanair.org/china-h1-2026-air-quality-review/
*Image: Xinhua/ Alamy

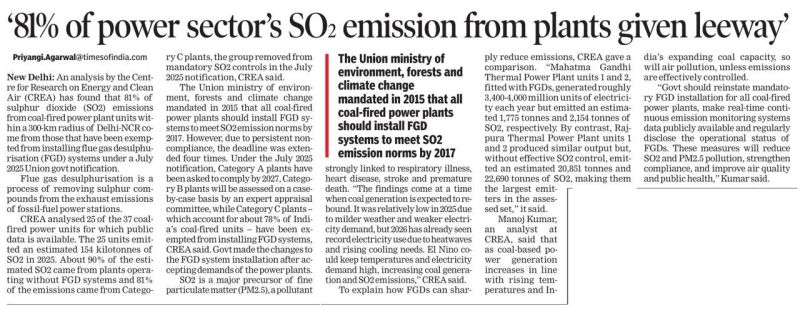
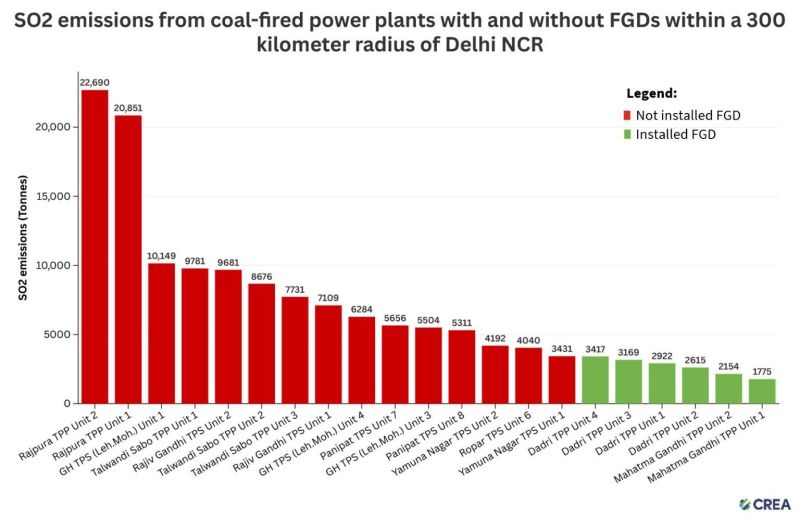
🇮🇳 NEW | #India's #coal-fired power plants exempt from flue gas desulphurisation (#FGD) systems emit 81% of power sector-generated #SO2 within 300 km of #Delhi-NCR
http://energyandcleanair.org/publication/exempted-but-emitting-the-largest-so2-sources-around-delhi-ncr-continue-operating-without-control-technology/
@manoj_kumar_nr
🇷🇺 NEW | Monthly analysis of Russian fossil fuel exports & sanctions
In June 2026, Russia’s fossil fuel export earnings fell 1%
🇫🇷 🚨 Meanwhile, France’s LNG imports climbed 34% 📈
@TheEconomist 🏴☠️ As flag registries crack down on Russia's ‘shadow’ fleet, vessels are shifting to new jurisdictions rather than leaving trade
🇷🇺 Russia's own registry is also expanding, with sanctioned tankers flying the Russian flag increasing from 125 at the end of 2024 to 219 by June 2026

@TheEconomist 🇷🇺 CREA’s monthly analysis on fossil fuel exports from Russia is now available here in EN & 🇺🇦 UA soon to follow:
https://energyandcleanair.org/june-2026-monthly-analysis-of-russian-fossil-fuel-exports-and-sanctions/
Find all related CREA data here:
https://energyandcleanair.org/financing-putins-war/
#FinancingPutinsWar #StandWithUkraine
