By Qi Qin, China Analyst; Danny Hartono, Data Scientist; with contributions from Lauri Myllyvirta, Lead Analyst
April saw coal power generation continue to rebound after its 2025 decline, as Hormuz Strait shipping disruptions weighed on China’s energy imports. Industrial value-added growth slowed markedly, solar cell production remained weak, while new energy vehicles stood out as a bright spot.
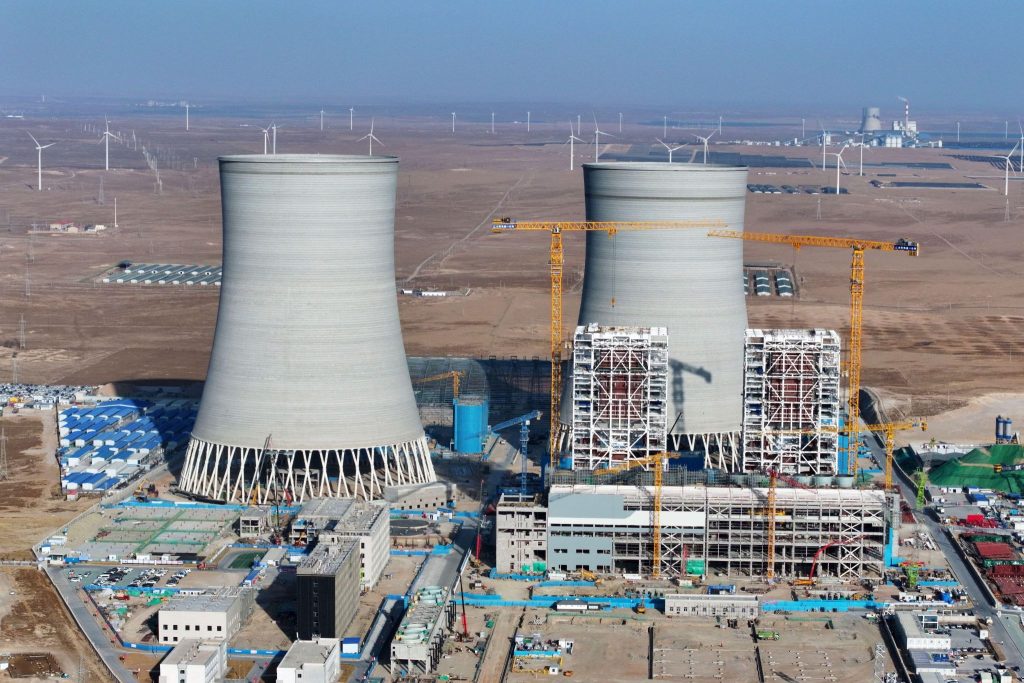
Construction site of the Ningxia Electric Investment Yongli 2×660 MW coal-fired power project in Yinchuan, Ningxia, March 2026. Photo: Alamy.
Key findings
- April saw coal power rebound further despite continued growth in wind and solar. Total power generation is estimated to have risen 6.6% year-on-year, but weak wind conditions, subdued solar performance, and extended nuclear refuelling outages pushed coal power up for the fourth consecutive month. Hydropower provided some support, while gas-fired generation fell amid disruptions to gas supply linked to the Strait of Hormuz.
- Weak clean power growth this year reflects not only poor weather, but also grid congestion and rising curtailment affecting wind, solar, and even nuclear output. This is exposing the structural tension between continued coal expansion and clean energy growth during a fossil fuel crunch.
- Thermal power commissioning in the first quarter surged by more than 160% year-on-year, reaching a record high. Solar power capacity additions fell by 31% year-on-year due to the high base in the same period last year, but remained above the level seen in the first quarter of 2023. Wind power additions rose by 8%.
- In April, shipping disruptions through the Strait of Hormuz weighed heavily on China’s energy imports, with crude oil and natural gas imports falling by around 20% and 13% year-on-year, respectively. Coal imports also declined, mainly due to relatively high import prices. The pressure on energy supply also fed through to the refining sector, prompting China to prioritise domestic fuel supply and cut exports of refined products.
- Industrial value-added growth slowed in April as steel, cement, and parts of the chemical sector weakened. Cement output remained at its lowest level for the same period since 2020, while chemical fibre output fell for the first time in 22 months. The fossil fuel crunch linked to Strait of Hormuz disruptions added pressure on the chemical industry.
- Solar cell production fell by 25.6% year-on-year, reflecting weaker domestic installations and a slight pullback in exports following the March surge. The decline suggests that China’s solar manufacturing sector is adjusting after last year’s exceptionally rapid deployment boom. Battery output remained strong in April, rising 55.6% year-on-year, supported by energy storage demand and exports.
- New energy vehicles (NEVs) continued to outperform the broader auto sector in April, with their share of total vehicle production rising to 51% and exports more than doubling to a record high for the month.
Coal power rises again as wind, solar, and nuclear underperform
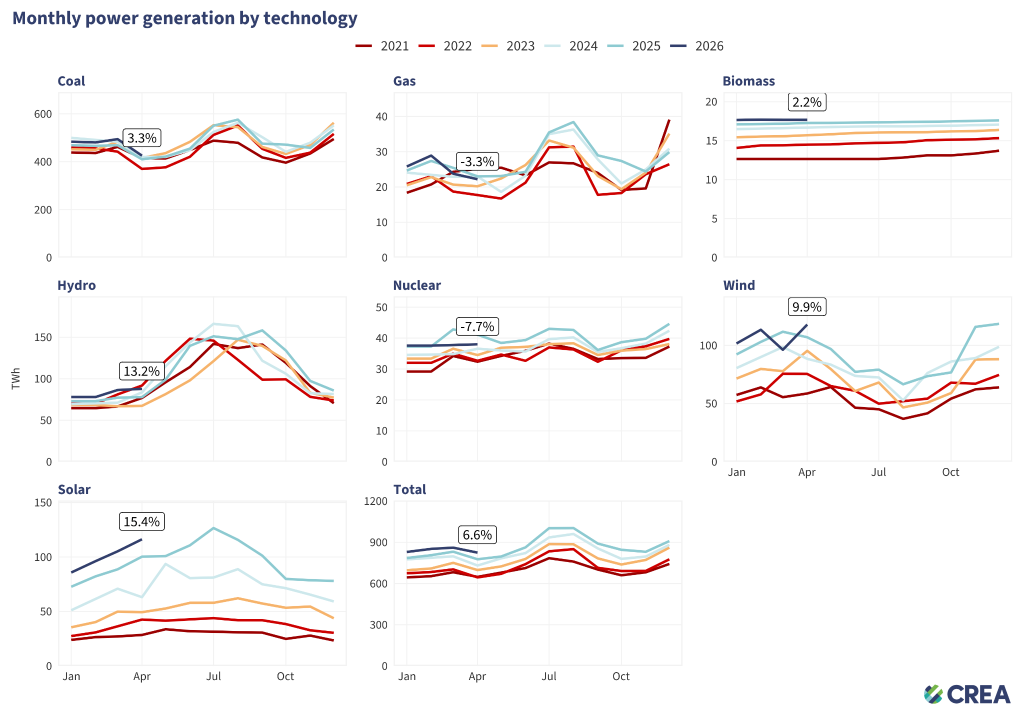
- In April, power generation by large-scale power producers rose 2.6% year-on-year, while total power generation is estimated to have increased by 6.6%.
- Coal power generation rose 3.3% year-on-year in April, marking the fourth consecutive month of increase, as wind, solar and nuclear underperformed. This came after China’s coal power generation fell in 2025 for the first time in a decade.
- Gas power generation dropped by about 3.3% year-on-year in April, reflecting the impact of Strait of Hormuz shipping disruptions on natural gas supplies.
- Solar and wind generation rose by 15.4% and 9.9%, respectively, but growth was held back by exceptionally poor wind conditions in March–April and weaker solar performance.
- Hydropower generation grew 13.2%, while nuclear output dropped 7.7% amid extended refuelling outages.
*Thermal, nuclear, and hydropower generation are based on National Bureau of Statistics (NBS) data. Wind and solar generation are estimated from installed capacity and projected utilisation rates, adjusted for weather and average curtailment over the preceding three months. Coal and gas generation are estimated by splitting total thermal generation using last year’s same-month fuel mix, adjusted by the year-on-year change in the fuel mix over the preceding three months.
Fossil fuel imports declined amid shipment disruptions and price hikes
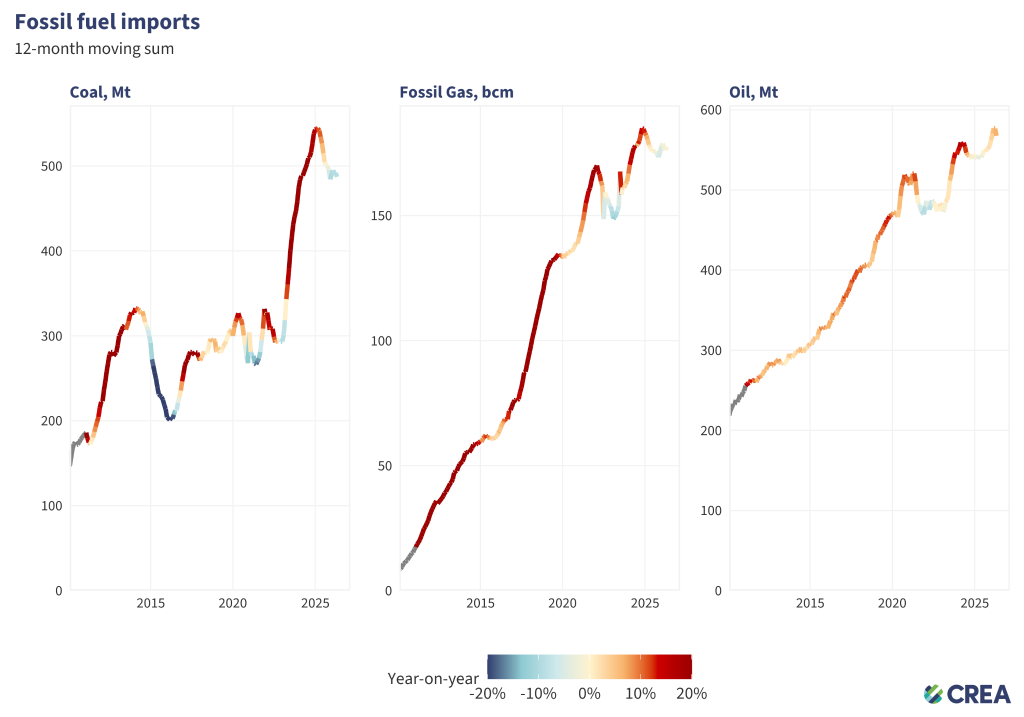
- China’s coal imports fell by more than 12.5% year-on-year in April 2026, reaching their lowest level since June 2025. For the first four months as a whole, import volumes were down 2.1% year-on-year.
- China’s crude oil imports fell by 20% year-on-year in April and were down 23% from March, reaching their lowest level since July 2022 and showing a clear impact from shipment disruptions through the Strait of Hormuz. Despite the sharp monthly drop, crude oil imports in the first four months were still 1.3% higher than a year earlier.
- Natural gas imports also fell, dropping around 12.9% year-on-year, amid the same Gulf shipment disruptions. This brought cumulative imports so far this year to about 6.2% below the same period in 2025.
Coal output dips as oil and gas production rises
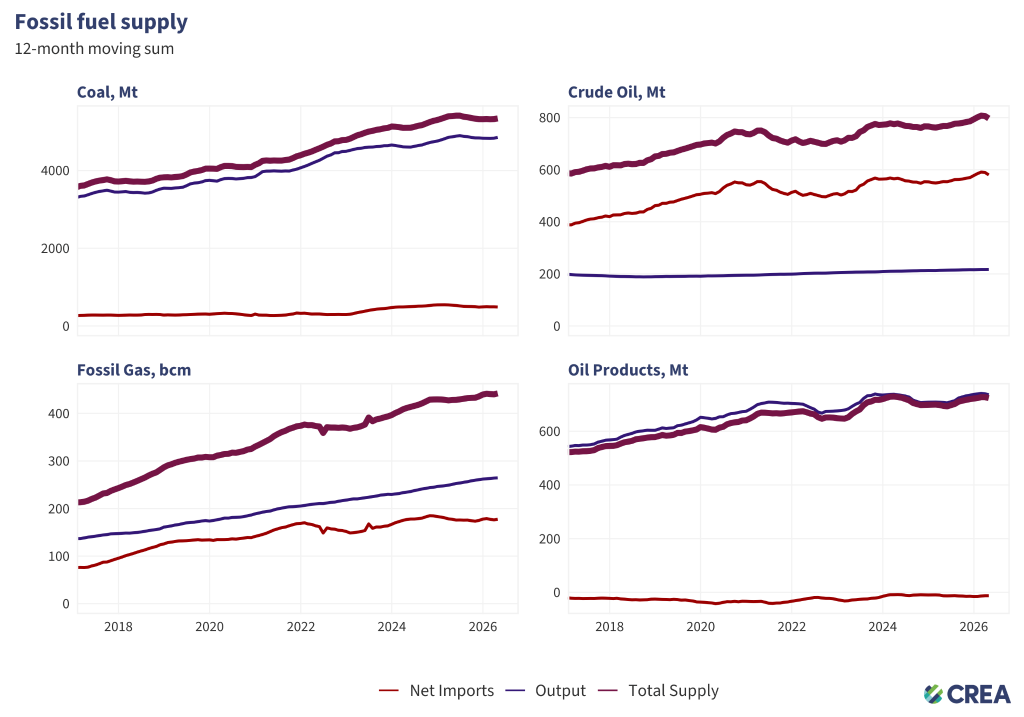
- Coal output fell 1% year-on-year in April 2026, bringing production in the first four months down 0.1% from a year earlier.
- Domestic natural gas production rose by 1.9%, while output in the first four months was also up 2.7% from a year earlier.
- Crude oil production increased by 1.2%. Output in the first four months increased by 1.3%.
- The fall in crude imports fed through to refinery activity in April. Crude throughput dropped 5.8% year-on-year, a decline 3.6 percentage points steeper than in March. Refined oil product exports also fell sharply, plunging around 38% year-on-year to 3.12 million tonnes, the lowest level in nearly a decade.
Industrial value-added growth slows as high-emissions sectors weaken
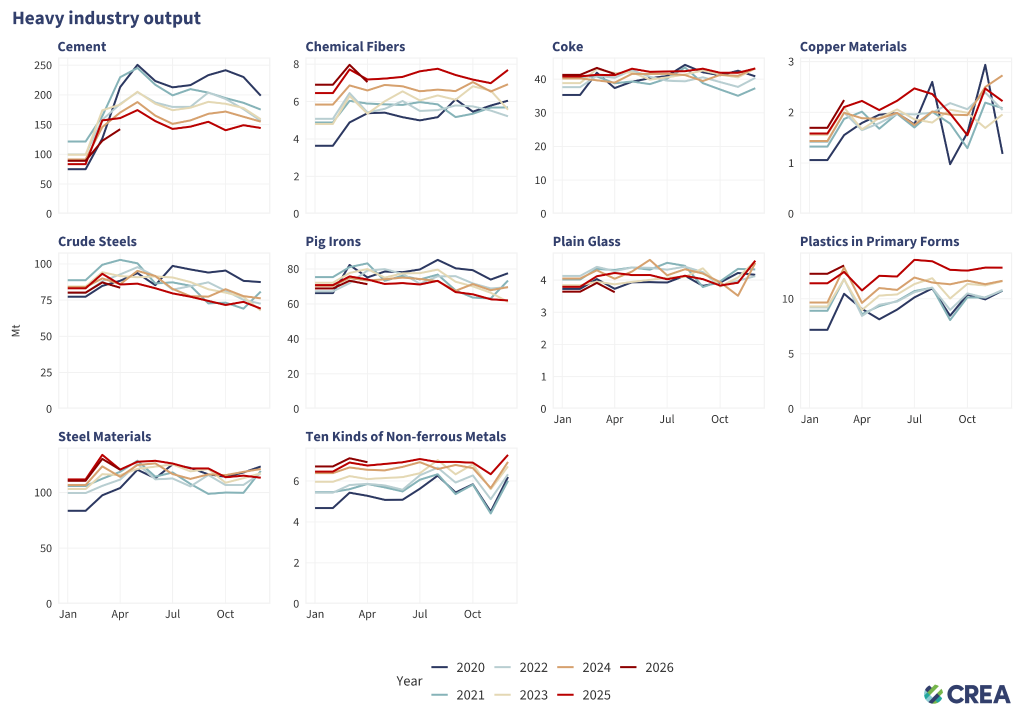
- The steel sector continued to weaken in April, with output of pig iron, crude steel, and steel products falling by 3.6%, 2.8%, and 1.7% year-on-year, respectively.
- Cement output continued to fall 10.8% year-on-year in April, staying at its lowest level for the same period since 2020. First four months output was down 8.6% year-on-year, extending the decline in one of China’s most emissions-intensive industrial sectors.
- Chemical fibre output dropped 3.9% year-on-year, its first decline in 22 months, while non-ferrous metal output remained elevated, up 2.8%.
- Ethylene production, used as a key feedstock for plastics, declined by 4.1%. Sulfuric acid production, an important input for phosphate fertiliser production, dropped by 2.2%.
The steel and cement industries are the largest CO2 emitters in China, when emissions from their electricity use are included. They are also bellwethers of real estate, infrastructure, and other fixed-asset investments that play an outsized role in China’s emissions and economy.
Tangshan blast furnace activity reached multi-year high
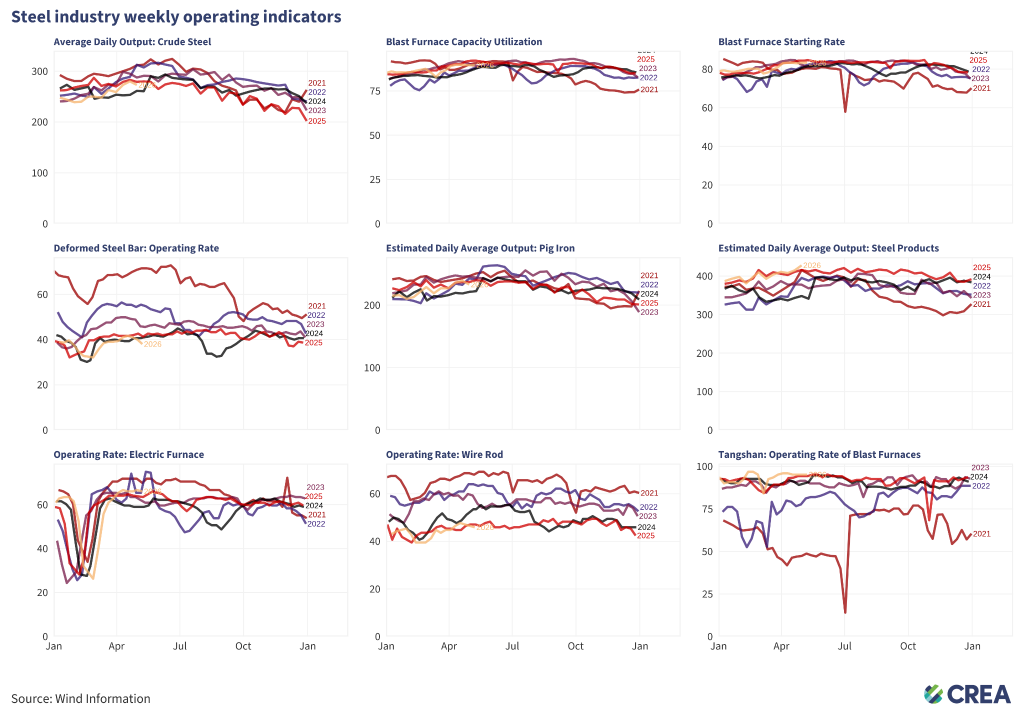
- In the first week of May, blast furnaces for steel production remained active, with the starting rate of 83.2% and utilisation reaching 90% — both slightly down from a year earlier but still among the highest levels seen so far this year. Electric furnace operating rates also rose to 66%, slightly above the same period last year.
- In early May 2026, daily crude steel and pig iron output rose noticeably from the previous ten-day period, partly as some major steelmakers resumed production after equipment maintenance. Steel product output fell.
- The operating rate of blast furnaces in Tangshan, China’s ‘steel capital’ and a significant source of air pollution in Beijing, reached 95% in the first week of May, the highest level of the same period since 2021.
Hebei Province industrial output is a bellwether of national priorities: when air quality and emissions are the priority, it is the most tightly regulated area due to its impact on Beijing’s pollution levels.
Thermal power commissioning surged over 160% in Q1 to a record high
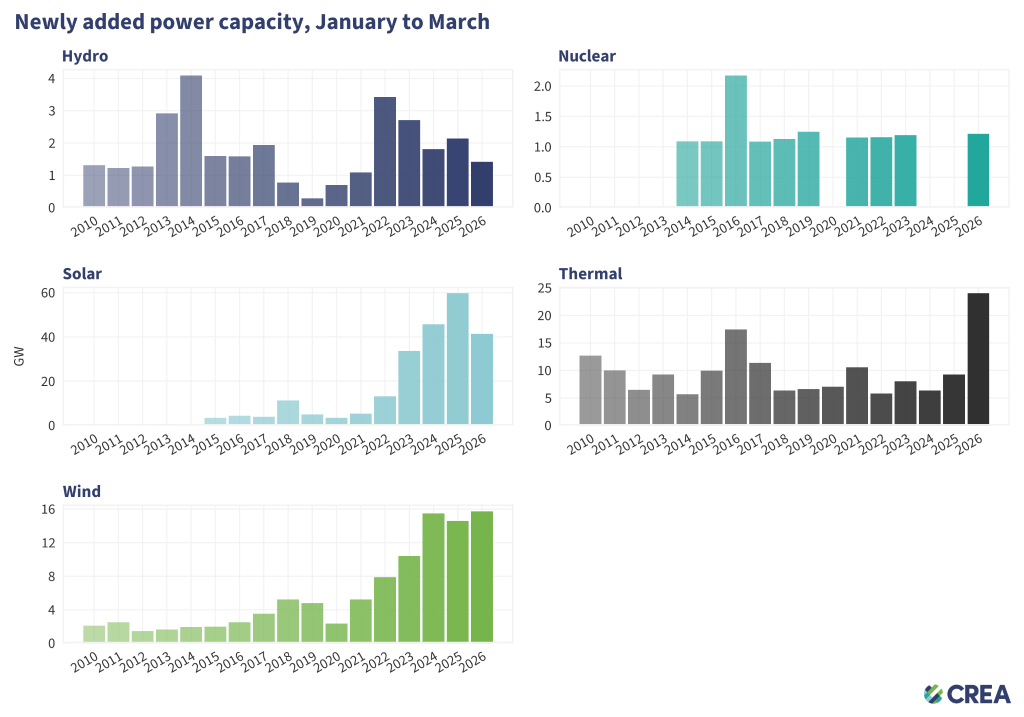
In the first three months of 2026, China added:
- 41.4 gigawatts (GW) of solar power capacity, down 31% from last year;
- 15.8 GW of wind power capacity, up 8% from last year;
- 24 GW of thermal power capacity, up 160% from last year;
- 1.4 GW of hydro power capacity, down 33% from last year;
- 1.2 GW of nuclear power capacity.
In March 2026 alone, China added:
- 8.9 GW of solar power capacity, down 56% from last year;
- 4.8 GW of wind power capacity, down 9% from last year;
- 4 GW of thermal power capacity, down 26% from last year;
- 0.22 GW of hydro power capacity, same as last year;
- 0 GW of nuclear power capacity, same as last year.
Read more:
Clean energy drove more than a third of China’s GDP growth in 2025
Why China is still building new coal–and when it might stop
Built to peak: Coal power expansion runs out of room in China
Large-scale clean energy bases took the lead in wind and solar installations
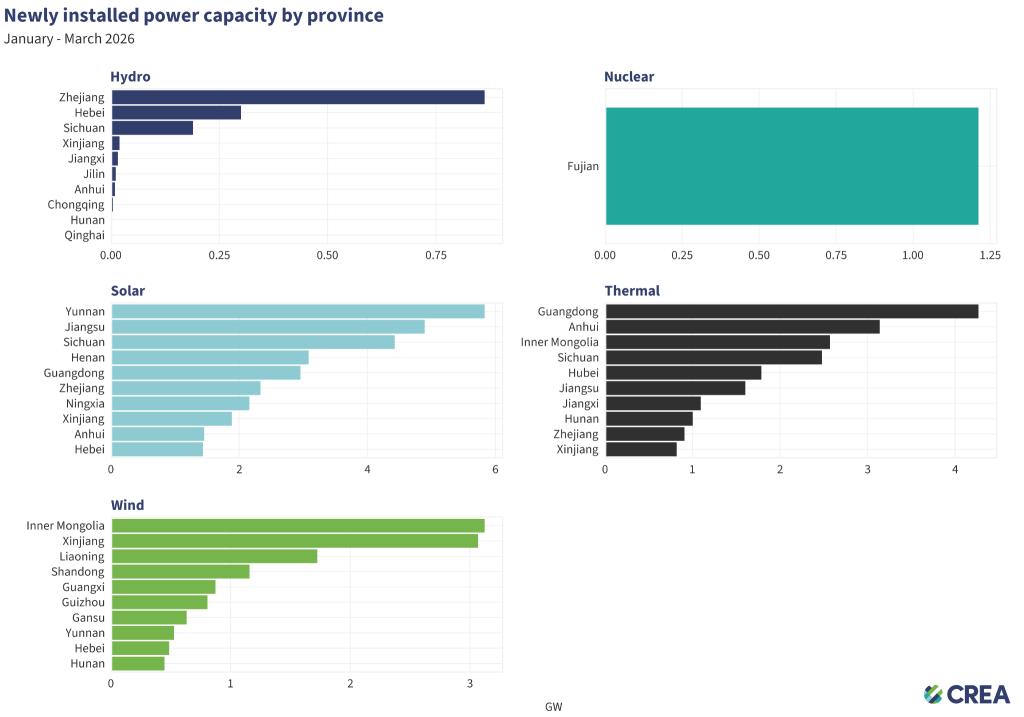
- Solar power installations are led by Yunnan, Jiangsu, and Sichuan. The strong showing of Yunnan and Sichuan is notable, as both are already major hydropower provinces and are set to host new hydro-wind-solar bases under the 15th Five-Year Plan (FYP).
- Inner Mongolia, Xinjiang, and Liaoning lead in wind development. These provinces are also part of the large-scale clean energy bases initiative under the 15th FYP.
- Thermal (coal) power additions accelerated in Guangdong, Anhui, and Inner Mongolia. Guangdong has led the country in new thermal power capacity additions in recent years, and its coal-fired generation continued to rise in 2025. By contrast, coal generation declined in both Anhui and Inner Mongolia despite the increase in new capacity.
Read more: China’s north cleans up its power mix as the south lags
Solar cells weakened further, while batteries continued to boom
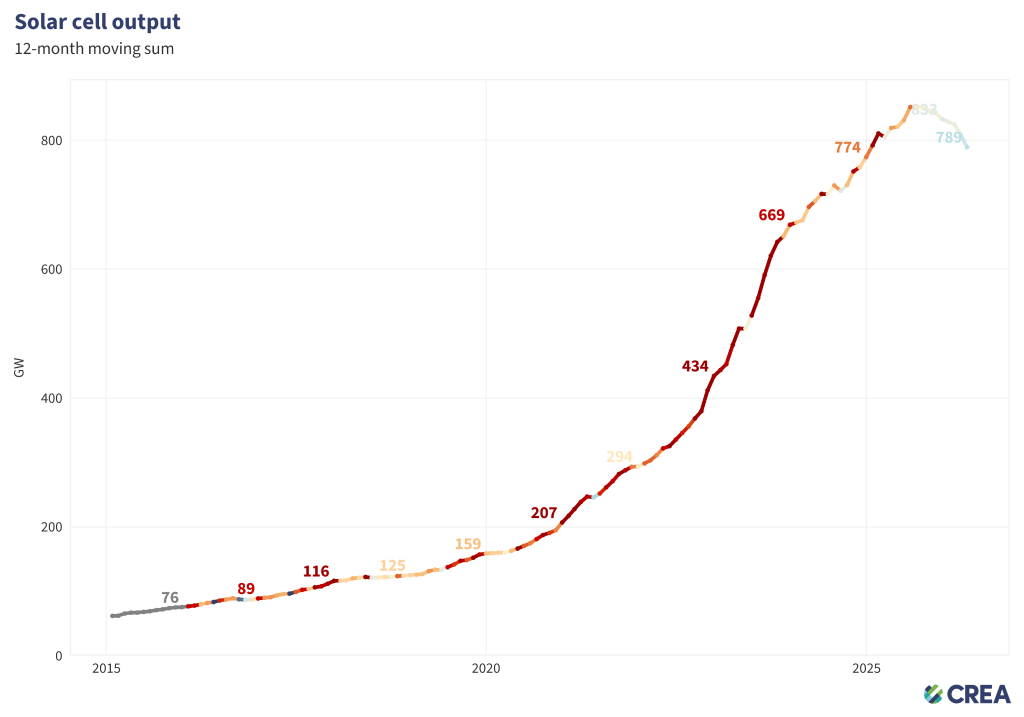
Solar cell production fell by 25.6% year-on-year, reflecting weaker domestic installations and a slight pullback in exports following the March surge. The decline suggests that China’s solar manufacturing sector is adjusting after last year’s exceptionally rapid deployment boom.
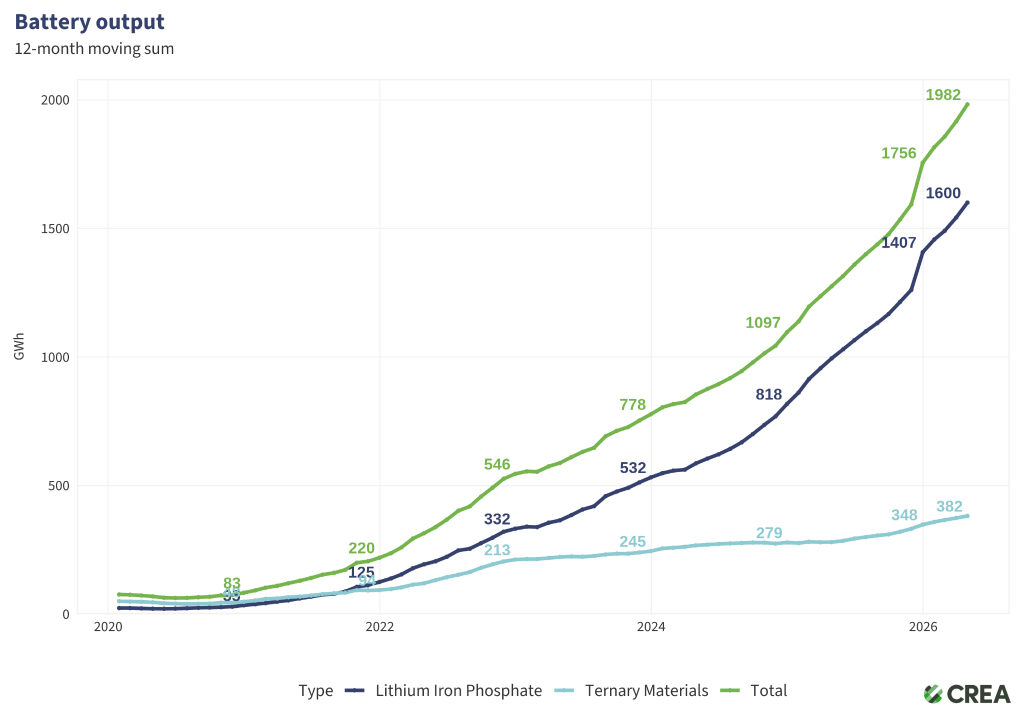
Battery production remained on a strong growth trajectory in April, reaching 184 GWh, a 55.6% increase from a year earlier, driven by robust demand from energy storage and export markets.
NEV production share rises as exports hit April record
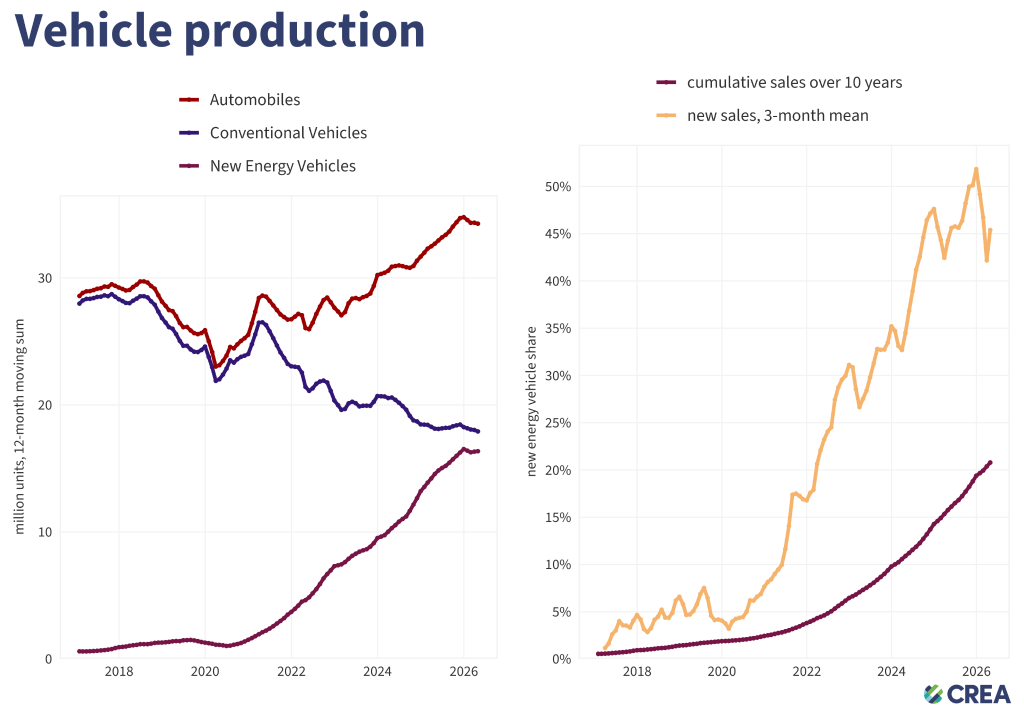
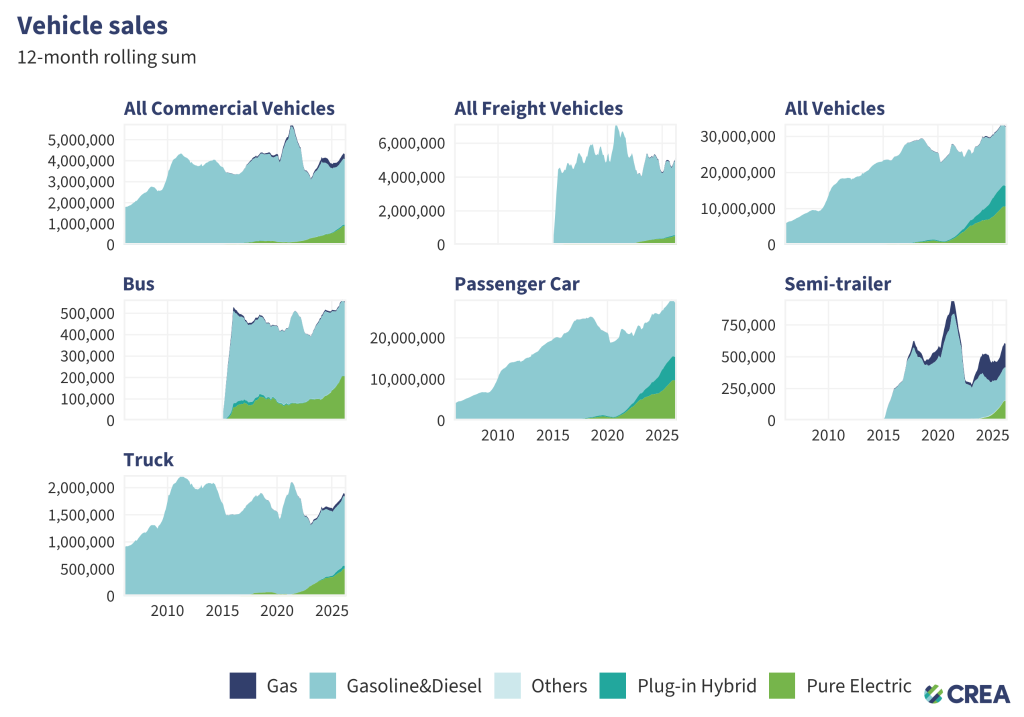
- New Energy Vehicles (NEV) production continued to grow in April, rising 3.8% year-on-year, although the first four months’ output was still down 3.8%. Overall vehicle production declined 2.6% in April, bringing the share of NEVs rising to 51% of all vehicles produced, up from 47% in April last year.
- China’s new energy vehicle exports surged by more than 110% year-on-year in April 2026, setting a new record for the month.
Relevant analysis by CREA:
Reclaiming credibility in China’s steel industry: Climate ambition, financial resilience, and market trust
China’s 15th Five-Year Plan — Implications for climate and energy transition
Analysis: Clean energy drove more than a third of China’s GDP growth in 2025
Analysis: China’s CO2 emissions have now been ‘flat or falling’ for 21 months
Analysis: Coal power drops in China and India for first time in 52 years after clean-energy records
Built to peak: Coal power expansion runs out of room in China
China’s Climate Transition: Outlook 2025