
By Manoj Kumar N and Nandikesh Sivalingam
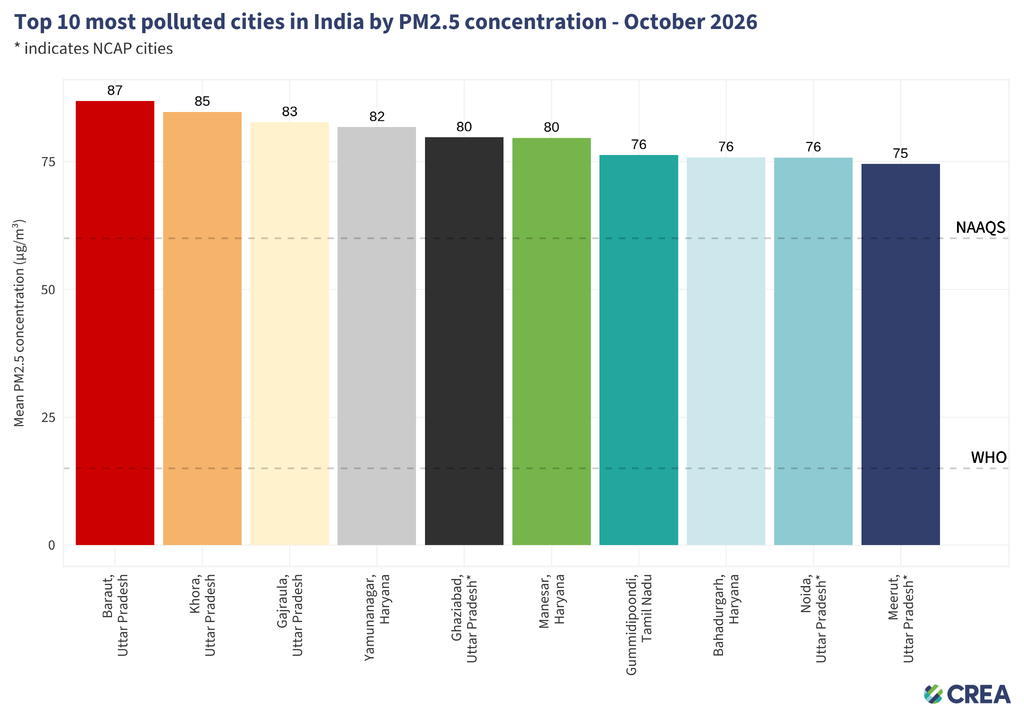
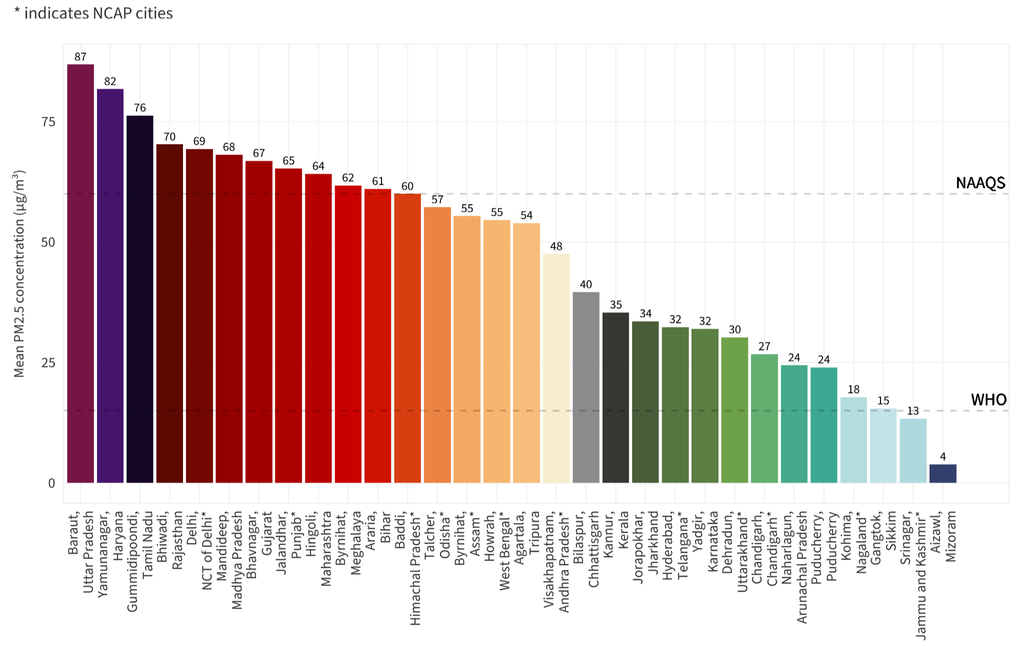
In October 2026, 261 of 267 Indian cities with sufficient CAAQMS data exceeded the WHO daily PM2.5 guideline of 15 µg/m³. Uttar Pradesh state emerged as a major hotspot, accounting for six of the ten most polluted cities, while Baraut recorded the highest monthly average of PM2.5 at 87 µg/m³.
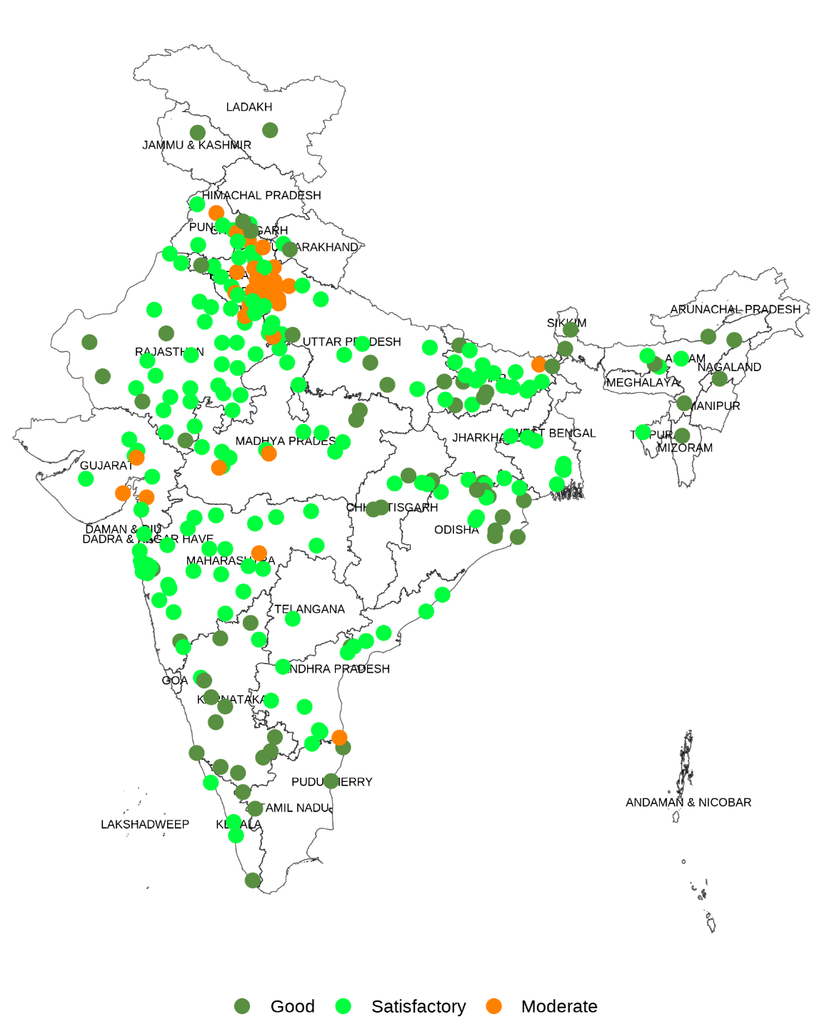
Distribution of Indian cities based on PM2.5 AQI during October 2026
Key highlights
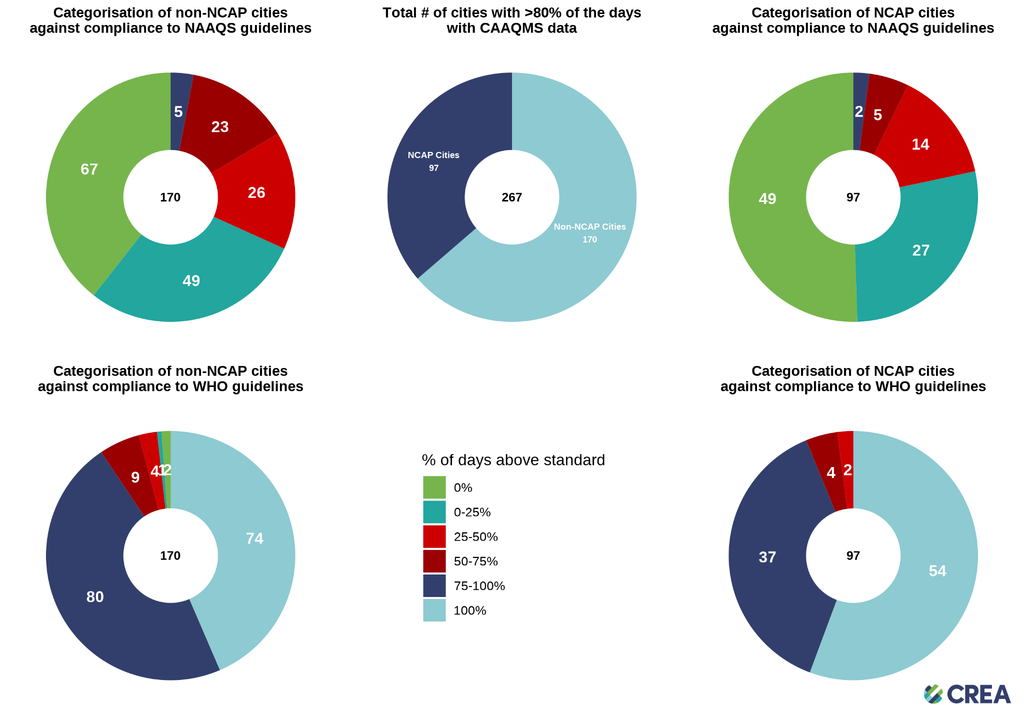
- Compliance: In October 2026, 229 out of 267 cities with 80% and above days with continuous ambient air quality monitoring stations (CAAQMS) available data recorded PM2.5 concentrations below India’s National Ambient Air Quality Standards (NAAQS) of 60 µg/m³. Six cities complied with the World Health Organization’s (WHO) daily safe guideline concentration of 15 µg/m³.
- NCAP cities: The monthly average PM2.5 levels in 90 National Clean Air Programme (NCAP) cities (97 cities with more than 80% of days with data) complied with India’s daily NAAQS for PM2.5, while 95 of 97 NCAP cities exceeded the WHO’s daily guideline.
- Non-NCAP cities: Among the 170 non-NCAP cities with over 80% of days with CAAQMS data, 166 cities reported monthly average PM2.5 levels above the WHO daily guideline. Thirty-one cities exceeded the daily NAAQS.
- Most polluted city: Baraut in Uttar Pradesh ranked as the most polluted city in India in October 2026, recording a monthly average PM2.5 concentration of 87 µg/m³, surpassing the daily NAAQS limit of 60 µg/m³ for 24 days out of 29 days of observation in the month.
- Baraut recorded five days in the ‘Very Poor’ category, five days in ‘Poor’ category, 14 days in ‘Moderate’ category, four days in the ‘Satisfactory’ category, and one day in ‘Good’ category.
- Khora in Uttar Pradesh was the second most polluted city in India during October 2026, with a monthly average PM2.5 of 85 µg/m³.
- In October 2026, Khora recorded two days in the ‘Very Poor’ category, nine days in the ‘Poor’ category, 17 days in the ‘Moderate’ category, and two days in the ‘Satisfactory’ category and one day in the ‘Good’ category.
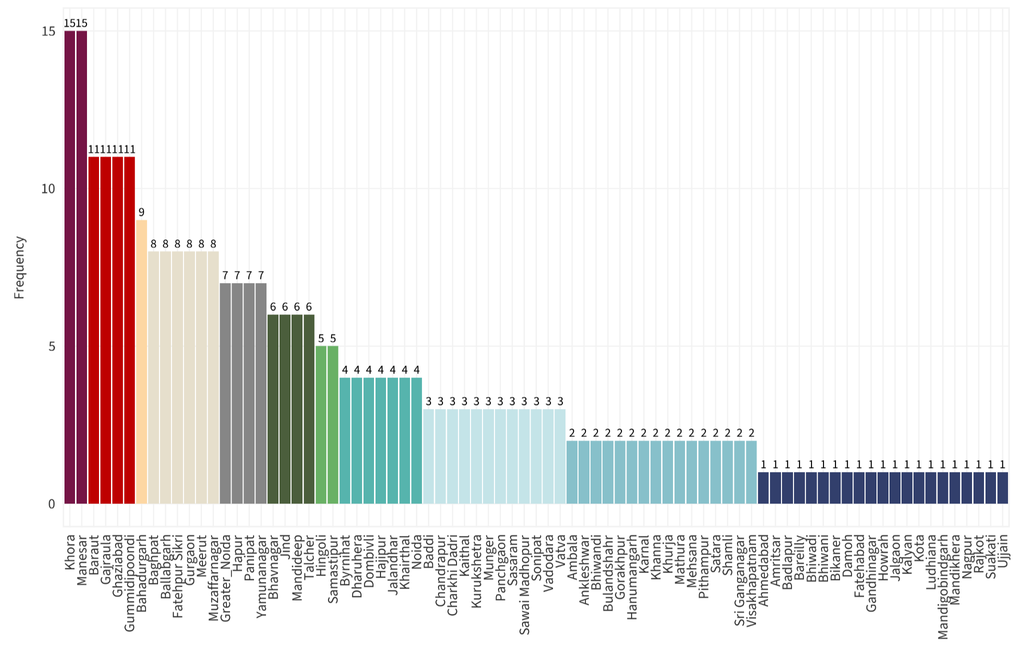
- Gajraula, Yamuna Nagar, Ghaziabad, Manesar, Gummidipoondi, Bahadurgarh, Noida and Meerut were in the top 10 cities, with Gajraula and Meerut in third and tenth places, respectively.
- Uttar Pradesh accounted for six of the ten most polluted cities in October 2026, with three cities in Haryana, followed by one city in Tamil Nadu.
- State with most polluted cities: Among all Indian states, 13 cities in Uttar Pradesh, followed by 11 cities in Haryana, three cities in Gujarat, and two cities each in Madhya Pradesh, Punjab, and Rajasthan exceeded the national ambient air quality standard of 60 µg/m³. One city in each of Bihar, Maharashtra, Meghalaya, Delhi, and Tamil Nadu also surpassed the NAAQS standards during October 2026.
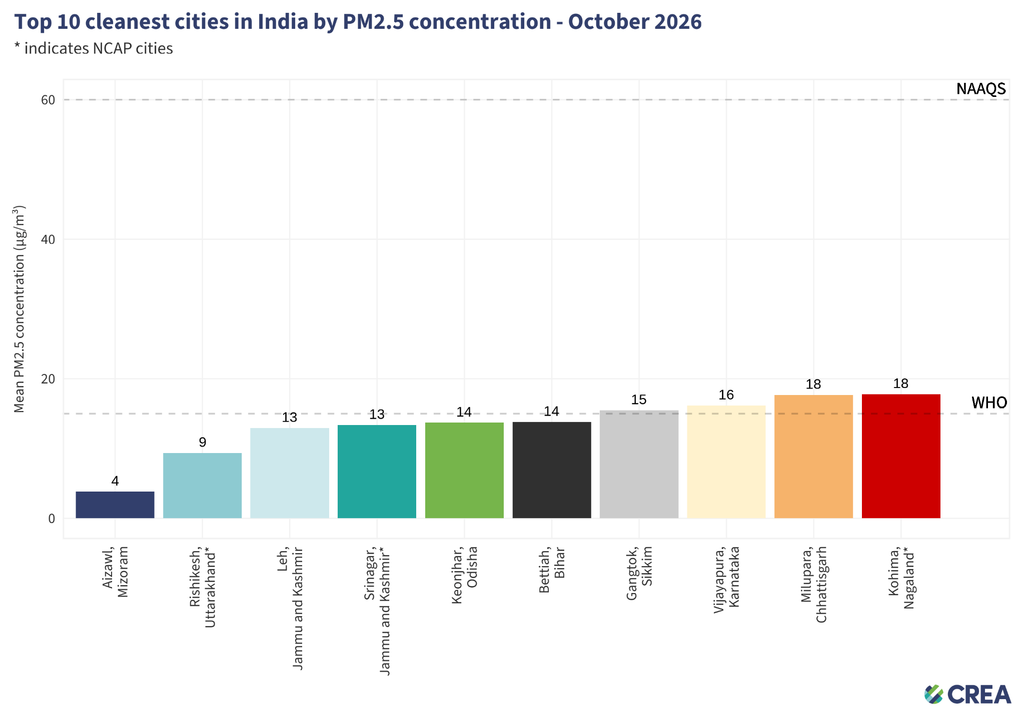
- Cleanest city: Aizawl in Mizoram was recorded as the cleanest city in India during October 2026, with a monthly average PM2.5 of four µg/m³, followed by Rishikesh in Uttarakhand and Leh in Jammu & Kashmir. The top 10 cleanest cities comprise two cities each in Jammu & Kashmir, followed by one each in Bihar, Chhattisgarh, Karnataka, Mizoram, Nagaland, Odisha, Sikkim, and Uttarakhand.
PM2.5 source contributions: Evidence across multiple scales
With the extended implementation period of the NCAP now concluded, its next phase presents an opportunity to reassess India’s approach to air pollution control. Given that around 67% of NCAP funds are used for road dust mitigation, we reviewed three recent studies affiliated with IIT Delhi and IIT Bombay covering city, state, and regional airshed-level source contributions to PM2.5, providing complementary evidence on the major contributing sectors and priorities for future pollution-control planning.
- National and state-level sources: A 2026 IIT Delhi study found that industry was the largest domestic contributor to population-weighted PM2.5 concentrations in India (18%), followed by residential sources (15%) and power generation (13%). The state-level assessment also found that these sectors were among the dominant contributors to PM2.5 across most Indian states.
- City-level sources: An assessment of 143 Indian cities by IIT Bombay found that emissions originating outside city boundaries accounted for an estimated 82 to 89% of urban PM2.5 concentrations, with domestic biomass burning contributing the largest share (32%), followed by energy generation (16%) and industry (15%).
- Regional airshed-level sources: A study of India’s regional airsheds by IIT Delhi found that secondary PM2.5 accounted for 62% of annual ambient PM2.5, compared with 38% from primary PM2.5. Local sources within India accounted for approximately 81% of secondary PM2.5. Residential sources contributed the largest share of annual population-weighted secondary PM2.5 exposure (22%), followed by industry (14%), transport (11%) and power generation (11%).
- Policy implications: Collectively, the three studies highlight the need for NCAP’s next phase to move beyond its emphasis on road dust towards a multi-sectoral, airshed-based approach. NCAP should prioritise emissions from industry, power generation, and residential sources. Additionally, it should control directly emitted particulate matter, address gaseous precursors such as sulfur dioxide (SO2), nitrogen dioxide (NO2) and volatile organic compounds (VOCs) responsible for secondary PM₂.₅ formation, and strengthen coordination across cities and states to tackle pollution transported beyond administrative boundaries.
Number of cities vs. frequency of days with PM2.5 concentration above NAAQS and WHO guidelines – October 2026
Top 10 most polluted cities in India by PM2.5 concentration – October 2026
| Days in respective AQI categories based on PM2.5 (µg/m3) – October 2026 | ||||||
|---|---|---|---|---|---|---|
| City | Good (0-30) | Satisfactory (31-60) | Moderate (61-90) | Poor (91-120) | Very poor (121-250) | Severe (>250) |
Baraut | 1 | 4 | 14 | 5 | 5 | 0 |
Khora | 1 | 2 | 17 | 9 | 2 | 0 |
Gajraula | 1 | 6 | 13 | 9 | 2 | 0 |
Yamunanagar | 0 | 6 | 12 | 8 | 1 | 0 |
Ghaziabad | 0 | 7 | 9 | 14 | 1 | 0 |
Manesar | 3 | 7 | 9 | 9 | 3 | 0 |
Gummidipoondi | 0 | 9 | 14 | 7 | 1 | 0 |
Bahadurgarh | 1 | 6 | 16 | 6 | 2 | 0 |
Noida | 0 | 6 | 18 | 5 | 2 | 0 |
Meerut | 1 | 7 | 18 | 2 | 3 | 0 |
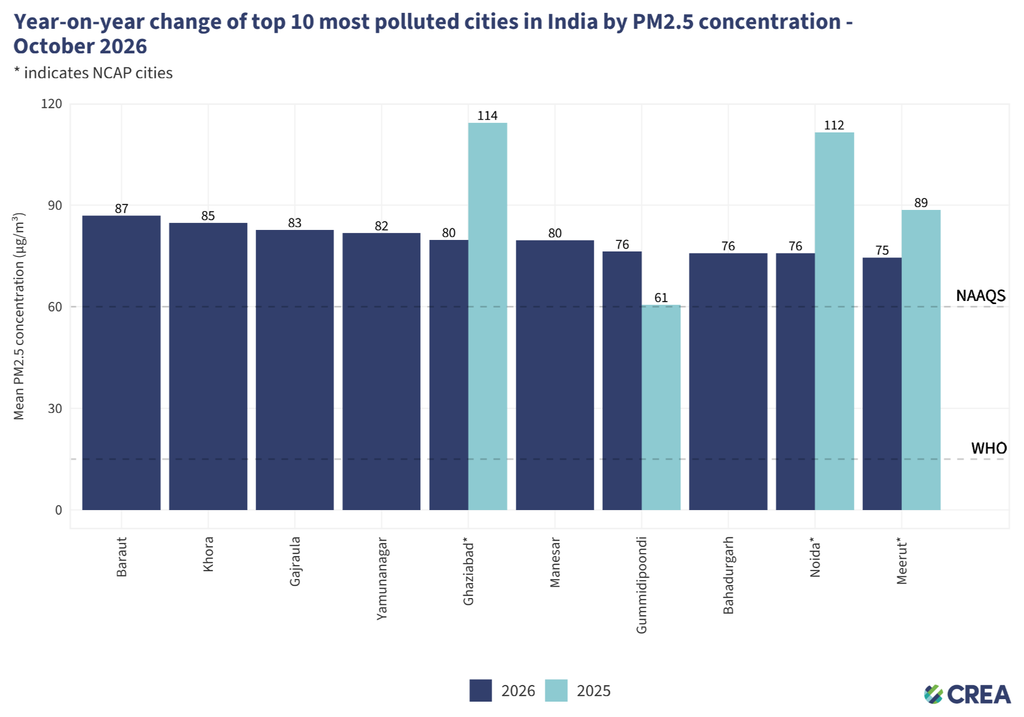
Status of PM2.5 concentration in October 2025 for top 10 most polluted cities in October 2026 across India
| Days in respective AQI categories based on PM2.5 (µg/m3) – October 2025 | ||||||
|---|---|---|---|---|---|---|
| City | Good (0-30) | Satisfactory (31-60) | Moderate (61-90) | Poor (91-120) | Very poor (121-250) | Severe (>250) |
Ghaziabad | 1 | 6 | 4 | 6 | 14 | 0 |
Gummidipoondi | 1 | 15 | 15 | 0 | 0 | 0 |
Noida | 1 | 5 | 6 | 4 | 15 | 0 |
Meerut | 3 | 7 | 6 | 5 | 10 | 0 |
Distribution of cities by PM2.5 air quality index (AQI) based on monthly average PM2.5 concentrations – October 2026
| State/UT | Number of cities in AQI category (PM2.5 μg/m3) | ||||
| Good (0-30) | Satisfactory (31-60) | Moderate (61-90) | Poor (91-120) | Very Poor (121-250) | |
| Andhra Pradesh | 1 | 12 | 0 | 0 | 0 |
| Arunachal Pradesh | 1 | 0 | 0 | 0 | 0 |
| Assam | 3 | 3 | 0 | 0 | 0 |
| Bihar | 7 | 15 | 1 | 0 | 0 |
| Chandigarh | 1 | 0 | 0 | 0 | 0 |
| Chhattisgarh | 5 | 3 | 0 | 0 | 0 |
| Gujarat | 0 | 7 | 3 | 0 | 0 |
| Haryana | 2 | 12 | 11 | 0 | 0 |
| Himachal Pradesh | 0 | 1 | 0 | 0 | 0 |
| Jammu and Kashmir | 2 | 0 | 0 | 0 | 0 |
| Jharkhand | 0 | 1 | 0 | 0 | 0 |
| Karnataka | 13 | 2 | 0 | 0 | 0 |
| Kerala | 1 | 3 | 0 | 0 | 0 |
| Madhya Pradesh | 2 | 10 | 2 | 0 | 0 |
| Maharashtra | 2 | 33 | 1 | 0 | 0 |
| Meghalaya | 0 | 0 | 1 | 0 | 0 |
| Mizoram | 1 | 0 | 0 | 0 | 0 |
| NCT of Delhi | 0 | 0 | 1 | 0 | 0 |
| Nagaland | 1 | 0 | 0 | 0 | 0 |
| Odisha | 9 | 8 | 0 | 0 | 0 |
| Puducherry | 1 | 0 | 0 | 0 | 0 |
| Punjab | 1 | 5 | 2 | 0 | 0 |
| Rajasthan | 5 | 28 | 2 | 0 | 0 |
| Sikkim | 1 | 0 | 0 | 0 | 0 |
| Tamil Nadu | 2 | 0 | 1 | 0 | 0 |
| Telangana | 0 | 1 | 0 | 0 | 0 |
| Tripura | 0 | 1 | 0 | 0 | 0 |
| Uttar Pradesh | 3 | 11 | 13 | 0 | 0 |
| Uttarakhand | 1 | 1 | 0 | 0 | 0 |
| West Bengal | 1 | 6 | 0 | 0 | 0 |
Distribution of cities by PM2.5 air quality index (AQI) based on monthly average PM2.5 concentrations – October 2026
Top 10 cleanest cities in India by PM2.5 concentration – October 2026
| Days in respective AQI categories based on PM2.5 (µg/m3) – October 2026 | ||||||
|---|---|---|---|---|---|---|
| City | Good (0-30) | Satisfactory (31-60) | Moderate (61-90) | Poor (91-120) | Very poor (121-250) | Severe (>250) |
Aizawl | 29 | 0 | 0 | 0 | 0 | 0 |
Rishikesh | 25 | 6 | 0 | 0 | 0 | 0 |
Leh | 27 | 0 | 0 | 0 | 0 | 0 |
Srinagar | 31 | 0 | 0 | 0 | 0 | 0 |
Keonjhar | 31 | 0 | 0 | 0 | 0 | 0 |
Bettiah | 31 | 0 | 0 | 0 | 0 | 0 |
Gangtok | 31 | 0 | 0 | 0 | 0 | 0 |
Vijayapura | 27 | 0 | 0 | 0 | 0 | 0 |
Milupara | 31 | 0 | 0 | 0 | 0 | 0 |
Kohima | 31 | 0 | 0 | 0 | 0 | 0 |
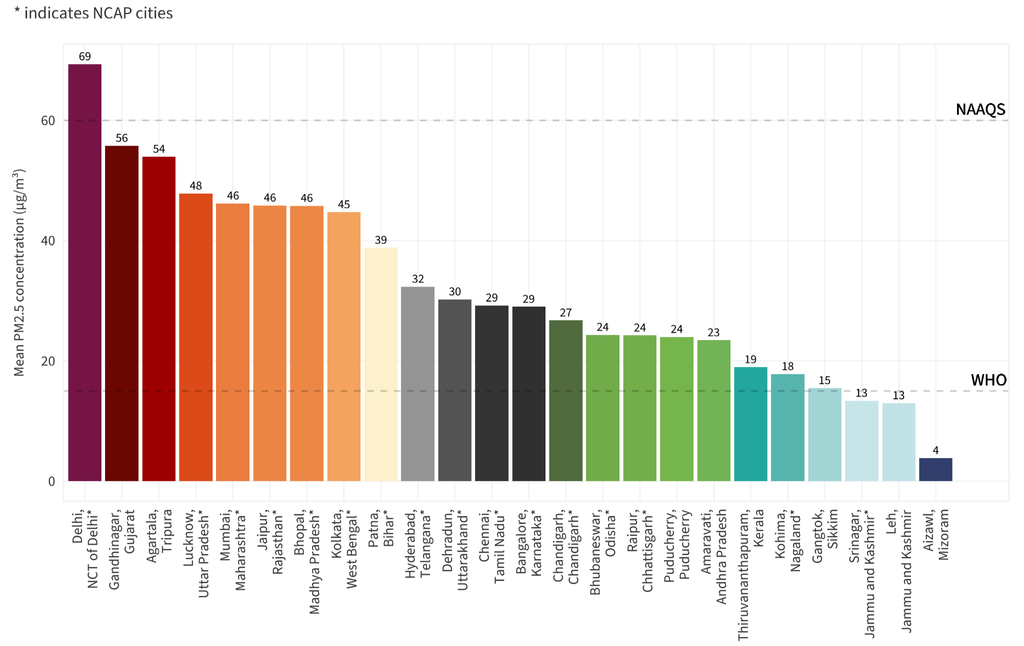
PM2.5 concentrations across state capital cities in India – October 2026
Frequency of appearance of respective cities in top 10 most polluted cities in India by PM2.5 concentration – October 2026
State-wise most polluted cities (PM2.5, µg/m3) in India – October 2026
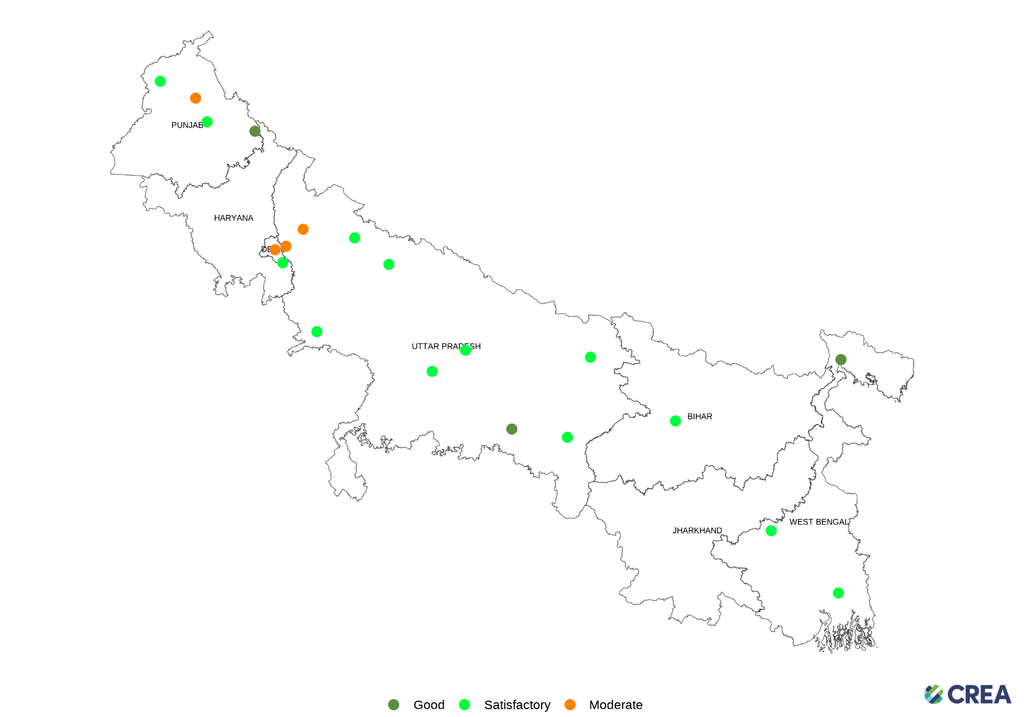
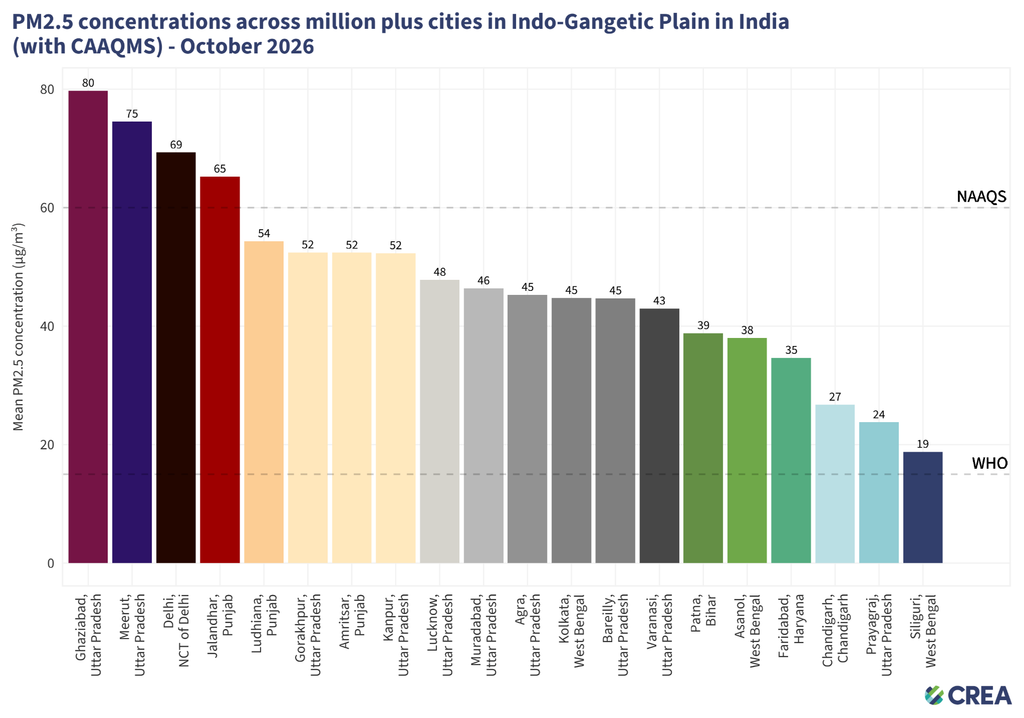
PM2.5 concentrations across million-plus cities with CAAQMS in Indo-Gangetic Plain in India – October 2026
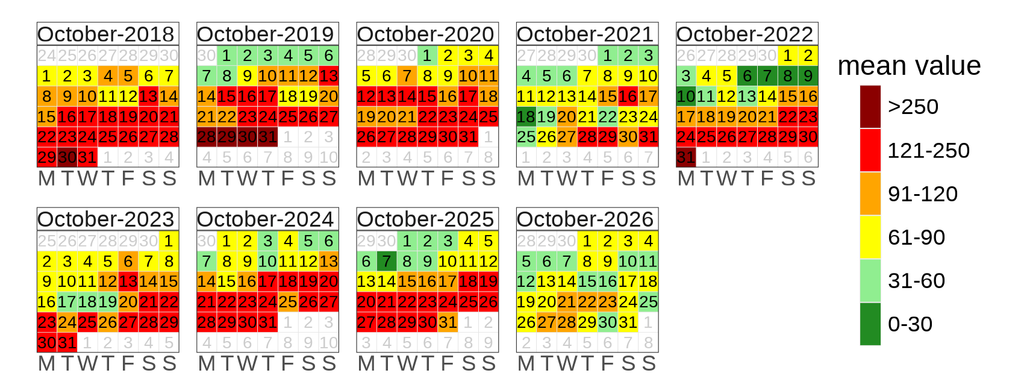
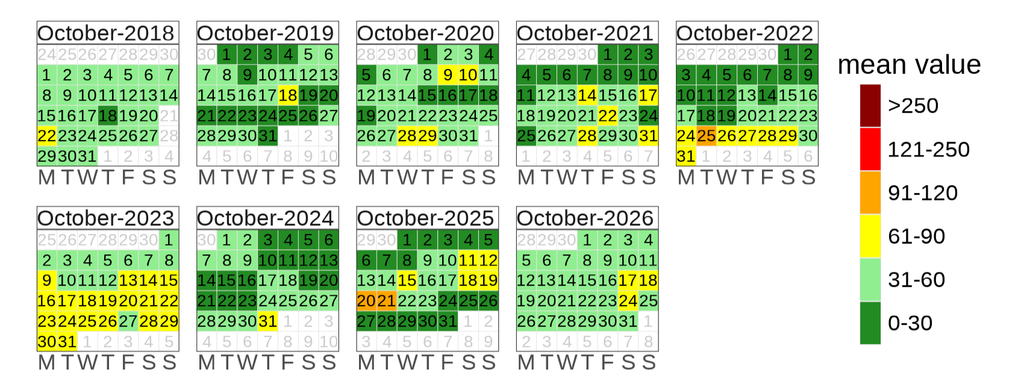
Ambient air quality status in Delhi – October 2026 (PM2.5 concentration, µg/m3)
Ambient air quality status in Mumbai – October 2026 (PM2.5 concentration, µg/m3)
Ambient air quality status in Chennai – October 2026 (PM2.5 concentration, µg/m3)
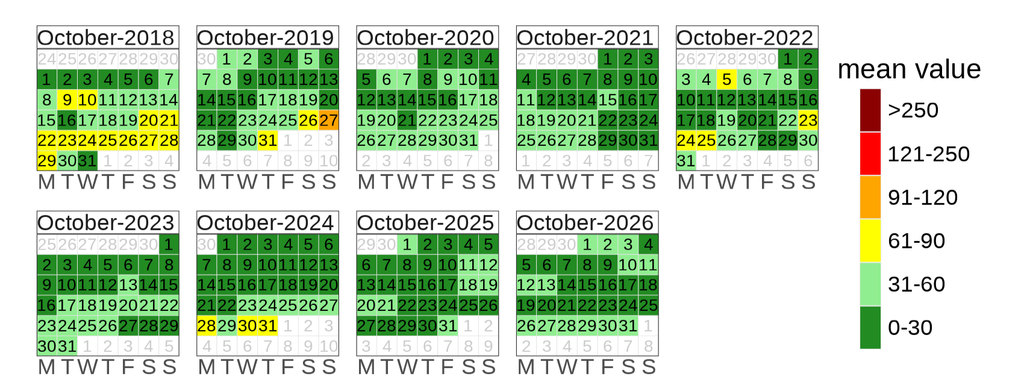
Ambient air quality status in Bangalore – October 2026 (PM2.5 concentration, µg/m3)
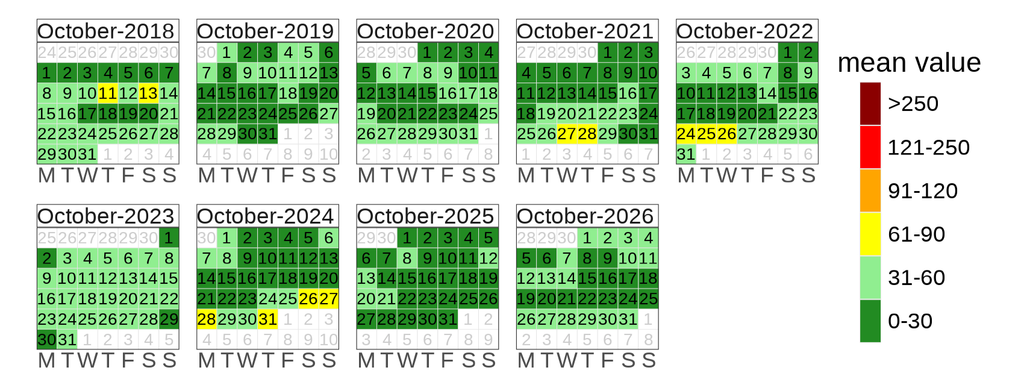
Ambient air quality status in Kolkata – October 2026 (PM2.5 concentration, µg/m3)
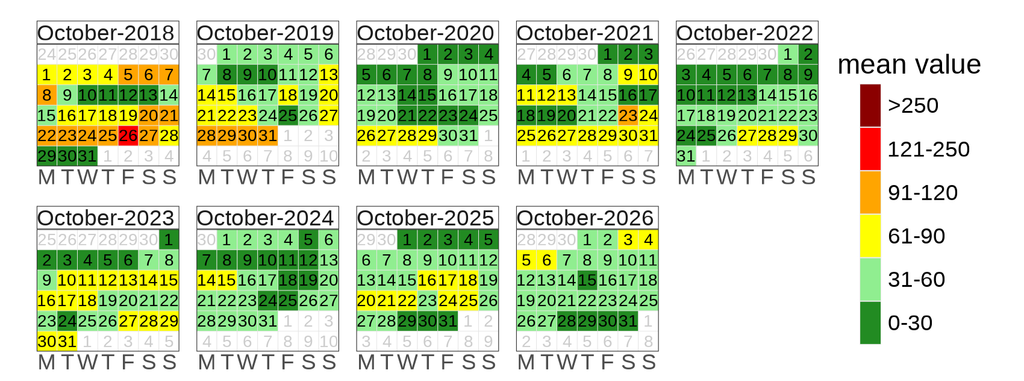
PM2.5 source contributions across multiple scales in India
With the extended implementation period of the National Clean Air Programme (NCAP) now concluded, the next phase offers an opportunity to revisit India’s approach to air-pollution control. Around 67% of NCAP funds have been utilised for road dust. To examine how this emphasis aligns with broader scientific evidence on PM2.5 sources, we reviewed three recent studies affiliated with IIT Delhi and IIT Bombay that cover source contributions at the city, state, and regional airshed levels. Although they differ in methodology and spatial coverage, these studies provide complementary evidence on the major sources of PM2.5 pollution and the sectors that warrant greater attention in pollution-control planning.
State-wise sector contributions to PM2.5 pollution
A study titled Surface PM2.5 air pollution in 2022 India: emission updates, WRF-Chem model evaluation, and source attribution, published in 2026 in Atmospheric Chemistry and Physics, by researchers affiliated with Princeton University and IIT Delhi, assessed PM2.5 concentrations and their sources across India using the WRF-Chem atmospheric chemistry model.
At the national level, industry was the largest domestic contributor to population-weighted PM2.5 concentrations, accounting for 18%, followed by residential sources (15%) and power generation (13%). Transport, agriculture, and open burning each contributed approximately 8%, while dust accounted for 4%. Emissions transported from outside India accounted for an estimated 27%.
The state-level assessment shows that the combined Industry + Power sector is the largest contributor to PM2.5 in most states, with particularly high contributions across southern, western, central, and eastern India. Domestic sources, agricultural burning, fire-related emissions, and dust dominate in only a few states.
Industry and power generation are grouped together to capture their combined contribution from industrial and energy-related activities. Both sectors emit particulate matter directly and gaseous precursors that contribute to secondary PM2.5 formation. This combined assessment highlights their overall contribution without implying that their individual contributions are identical.
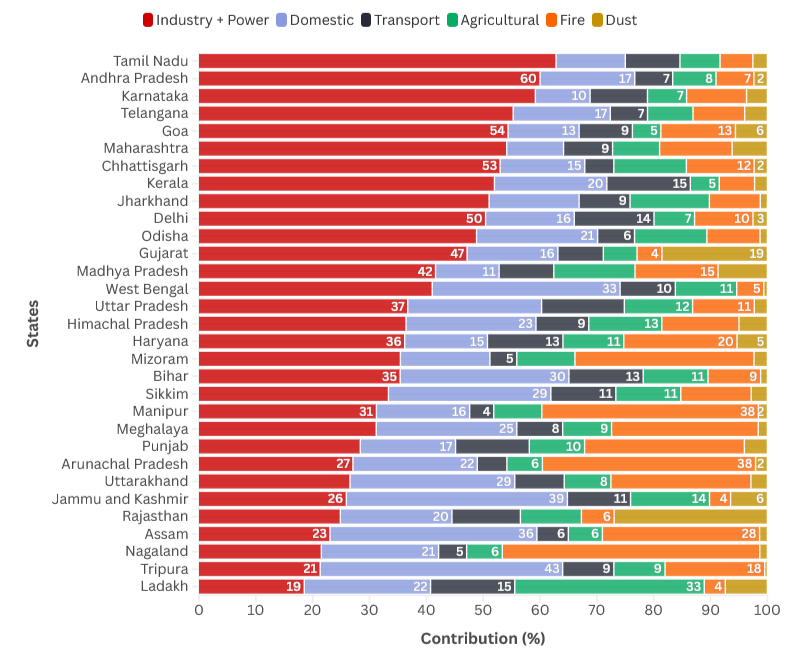
Figure — state-wise sectoral contribution to PM2.5
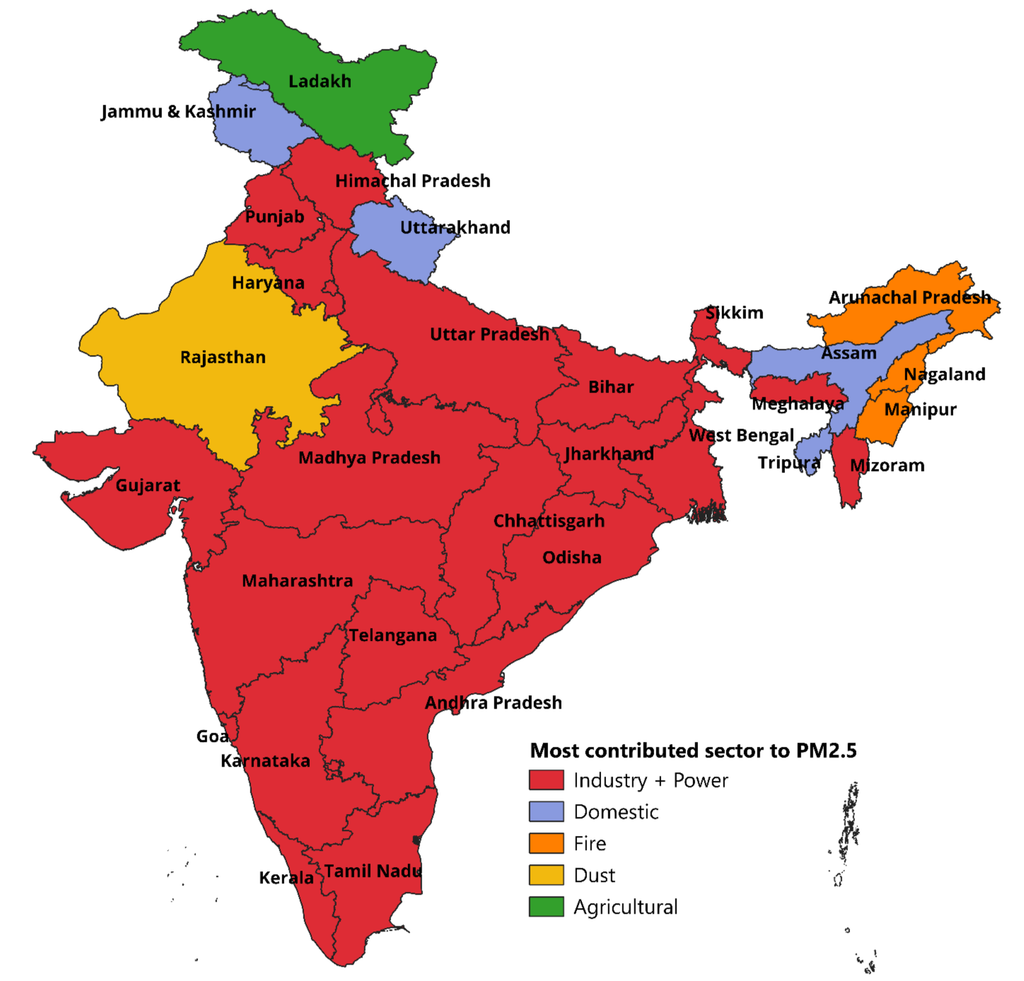
Figure — Dominant contributing source category for PM2.5 across Indian states
City-wise sector contributions to PM2.5 pollution
A 2025 study titled Transboundary emission contribution to PM2.5 concentrations in Indian cities, published in Environmental Research Letters by researchers from IIT Bombay and collaborating institutions, examined PM2.5 sources across 143 Indian cities, including the contribution of emissions originating outside city boundaries.
The city-wise sectoral assessment shows considerable variation in the sources contributing to total PM2.5 concentrations. Industry and power generation, considered together, account for the largest share in many cities, particularly across eastern, central, western and southern India. Domestic sources also matter in several cities, while contributions from transport, agricultural activities, waste burning, and dust vary by location.
The study further estimated that emissions originating outside city boundaries accounted for an average of 82% to 89% of urban PM2.5 concentrations. Among these outside-city sources, domestic biomass burning was the largest contributor (32%), followed by energy generation (16%) and industry (15%).
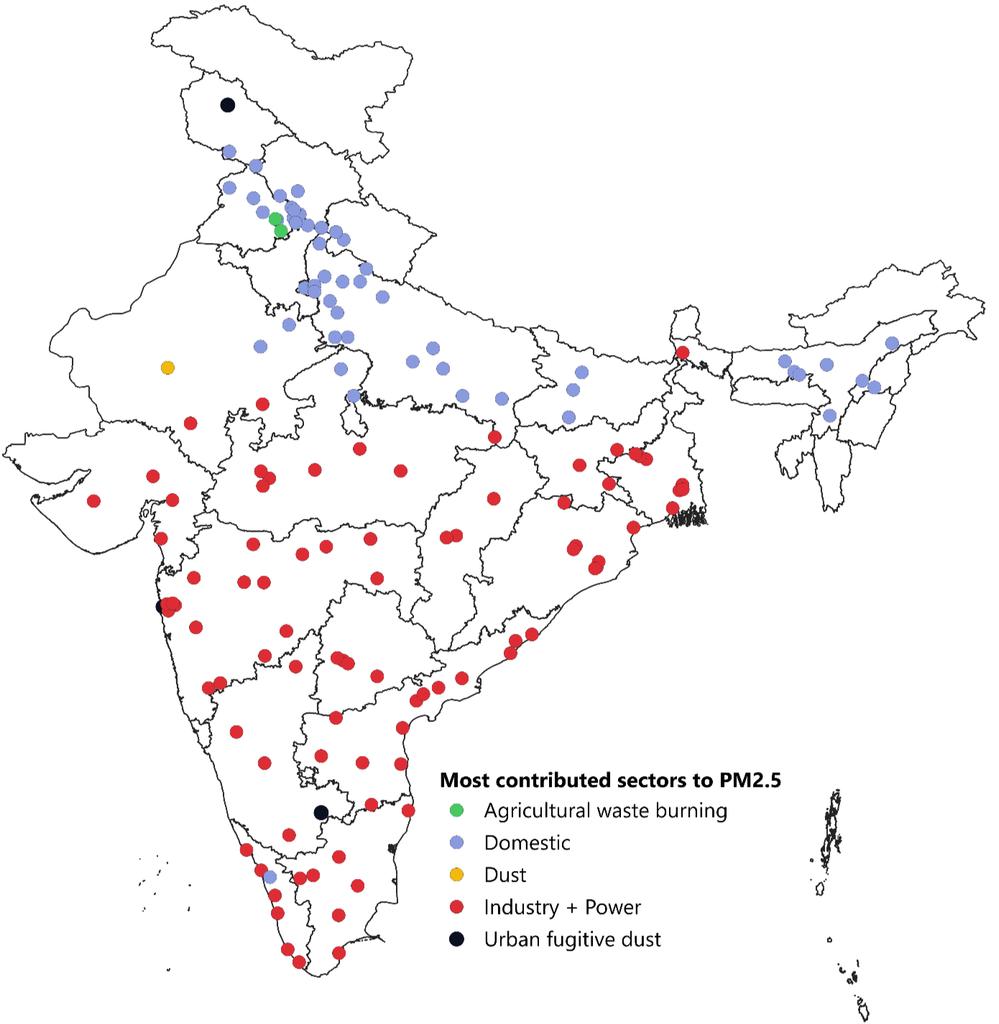
Figure — Dominant contributing sectors to PM2.5 across 143 Indian cities
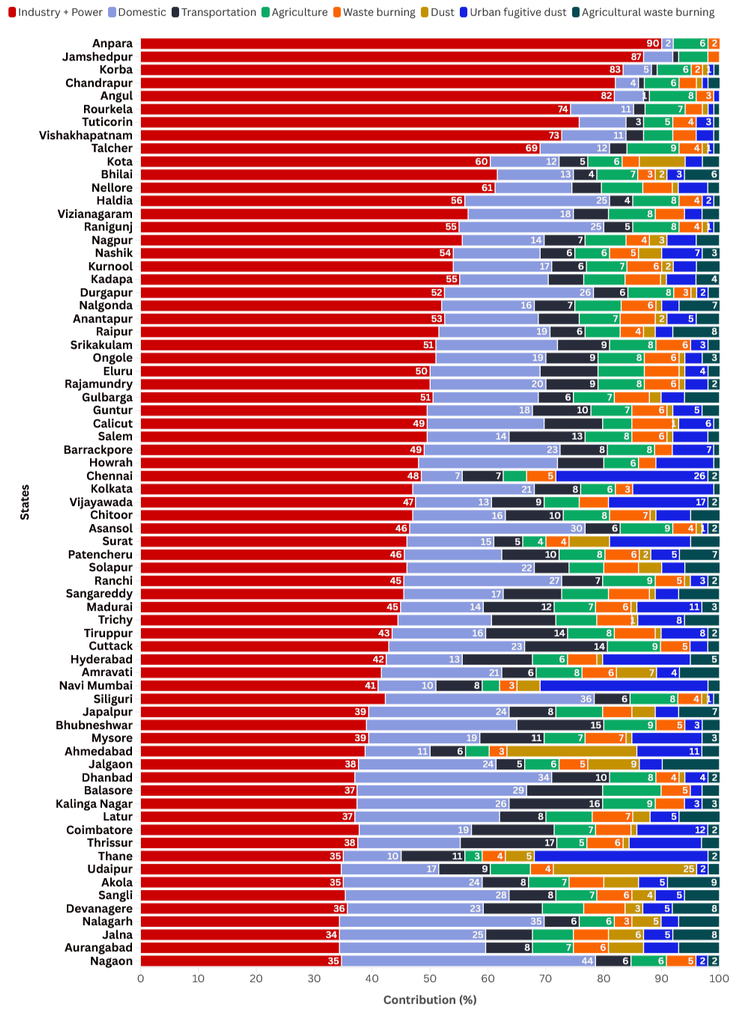
Figure — City-wise sectoral contributions to PM2.5 across Indian cities (1–72 of 143)
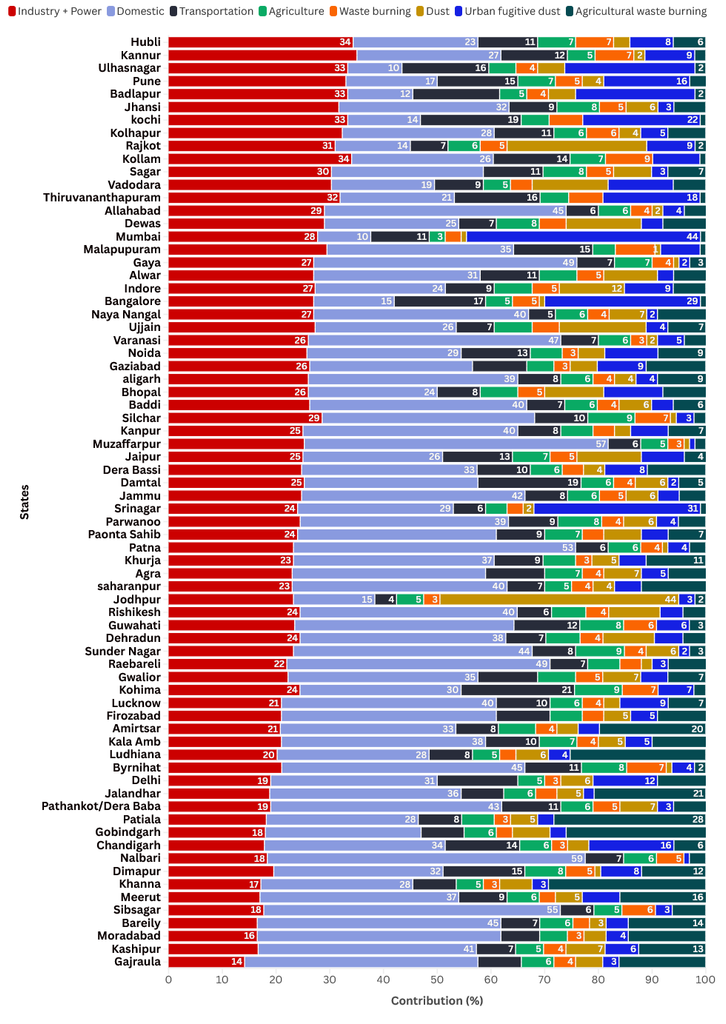
Figure — City-wise sectoral contributions to PM2.5 across Indian cities (73–143 of 143)
Airshed-wise sectoral contributions to PM2.5 pollution
A study titled “Sectoral contributions to primary and secondary PM2.5 in regional airsheds of India“, published in ACS Earth and Space Chemistry, examined the sectoral contributions to primary and secondary PM2.5 across India’s regional airsheds. The study, involving researchers from the Indian Institute of Technology (IIT) Delhi and other institutions, identified 9–11 regional airsheds across India.
The study found that secondary PM2.5 accounted for 62% of annual ambient PM2.5, compared with 38% from primary PM2.5. On an annual basis, local sources within India accounted for approximately 81% of secondary PM2.5. Residential sources contributed the largest share of all-India annual population-weighted exposure to secondary PM2.5 (22%), followed by industry (14%), power generation (11%), and transport (11%). The residential sector contributed significantly to secondary organic aerosols, while power generation, industry, and transport contributed substantially to secondary inorganic particulate formation due to their higher NO2 and SO2 emissions. These findings highlight the importance of controlling gaseous precursors, including sulphur dioxide (SO2), nitrogen oxides (NOX) and volatile organic compounds (VOCs), alongside directly emitted particulate matter.
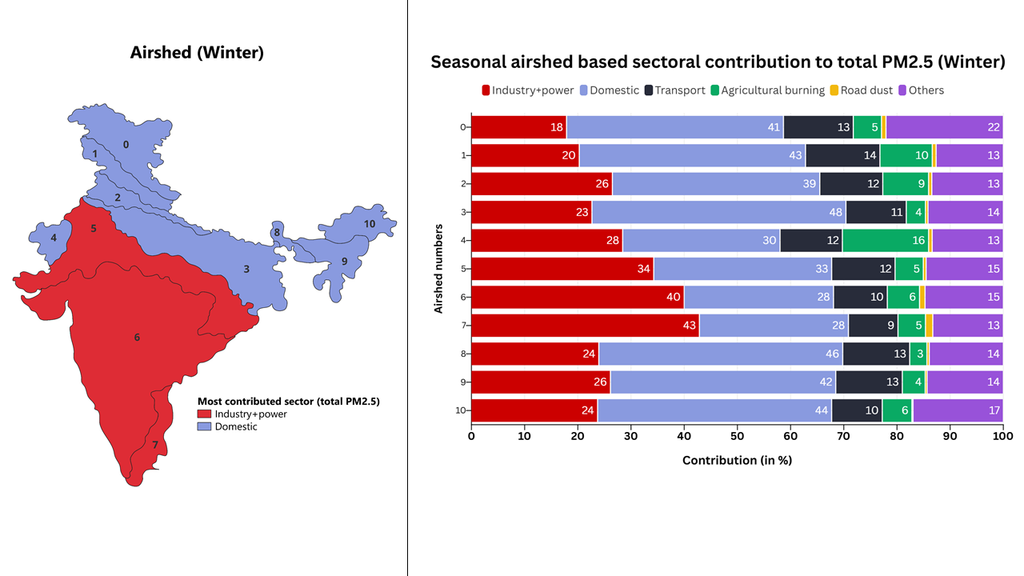
Figure — Winter season airsheds: dominant PM2.5 sources and sectoral contributions
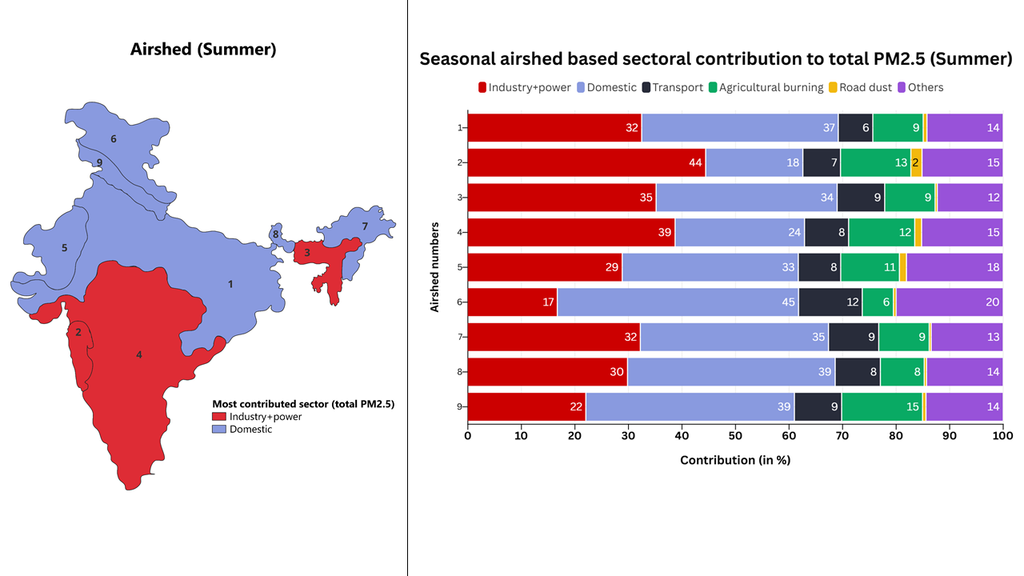
Figure — Summer season airsheds: dominant PM2.5 sources and sectoral contributions
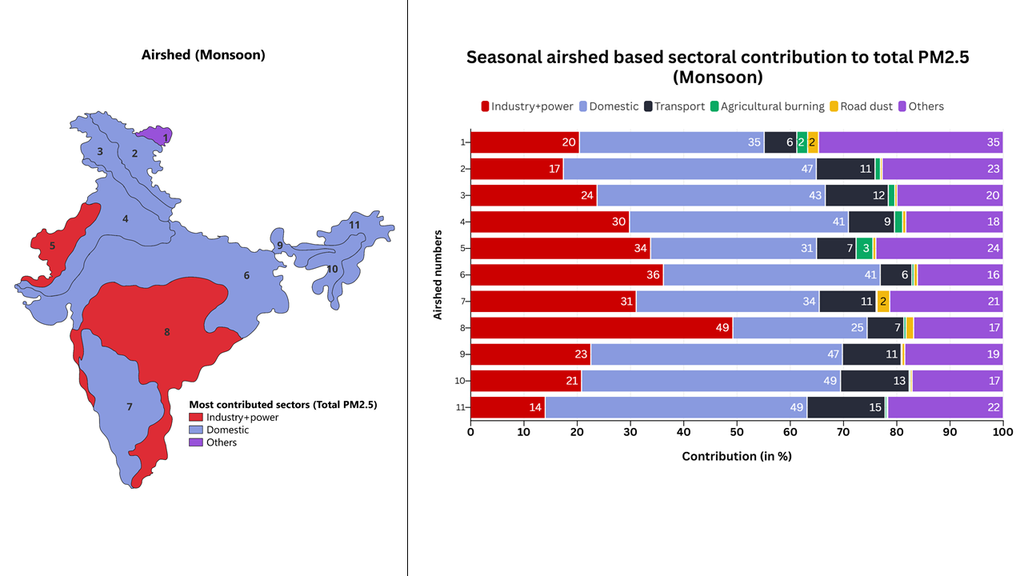
Figure —Monsoon season airsheds: dominant PM2.5 sources and sectoral contributions
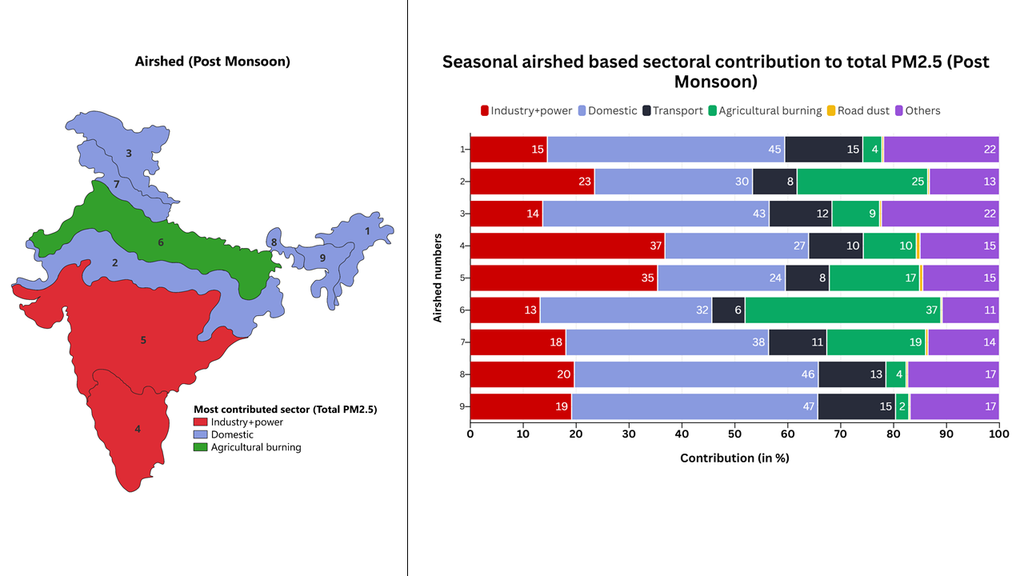
Figure — Post-monsoon airsheds: dominant PM2.5 sources and sectoral contributions
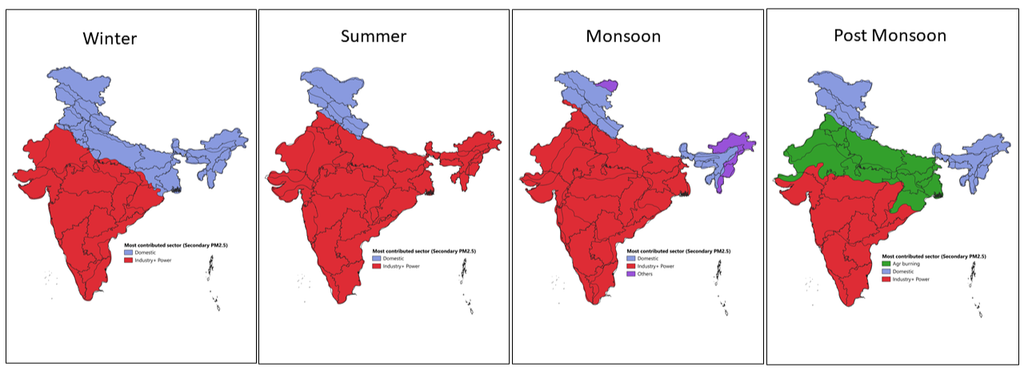
Figure — Seasonal variation in dominant sources of secondary PM2.5 across Indian airsheds
Policy implications
The findings highlight the need for NCAP’s next phase to move towards a more comprehensive, multi-sectoral and airshed-based approach to air pollution management. While road dust mitigation remains important, greater attention is needed on emissions from industry, power generation, and residential sources, given their substantial contributions across states, cities, and regional airsheds. Pollution-control strategies should also extend beyond directly emitted particulate matter to include gaseous precursors such as SO2, NOX and VOCs that contribute to secondary PM2.5 formation. Furthermore, the substantial contribution of emissions originating outside city boundaries emphasises the need for coordinated action across cities and states, supported by expanded air-quality monitoring and regular source-contribution assessments. NCAP’s next phase should therefore align funding and interventions with the sectoral and regional evidence on PM2.5 sources, rather than relying predominantly on city-level measures or a single source category.
Data sources
Ambient air quality data recorded by Continuous Ambient Air Quality Monitoring Stations (CAAQMS) is downloaded from the Central Control Room for Air Quality Management – All India’ dashboard operated by the Central Pollution Control Board (CPCB).
References
Kumar, A., Imam, F., Dixit, K., Chaudhary, E., Singh, N., Agarwal, S., Sharma, S., Katoch, V., Ganguly, D., & Dey, S. (2025). Sectoral contributions to primary and secondary PM2.5 in regional airsheds of India. ACS Earth and Space Chemistry, 9(4), 806–816. https://doi.org/10.1021/acsearthspacechem.4c00332
Lal, R. M., Nagpure, A. S., Anand, A., Maji, S., Tibrewal, K., Gupta, G., Venkataraman, C., & Tong, K. (2025). Transboundary emission contribution to PM2.5 concentrations in Indian cities. Environmental Research Letters, 20(5), 054008. https://doi.org/10.1088/1748-9326/adc147
Zhou, M., Mauzerall, D. L., Velamuri, V., Kota, S. H., Nambiar, M., & Xie, Y. (2026). Surface PM2.5 air pollution in 2022 India: Emission updates, WRF-Chem model evaluation, and source attribution. Atmospheric Chemistry and Physics, 26(14), 10533–10556. https://doi.org/10.5194/acp-26-10533-2026
Resources
To subscribe to these monthly air quality snapshots and to access the graphs and web version of this snapshot on our website here- India monthly ambient air quality snapshot
Monthly ambient air quality snapshot for India – October 2026 (pdf version)