
Authors: Luke Wickenden and Isaac Levi; Data scientist: Panda Rushwood
Russia’s LNG export revenue reaches a 44-month high, while the EU overtakes Turkiye as the third-largest importer of Russian fossil fuels.
Key findings
- In September 2026, Russia’s fossil fuel export revenues were broadly unchanged month-on-month at EUR 625 mn per day, despite a 6% decrease in export volumes.
- Russia’s crude oil export revenues fell 8% month-on-month to EUR 339 mn per day, and volumes dropped 11%, reflecting an 11% increase in pipeline crude oil and a 15% fall in seaborne crude export earnings.
- Revenue from seaborne oil product exports rose 6% to EUR 83 mn per day in September, still the second-lowest level since Russia’s full-scale invasion, while export volumes rose 2%.
- In September 2026, liquefied natural gas (LNG) export revenues from unloaded cargoes jumped 68% month-on-month to EUR 75 mn per day, the highest level since January 2023.
- Russia imported 234 thousand tonnes of seaborne oil products in September 2026, 44% less than in August, but still the second-highest monthly volume in data going back to January 2022. Turkiye accounted for 55% of total supplies, with Morocco providing most of the remainder. Shipments from South Korea fell to 8,000 tonnes following a threat of legal action regarding supply reaching Russia in August 2026, while no shipments arrived from India in September.
- In September, EU imports of Russian LNG rebounded by 60% month-on-month from August’s record low. Spain received no Russian LNG shipments in September, marking its first month without Russian LNG imports since the start of the full-scale invasion.
- In September 2026, China remained the world’s largest importer of Russian fossil fuels, while the EU overtook Turkiye to become the third-largest importer.
- Despite the EU’s ban on oil products made from Russian crude, seven shipments from refineries processing Russian crude were unloaded at EU ports in September 2026.
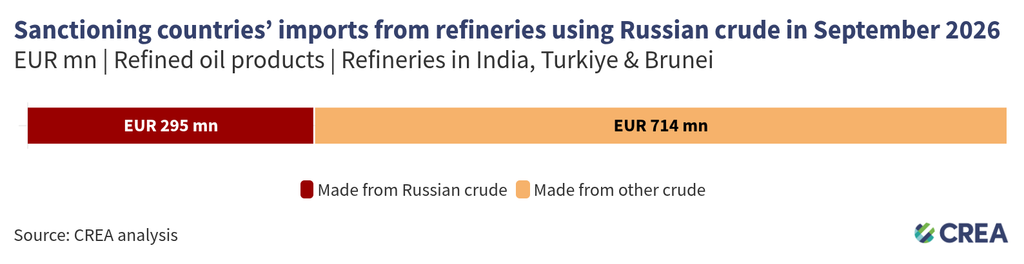
- Refineries in India, Turkiye, and Brunei that use Russian crude exported EUR 1.0 bn of oil products to sanctioning countries in September 2026, a 43% rise month-on-month.
- In September 2026, 57% of Russia’s seaborne oil was transported by sanctioned ‘shadow’ tankers. A further 40% of the volume was transported by G7+ owned or insured tankers. The remainder was transported by non-sanctioned ‘shadow’ tankers.
- Forty-eight ‘shadow’ vessels were operating under false flags at the end of September 2026, down from 120 at the end of September 2025. Falsely flagged tankers carried only 2% of the Russian oil delivered by the ‘shadow’ fleet in September 2026.
- Fifty Russian-flagged ‘shadow’ tankers delivered Russian oil in September 2026, compared with 22 in September 2025. They carried 36% of the oil delivered by ‘shadow’ tankers, making the Russian flag the largest in the ‘shadow’ fleet.
- A USD 30 per barrel crude oil price cap and lower oil product caps, fully enforced, would have cut Russia’s seaborne oil export revenues by 26% (EUR 2.7 bn) in September 2026.
- South Korea imported 18 mn tonnes of Russian coal from January to August 2026, 34% higher volumes than in the same eight-month period in 2025, making Russia its second-largest coal supplier.
Trends in total export revenues
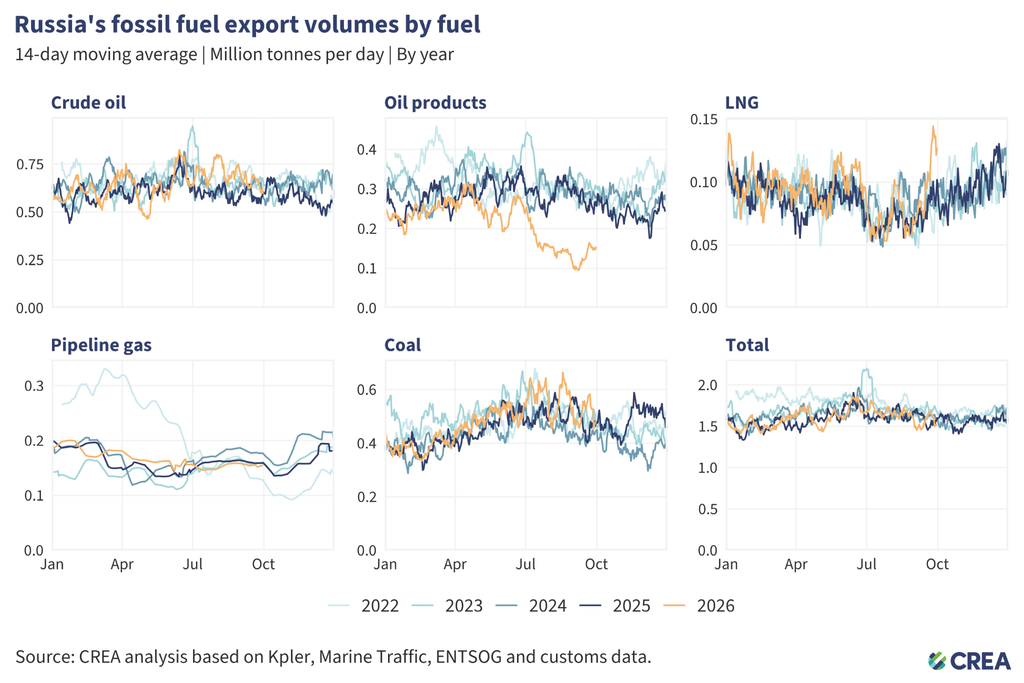
- In September 2026, Russia’s fossil fuel export revenues were broadly unchanged month-on-month at EUR 625 mn per day, even as export volumes fell by 6%.
- Russia’s crude oil export revenues fell 8% month-on-month to EUR 339 mn per day, and volumes dropped 11%. Pipeline crude oil export earnings were 11% higher than the previous month, whilst seaborne crude export revenues fell 15%.
- Revenue from seaborne oil product exports unloaded at their destination ports rose 6% month-on-month to EUR 83 mn per day, still the second-lowest level since Russia’s full-scale invasion, while export volumes rose 2%.
- Oil product loadings at Russian ports fell 12% month-on-month in September 2026 to one of the lowest monthly volumes since Russia’s full-scale invasion, around half the level observed in September 2025. Tuapse — Russia’s fourth-largest oil product export port before the full-scale invasion — which has faced sustained drone attacks since May, has not loaded a full cargo of oil products since June. With refinery throughput still depressed and domestic demand taking priority (jet fuel, diesel, and gasoline are still under an export ban), the persistently low oil product loadings suggest that Russia’s oil product export earnings could remain subdued in October, despite Trump’s announced agreement with Putin to increase Russian diesel supplies to the US.
- Following Ukrainian drone strikes on Russia’s Baltic Sea port of Ust-Luga at the beginning of September, crude oil loadings dropped 26% month-on-month. In September, additional drone strikes hit the Novorossiysk oil terminal; however, oil product exports dropped by a mere 3% month-on-month.
- Liquefied natural gas (LNG) export revenues from unloaded cargoes jumped by 68% to EUR 75 mn per day, the highest level since January 2023, while volumes rose 48% month-on-month. Loaded Russian LNG volumes also increased 41% month-on-month, driven mainly by a 50% rise in loadings from Russia’s Yamal LNG, while loadings from the sanctioned Arctic LNG 2 project more than doubled.
- Pipeline gas export revenues rose by 8% to EUR 71 mn per day, even as export volumes fell 2% month-on-month.
- Russia’s coal export revenues fell by 12% month-on-month to EUR 58 mn per day.
- Despite the decline in crude oil exports, Russia’s mineral extraction tax (MET) receipts from crude oil reached 688 billion rubles in September; furthermore, the MET rate for oil extraction rose 45.1% month-on-month. The rise in crude oil MET was driven by higher Russian oil prices, a weaker ruble and an increase in the export-duty component of the tax.
Who is buying Russia’s fossil fuels?
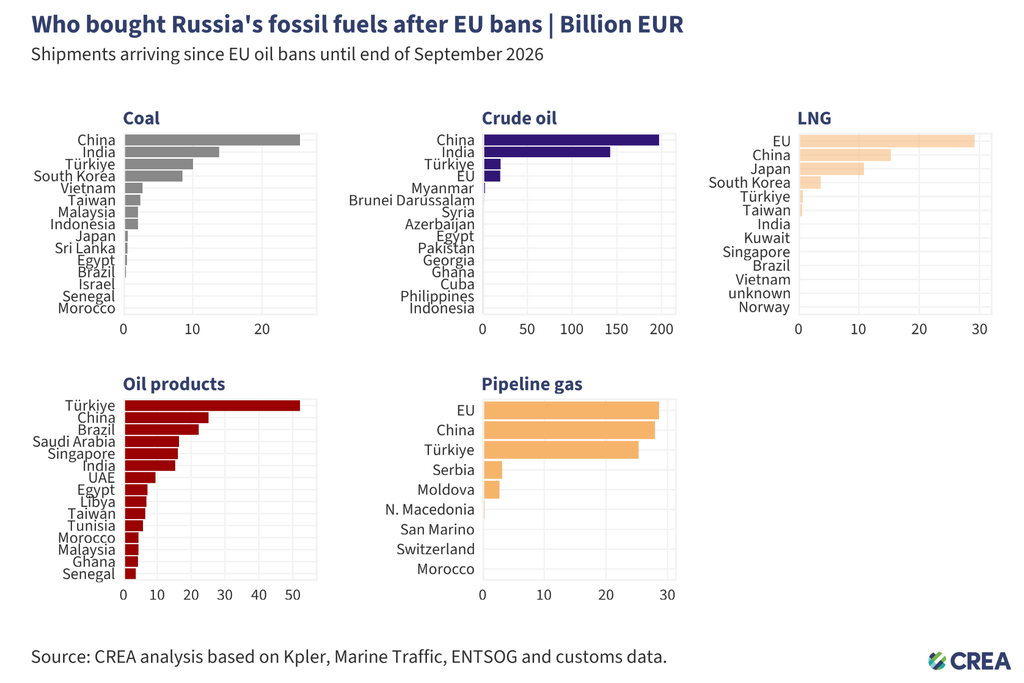
- Russia’s fossil fuel exports remain highly concentrated, with China dominating purchases of coal and crude oil, Turkiye leading purchases of oil products, and the EU remaining the largest buyer of LNG and pipeline gas — showing Moscow’s dependence on a narrow set of key customers.
- Coal: From 5 December 2022 until the end of September 2026, China purchased 36% of all Russian coal exports. India (20%), Turkiye (14%), South Korea (12%), and Vietnam (4%) round out the top five buyers’ list.
- Crude oil: China has bought 50% of Russia’s crude exports, followed by India (37%), Turkiye (5%), and the EU (5%).
- Oil products: Turkiye, the largest buyer, has purchased 26% of Russia’s oil product exports, followed by China (13%), Brazil (11%), Saudi Arabia (8%), and Singapore (8%).
- LNG: The EU remains the largest buyer of Russian LNG, accounting for almost half (48%) of Russia’s total LNG exports, followed by China (25%), Japan (18%), and South Korea (6%).
- Pipeline gas: The EU is the largest buyer, purchasing 32% of Russia’s pipeline gas exports, followed closely by China (32%) and Turkiye (29%).
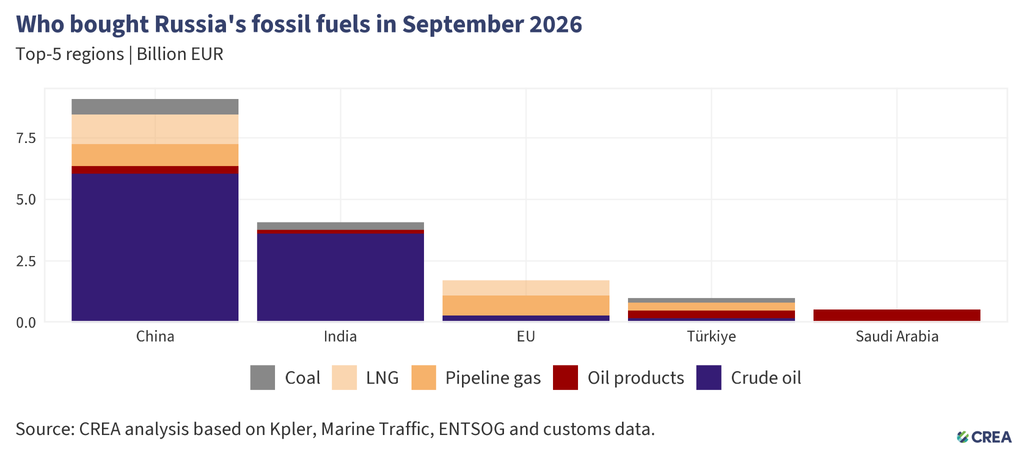
- In September 2026, China remained the largest global buyer of Russian fossil fuels, accounting for 55% (EUR 9.1 bn) of Russia’s export revenues from the top five importers. Crude oil accounted for two-thirds (EUR 6.0 bn) of China’s purchases, followed by LNG (EUR 1.2 bn), pipeline gas (EUR 894 mn), coal (EUR 635 mn), and oil products (EUR 304 mn).
- China’s unloadings of Russian seaborne crude fell by 12% month-on-month in September but were 22% higher than in September 2025. East Siberia–Pacific Ocean (ESPO) grade crude, which is loaded at the Pacific port of Nakhodka, continued to account for the majority (56%) of Russian crude unloaded at Chinese ports, down from 63% in August. Unloadings of Sokol grade, which loads at the Russian Pacific port of De Kastri, also fell by 35% month-on-month, while unloadings from the Baltic Sea port of Primorsk rose by 352%.
- In September 2026, most of China’s largest import installations reduced the volume of unloaded Russian seaborne crude. Unloadings at the Rizhao installation fell by 42% month-on-month, Dongying by 40%, and Yantai by 37%. The main exception was the Dongjiakou oil terminal, which became China’s largest recipient of Russian crude imports after import volumes rose by 35%.
- India was the second-largest buyer of Russian fossil fuels in September 2026, importing a total of EUR 4.1 bn of Russian hydrocarbons. Crude oil constituted 88% of India’s purchases, totalling EUR 3.6 bn. Coal (EUR 309 mn) and oil products (EUR 161 mn) constituted the remainder of its monthly Russian imports.
- India’s imports of Russian crude oil fell for a second consecutive month in September, down 13% month-on-month to their lowest level since April 2026. Russian crude imports fell at all three of India’s largest importing refineries: Vadinar (down 8% month-on-month), Jamnagar (down 27%), and Paradip (down 21%). Despite the decline, Vadinar overtook Jamnagar as India’s largest importer of Russian crude. Imports at smaller installations also mostly trended downwards, with the HMEL Mundra Oil Terminal and the Kochi refinery lowering intakes by 74% and 32%, respectively, month-on-month. The main exception was the IOC Mundra Oil Terminal, which received 570 thousand tonnes of Russian crude in September after receiving none in August.
- The EU was the third-largest buyer of Russian fossil fuels, accounting for 10% (EUR 1.7 bn) of Russia’s export revenues from the top five importers in September.
- EU imports of Russian LNG rebounded by 60% month-on-month in September, following August’s record low. Even so, the EU’s import volume of Russian LNG in September was the fourth-lowest monthly total since the start of Russia’s full-scale invasion.
- Almost three-quarters (72%) of the EU’s Russian LNG imports in September were unloaded at French ports, with the rest going to the Netherlands and Portugal. The rebound came five full months after the EU’s ban on short-term Russian LNG supply contracts took effect on 25 April 2026. Under the REPowerEU regulation, Russian LNG imports remain permissible until 1 January 2027 if the underlying long-term supply contracts were concluded before 17 June 2025, so strict enforcement and transparency remain necessary to ensure the ban is not undermined by imports under legacy contracts.
- Pipeline gas made up 47% of the EU’s imports (EUR 817 mn) and LNG 36% (EUR 615 mn). Crude oil accounted for the remaining 17% (EUR 290 mn), all of which was transported through the Druzhba pipeline to Slovakia and Hungary.
- Turkiye was the fourth-largest importer, purchasing EUR 1.0 bn of Russian hydrocarbons in September. Oil products accounted for the largest share at 32% (EUR 321 mn), followed by pipeline gas (EUR 314 mn), coal (EUR 195 mn), and finally crude oil (EUR 172 mn).
- Turkiye’s import volume of Russian oil products decreased by 12% in September — unloading the lowest monthly quantity of Russian refined fuels since June 2022. Oil products (EUR 321 mn) comprised the largest component of Turkiye’s purchases from Russia, narrowly ahead of pipeline gas (EUR 314 mn). Unloadings of Russian seaborne crude fell 59% month-on-month to their lowest level since January 2023. The Tupras Izmit refinery was the only installation to receive Russian crude in September, taking 45% less than in August, while the STAR refinery received none.
- Saudi Arabia was the fifth-largest importer of Russian fossil fuels in September, purchasing EUR 534 mn, consisting entirely of oil products. Its unloaded volumes rose 51% month-on-month, with fuel oil accounting for 98% of the total. Power plants were the largest identified destination. The Rabigh Power installation received 31% of imports, almost three times its August volume. The Arabtank Terminals storage facility accounted for 20% of the monthly total, with unloaded volumes rising 90% month-on-month. The Jizan refinery received 19% of imports, having received none in August. Almost half of the Russian fuel oil unloaded in Saudi Arabia had been loaded at the Baltic port of Ust-Luga.
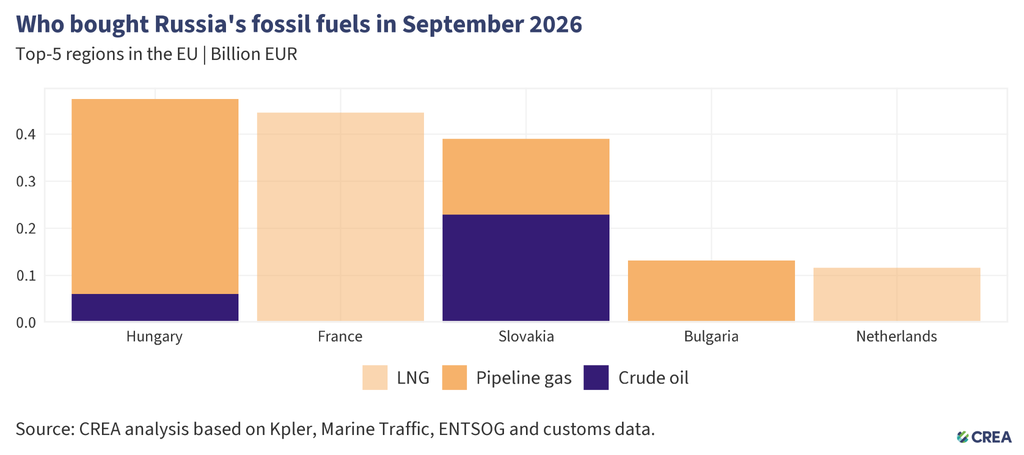
- In September 2026, the five largest EU importers of Russian fossil fuels paid Russia a combined EUR 1.6 bn. Natural gas (pipeline and LNG) — partially sanctioned by the EU — accounted for 81% of the value of imports from the five largest buyers. The five largest EU importers purchased EUR 1.3 bn of Russian natural gas, comprising EUR 707 mn of pipeline gas and EUR 562 mn of LNG, as well as EUR 290 mn of crude oil via the Druzhba pipeline.
- In September, EU imports of Russian LNG rebounded by 60% month-on-month from August’s record low, the lowest monthly volume since the start of the full-scale invasion of Ukraine.
- In September, Hungary was the EU’s largest buyer of Russian fossil fuels, importing EUR 475 mn, of which EUR 414 mn was pipeline gas and EUR 61 mn was crude oil delivered via the Druzhba pipeline.
- France was the second-largest EU importer of Russian fossil fuels in September, purchasing EUR 446 mn worth of LNG. The volume of French LNG imports from Russia increased by 103% month-on-month, with eight cargoes unloaded, all of which were loaded at the Yamal LNG installation.
- Slovakia was the EU’s third-largest importer in September, with crude oil (EUR 229 mn) accounting for the majority of its purchases, ahead of pipeline gas (EUR 161 mn).
- Bulgaria remained the fourth-largest EU importer of Russian fossil fuels in September, importing only pipeline gas (EUR 132 mn) through the Balkan Stream pipeline.
- The Netherlands was the fifth-largest EU importer of Russian fossil fuels in September, purchasing EUR 116 mn of LNG, with two cargoes unloaded at the Gate terminal in Rotterdam. Spain, by contrast, received no Russian LNG in September for the first time since the start of Russia’s full-scale invasion.
| South Korea’s imports of Russian coal are up by a third in 2026 |
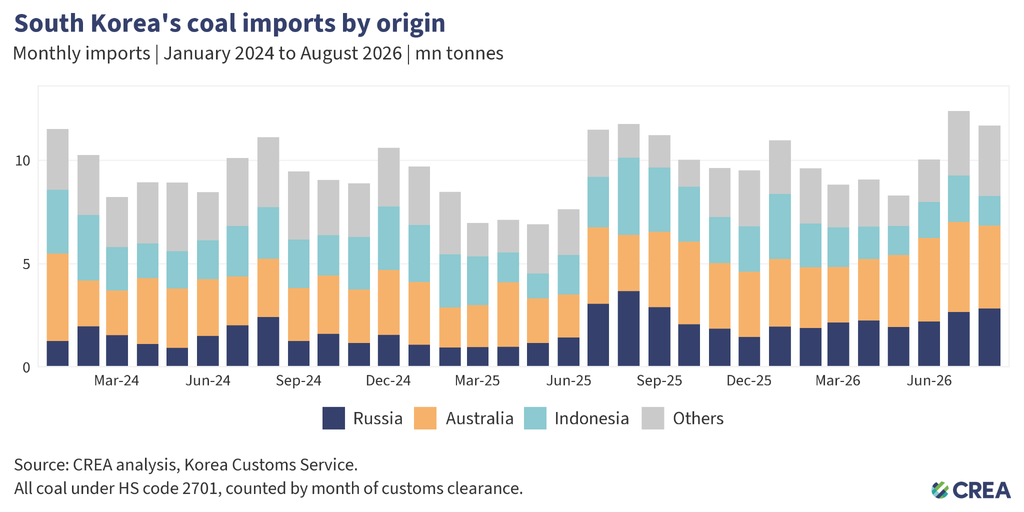
| South Korea imported a total of 80.9 mn tonnes of coal from January to August 2026, 15% more than in the same period of 2025, according to Korean customs data. Imports of Russian coal rose at a faster rate, by 34% to 18.0 mn tonnes, which is also 19% higher than the volumes imported between January and August 2021, before Russia’s full-scale invasion of Ukraine. Russia overtook Indonesia to become South Korea’s second-largest coal supplier between January and August 2026, accounting for 22% of the country’s coal imports, compared with Indonesia’s 19%, with only Australia supplying more (34%). From January to August 2025, Indonesia was second at 26%, and Russia was third at 19% of South Korea’s total imports. South Korea has not banned imports of Russian fossil fuels, and CREA’s tracking shows it was the fourth-largest buyer of Russian coal between January and September 2026, taking 13% of Russia’s coal exports. Coal-fired power generation in South Korea rose 18% between January and July 2026 compared with the same period in 2025 (from 87 TWh to 102 TWh), while nuclear generation fell 14% over the same period (from 114 TWh to 98 TWh), according to Ember data. Part of the fall in nuclear output reflects older reactors going offline as their 40-year operating licences expired. Coal became South Korea’s largest source of electricity between January and July 2026, accounting for 30% of generation, while nuclear had led the previous year with 33%. South Korea’s solar generation grew 13% between January and July 2026 compared with the same period in 2025 (from 24 TWh to 27 TWh), an increase equal to about a fifth of the fall in nuclear output. Total electricity generation was unchanged, and the 15 TWh increase in coal generation is close to the 16.5 TWh fall in nuclear. State-owned KEPCO appears in Kpler’s data as a significant buyer of Russian coal. The Russian coal company Suek also appear in the data as a significant seller of Russian coal to Korea; the company has been under US sanctions since February 2024. |
- Despite the EU’s ban on imports of oil products made from Russian crude, which came into force on 21 January 2026, seven shipments of oil products from refineries using Russian crude — identified as high risk according to EU guidance — were unloaded at EU ports in September. This was a decrease from the number of vessels unloaded in August 2026.
- Six of these shipments departed from India’s Jamnagar refinery, while one departed from Turkiye’s Tupras Izmit refinery.
- Italy was the largest recipient in September, unloading three shipments, followed by Romania with two, and Spain and the Republic of Cyprus with one each. A further three shipments were unloaded at the port of Kalecik in Northern Cyprus, where EU law does not apply, so they fall outside the ban and are not counted here. The application of EU law is suspended in northern Cyprus under Article 1(1) of Protocol No 10 to the 2003 Act of Accession because the government of the Republic of Cyprus does not exercise effective control there. However, this does not provide a blanket exemption from EU sanctions for EU nationals or companies involved in transactions with Kalecik port.
- Enforcement agencies in Member States must investigate shipments of oil products imported from refineries processing Russian crude or from ports connected to these refineries, to prevent Russian oil molecules from entering the bloc and thereby violating the EU’s ban.
- Refineries in India, Turkiye, and Brunei that use Russian crude exported EUR 1.0 bn of oil products to sanctioning countries in September 2026. The importers included the EU (EUR 667 mn), Australia (EUR 168 mn), the US (EUR 154 mn), and New Zealand (EUR 19 mn). An estimated EUR 295 mn of these products were refined from Russian crude.
- There was a 43% month-on-month increase in exports of oil products from these refineries reported as destined for ports in sanctioning countries.
- Exports of oil products reported as destined for EU ports from refineries running on Russian crude rose 80% in value terms month-on-month in September, including a single 104 thousand tonne cargo of gasoil from the Jamnagar refinery that was still en route to Rotterdam at the end of the month. Exports headed to Australia rose 12% month-on-month, while those headed to the US fell 16%.
- Exports to the US in September came from India’s Jamnagar refinery (EUR 122 mn) and Turkiye’s STAR refinery (EUR 33 mn). Between July and September 2026, 32% of the Jamnagar refinery’s crude imports came from Russia.
- The Kulevi port in Georgia, which is connected to the Kulevi refinery via pipeline, did not import any seaborne Russian crude in September 2026. In September, 100% of the Kulevi port’s crude oil imports came from Libya. The Georgian port of Kulevi has stated that it will no longer accept Russian oil as of August or September this year.
- The Kulevi refinery, which is connected to the Kulevi port via pipeline, has stated that, “As of 23 August, Black Sea Petroleum’s Kulevi Oil Refinery has been processing exclusively non-Russian feedstock, successfully completing its switch away from Russian-origin crude oil”. The EU’s 21st sanctions package introduced a transaction ban on Georgia’s Kulevi refinery, scheduled to apply from 25 January 2027 following a six-month transition period. Ahead of that date, the European Commission must report to the Council by 25 October 2026 on whether the refinery’s listing should be maintained.
| Russia continues to import oil products as Turkiye and Morocco replace India and South Korea as the largest suppliers |
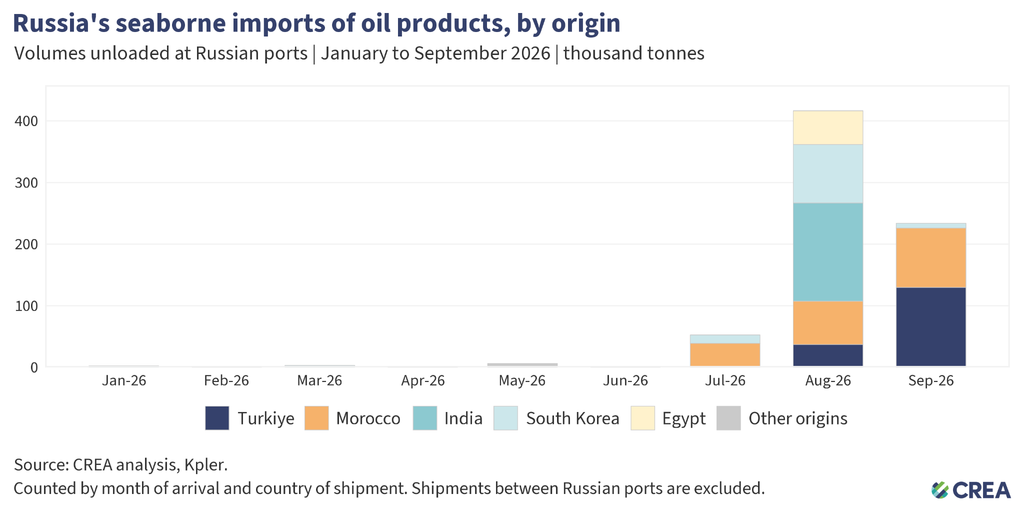
| Russia imported 234 thousand tonnes of oil products by sea in September 2026. That is 44% less than the record 416 thousand tonnes it imported in August 2026, but still the second-highest monthly volume in data going back to January 2022. Between January 2022 and June 2026, Russia’s seaborne imports of oil products averaged 9 thousand tonnes per month. Turkiye became Russia’s largest supplier in September 2026. Four cargoes from the port of Mersin in southern Turkiye, totalling 130 thousand tonnes (EUR 94 mn), were unloaded at Russian ports. This represented 55% of Russia’s imports for the month and three and a half times the volume of the single 37 thousand tonne cargo that arrived from Mersin in August 2026. Three of the cargoes contained gasoline, and one was diesel, loaded from storage terminals at Mersin for buyers including Rosneft and Lukoil in Russia. Russia accounted for 65% of all oil products exported from the Turkish port of Mersin in September 2026. Interestingly, Russia supplied 89% of the seaborne oil products imported at the Turkish port of Mersin in the first half of 2026. Some of these oil products may now be returning to Russia amid its domestic fuel supply crisis. Morocco was Russia’s second-largest supplier, and its shipments rose over the last three months, from 39 thousand tonnes in July 2026 to 70 thousand tonnes in August 2026 and 96 thousand tonnes in September 2026. According to Kpler, September’s three cargoes were all gasoline, loaded at the Horizon terminal in Tangier and unloaded at St Petersburg and Murmansk, with Gazprom and Surgutneftegas among the listed buyers. Since the publishing of last month’s report, which highlighted South Korea’s role in exporting oil products to Russia, those flows appear to have stopped following the threat of legal action against South Korean exporters. Only 8 thousand tonnes arrived from South Korea in September 2026, compared with 95 thousand tonnes in August 2026, and none had arrived in October as of 13 October 2026. Russian ports received no oil product shipments from India or Egypt in September 2026, compared with 160,000 tonnes from India and 55,000 tonnes from Egypt in August. A 40,000-tonne cargo from India arrived in early October. |
How are oil prices changing?
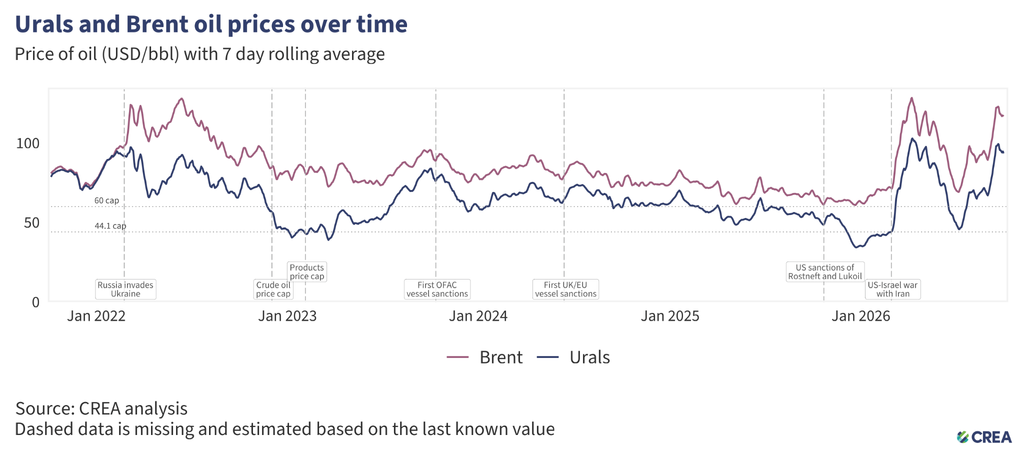
- In September 2026, the average price of Russia’s Urals-grade crude rose by 32% month-on-month to USD 90.7 per barrel, the highest monthly average since April 2026 and more than double the EU and UK price cap of USD 44.1 per barrel, which took effect on 1 February 2026 and has been capped at the same level under the EU’s 21st sanctions package.
- Global fossil fuel prices remained high in September despite a more than 60% month-on-month increase in the volume of oil transported through the Strait of Hormuz, based on detected vessel crossings. These volumes remained well below levels recorded before the US and Israeli strikes on Iran.
- The Hormuz energy crisis has delivered a substantial boost to Russia’s fossil fuel export earnings. CREA’s recent analysis estimates that, in the six months since the US–Israel strikes on Iran began, higher oil and gas prices have increased Russia’s seaborne export revenues by an estimated USD 35.9 bn (equivalent to EUR 31 bn).
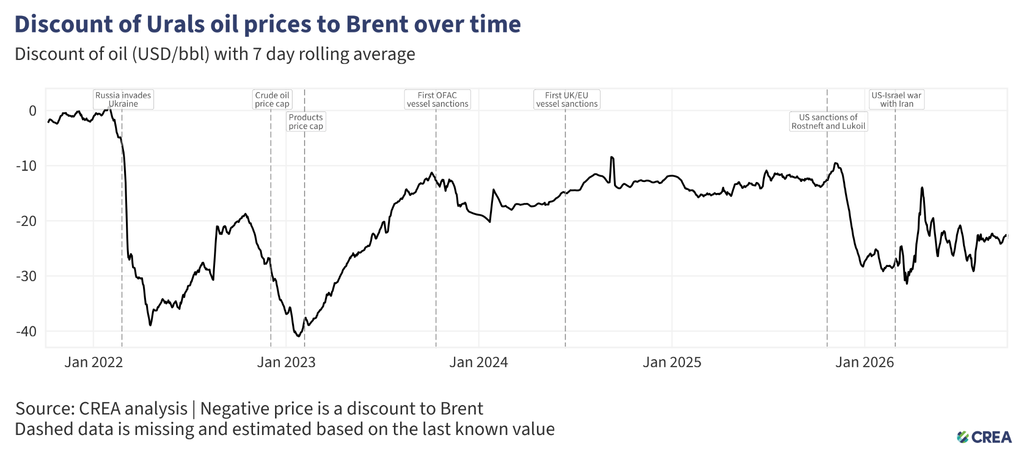
- In September 2026, the price discount on Urals-grade crude oil relative to the global benchmark Brent averaged USD 23 per barrel (21%), unchanged from August.
Sanctioned tankers carry the majority of Russian crude despite G7+ sanctions
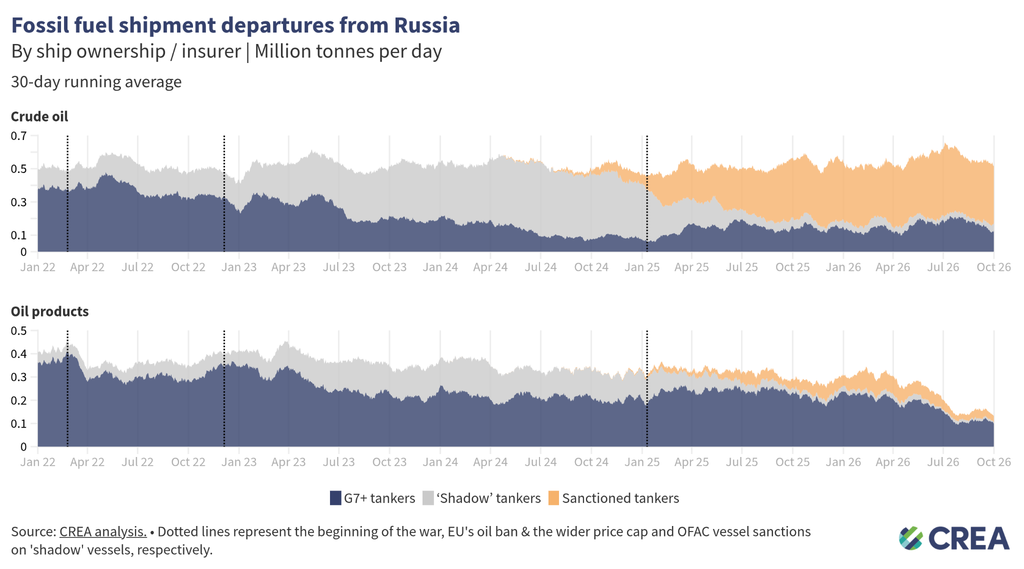
- In September 2026, 57% of Russia’s seaborne oil was transported by sanctioned ‘shadow’ tankers. A further 40% of the volume was transported by G7+ tankers. The remainder was transported by non-sanctioned ‘shadow’ tankers.
- G7+ tankers transported 30% of Russian crude oil exports in September, while non-sanctioned ‘shadow’ tankers accounted for 3% of the total. The largest share, 67%, was carried by sanctioned ‘shadow’ tankers.
- For oil products, Russia’s dependence on G7+ tankers is higher; these tankers transported 74% of Russian oil products in September. Sanctioned ‘shadow’ tankers carried 21% of total Russian oil product volumes, while non-sanctioned ‘shadow’ tankers accounted for the remainder.
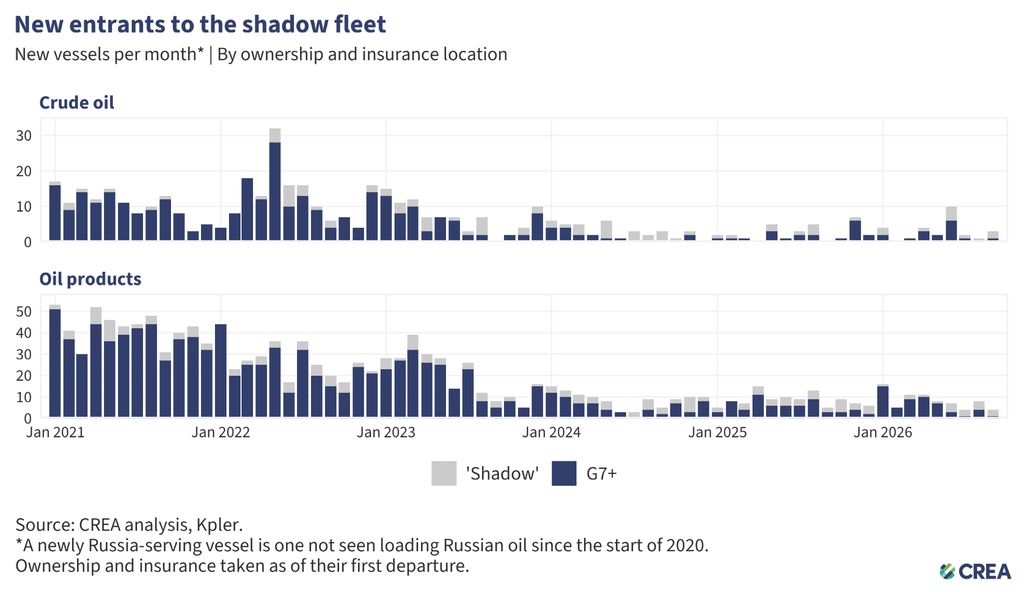
- In September 2026, seven new vessels entered the Russian oil trade, none of which had previously loaded Russian oil at any point since the start of our analysis period in 2020. This total is below the average (roughly 11 new vessels per month) over the past 12 months. Two of those seven newly Russia-serving vessels were owned or insured by the G7+ at the time of loading.
- Newly Russia-serving ‘shadow’ fleet vessels (with no ownership or insurance registered in sanctioning countries) remained low through the first five months of 2026, never exceeding three in a month, but June, July, August, and September have added eight, four, five, and five ‘shadow’ vessels, respectively.
- In September 2026, four vessels transported Russian oil products for the first time since 2020, and one was owned or insured by a G7+ country at the time of loading.
- In September 2026, three tankers transported Russian crude oil for the first time since 2020; one of them was owned or insured in a G7+ jurisdiction.
- This section has previously tracked ‘shadow’ tankers sailing under false flags, a practice that has declined sharply over the past year, as seen in the chart above. A year ago, at the end of September 2025, 120 ‘shadow’ fleet vessels were operating under a false flag; by the end of September 2026, only 48 were. Most falsely flagged vessels (39 of 48) loaded no Russian oil between July and September 2026. Those that did load Russian oil were loaded exclusively at Russia’s Black Sea or Pacific ports, limiting opportunities for European coastal states to detain them when exiting Russia’s Baltic Sea ports. As a result, in September 2026, only 2% of the Russian oil carried by the ‘shadow’ fleet was on falsely flagged tankers, down from 24% in September 2025. None have loaded at Russia’s Baltic or Arctic ports, whose routes pass through the Danish Straits and the English Channel, since May 2026.
- This progress is largely a result of the strong enforcement shown by coastal states in detaining, delaying, and disrupting vessels, combined with the strong diplomatic outreach and engagement with flag registries by the Nordic-Baltic 8++ (NB8++).
- False flags may continue to be discovered, most likely in the form of entirely fraudulent registries used to flag vessels, but since false flags are no longer a significant evasion tactic for Russian oil through EU waters, this section now tracks the flags of the entire ‘shadow’ fleet.
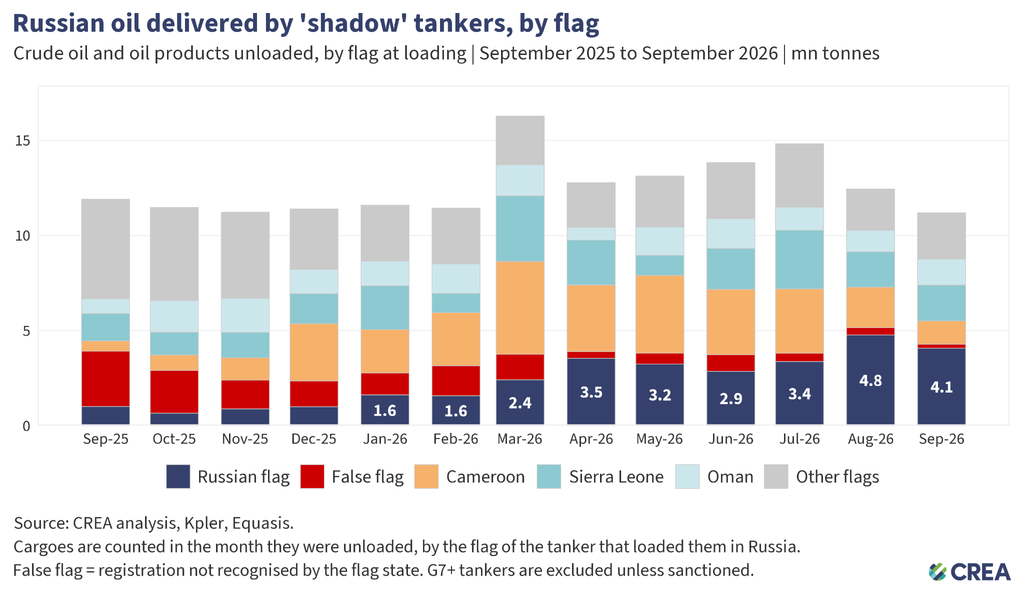
- In December 2025, Cameroon became the largest single flag in the ‘shadow’ fleet, carrying 26% of the oil delivered by ‘shadow’ tankers. As our June 2026 monthly report explained, that growth did not come entirely from the Cameroonian state: another body had hijacked its registry, issuing fraudulent registrations in the country’s name. Vessels have since been leaving the Cameroonian flag. According to our analysis of Equasis data, the number of Cameroonian-flagged vessels in the Russian trade fell from 140 in February 2026 to 69 at the end of September 2026, and no vessel transporting Russian fossil fuels has joined the flag since June 2026. Our data cannot distinguish vessels removed by the registry from those that left of their own accord. The Cameroonian flag’s share of oil delivered by ‘shadow’ tankers peaked at 31% in May 2026 and fell to 11% by September 2026.
- Russia’s own registry has taken in many of these tankers. Fifty Russian-flagged ‘shadow’ tankers delivered Russian oil in September 2026, compared with 22 in September 2025. Thirty-four of the 50 have joined the Russian registry since January 2025, and 25 of those 34 had flown a false flag before joining. Russian-flagged tankers’ share of the oil delivered by ‘shadow’ tankers rose from 9% in September 2025 to 36% (4.1 mn tonnes) in September 2026, and the Russian flag has been the largest single flag in the ‘shadow’ fleet since August 2026. Sierra Leone (17%) and Oman (12%) were the next-largest flags in September 2026.
‘Shadow’ tankers pose significant risks to ecology and the impact of sanctions
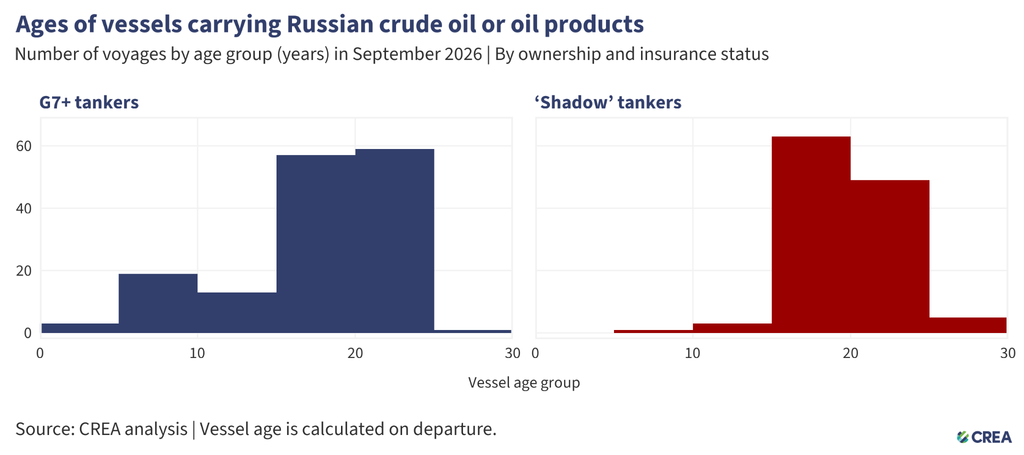
- In September 2026, 271 cargoes of Russian crude oil and oil products were delivered. Of these, 150 were carried by G7+ owned or insured tankers, and the remaining 121 by ‘shadow’ tankers. Additionally, 45% (54 in total) of the cargoes on ‘shadow’ tankers were carried by vessels at least 20 years old.
- Older ‘shadow’ tankers transporting Russian oil through EU waters pose environmental and financial risks due to their age, poor maintenance, and inadequate protection and indemnity (P&I) insurance. In the event of an oil spill or accident, coastal states may face significant cleanup costs and damage to their marine ecosystems.
- The cost of cleanup and compensation from an oil spill by tankers with dubious insurance could amount to over EUR 1 bn for taxpayers in coastal countries.
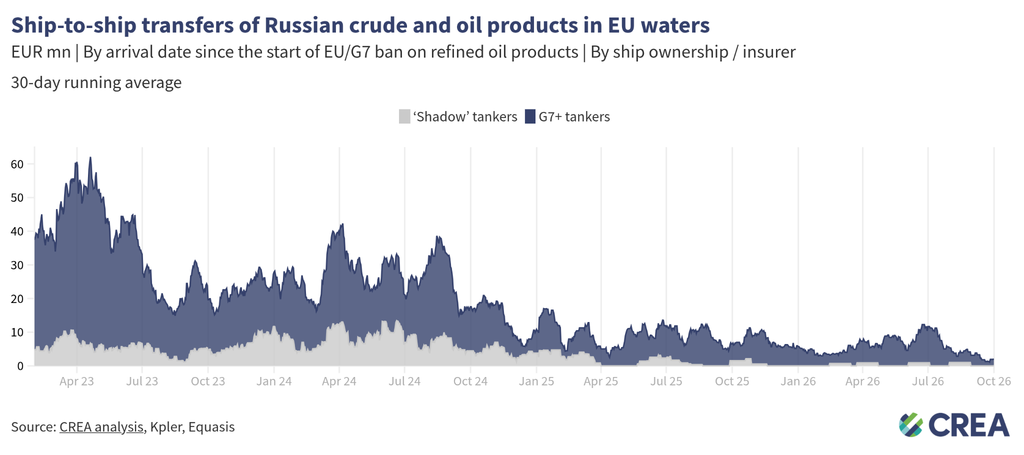
- In September 2026, an estimated EUR 58 mn worth of Russian oil was transferred across four ship-to-ship (STS) transfers in EU waters.
- All STS transfers of Russian oil in EU waters were conducted in Spanish (58%) and Cypriot waters (42%). G7+ tankers carried all four transfers.
- Daily transfers averaged EUR 1.9 mn in September 2026.
- Every STS transfer in EU waters in September involved oil products rather than crude oil.
How can Ukraine’s allies tighten the screws?
Russia’s fossil fuel export revenues have fallen since the sanctions were implemented, subsequently constricting Putin’s ability to fund his full-scale invasion of Ukraine. However, much more should be done to limit Russia’s export earnings and constrain the funding of the Kremlin’s war chest.
Lower the oil price cap to a baseline that tightens Russian revenues
The oil price cap policy has failed to impose a durable constraint on Russian crude export earnings, working only briefly and selectively for Urals while leaving other grades and export channels largely unaffected. Urals prices have fallen below the former USD 60-per-barrel cap for merely short periods. The cap was lowered to USD 44.10 per barrel on 1 February 2026 and subsequently frozen at that level under the EU’s 21st sanctions package. Meanwhile, ESPO-grade crude has consistently traded above both price cap levels because of strong demand from China and other Pacific markets.
G7+ sanctions have focused on Russian revenues rather than on restricting Russian export volumes — aimed at keeping Russian barrels flowing in global markets and easing fears of supply constraints. Policies such as the price cap are mainly aimed at reducing the price at which Russia could sell their oil.
In January 2026, as Russian oil prices fell sharply due to market oversupply, the EU proposed a ban on maritime services that facilitate Russia’s crude oil exports. Subsequently, in April 2026, the EU adopted its 20th sanctions package, which includes the basis for a future maritime services ban on Russian crude oil and petroleum products; however, it will be implemented only if an agreement is reached with the G7 and the Price Cap Coalition members. The maritime services ban would have, for the first time, targeted Russian oil export volumes and aimed at shrinking the tanker capacity required to transport Russia’s oil globally.
A massive spike in oil prices following reduced flows of fossil fuel shipments through the Strait of Hormuz has prompted a rethink of this policy to avoid creating further supply crunches in global markets. Therefore, in the face of the current energy crisis of 2026, CREA recommends that the price cap coalition either fix the price cap policy to a base level that severely restricts Russian revenues or implement a value-based sanction, such as a tax or surcharge on the use of Western maritime services for transporting Russia’s fossil fuels. A tax imposed by sanctioning countries on the use of Western maritime services to transport Russian crude oil and petroleum products could leverage their influence over trade to reduce Russian exporters’ profits, make Russian oil less commercially attractive, and generate revenue that could be used to support Ukraine.
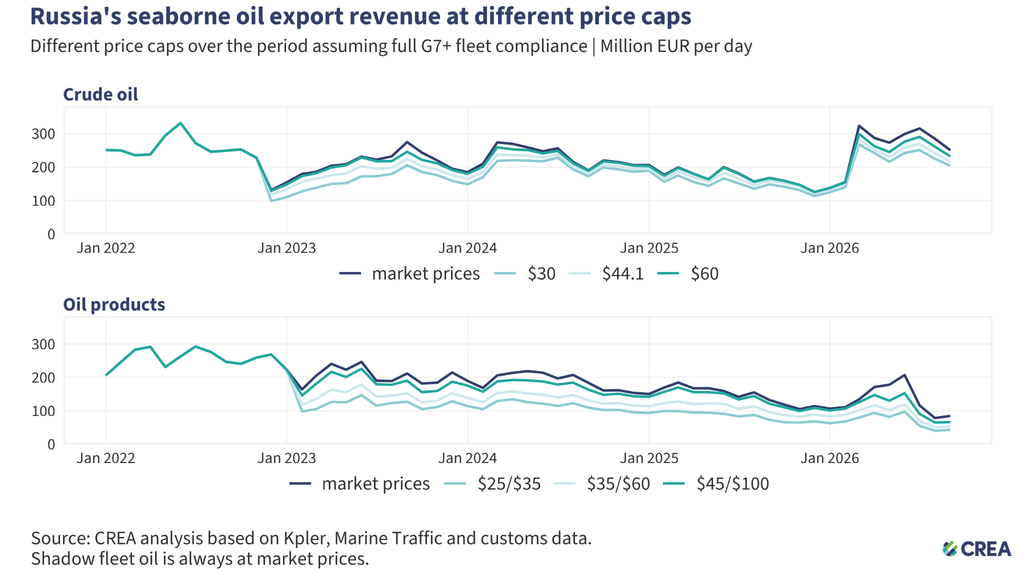
Note: CREA models price cap scenarios using the observed G7+ share of the tanker fleet transporting Russian crude oil and oil products. From the September 2026 edition, crude oil and oil product caps are modelled separately, so the figures below are not directly comparable with those in earlier editions.
- CREA recommends that the price cap for crude oil be set at a lower level of USD 30 per barrel — still well above Russia’s production cost, which averages USD 15 per barrel. Had a USD 30 per barrel cap been fully enforced on G7+ tankers, Russia’s total seaborne crude oil export revenues would have been 19% (EUR 1.4 bn) lower in September 2026. Since the EU’s ban on Russian crude oil took effect in December 2022, the same cap would have cut these revenues by 17% (EUR 52 bn). By comparison, full enforcement of the current USD 44.1 per barrel cap would have cut Russia’s seaborne crude oil export revenues by 13% (EUR 1.0 bn) in September 2026, and the former USD 60 per barrel cap by 7% (EUR 0.6 bn).
- CREA also recommends lowering the oil product price caps, which have remained unchanged since they were introduced in February 2023 at USD 100 per barrel for products that trade at a premium to crude oil and USD 45 per barrel for those that trade at a discount. Caps of USD 35 and USD 25 per barrel, respectively, would have cut Russia’s seaborne oil product export revenues by 49% (EUR 1.3 bn) in September 2026, and by 42% (EUR 96 bn) since the EU’s ban on Russian oil products took effect in February 2023. An intermediate option of USD 60 per barrel for premium products and USD 35 per barrel for discounted products would have cut Russian oil product export earnings by 38% (EUR 1.0 bn) in September 2026, compared with 22% (EUR 555 mn) under full enforcement of the current caps. Policymakers should not overlook their leverage over the transportation of these products, as G7+ owned or insured tankers carried 74% of Russia’s seaborne oil product exports in September 2026, compared with 30% of its seaborne crude oil exports.
- Together, the lower crude oil and oil product caps would have reduced Russia’s seaborne oil export revenues by 26% (EUR 2.7 bn) in September 2026, and by 28% (EUR 148 bn) since the bans took effect.
- Lowering the price cap would be deflationary, reducing Russia’s oil export prices and inducing more production from Russia to make up for the drop in revenue.
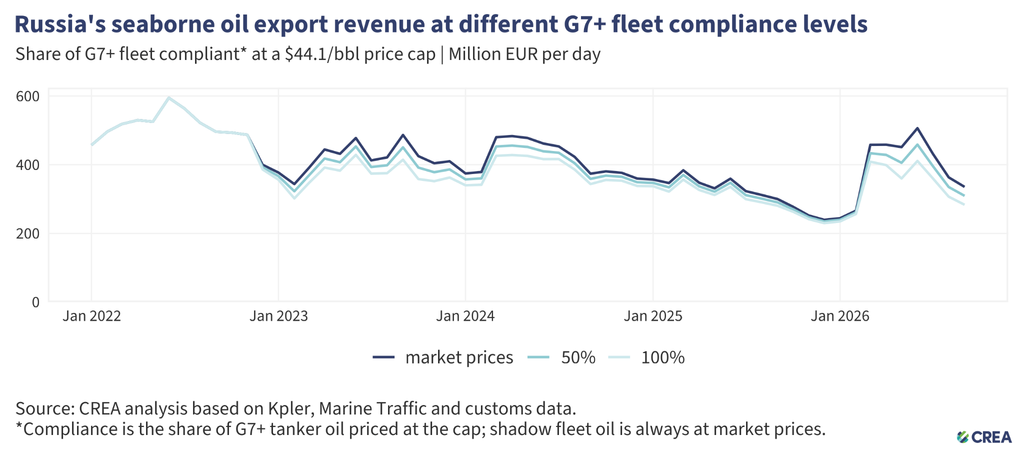
- For the price cap policy to achieve its desired impact, strong enforcement is key. In September 2026, full enforcement of the USD 44.1 per barrel price cap and the two respective oil product price cap levels (USD 100 per barrel for premium to crude oil products and USD 45 per barrel for discount to crude oil products) would have reduced Russia’s seaborne oil export revenues by 16% (approximately EUR 1.6 bn) compared to zero compliance with the policy.
- If 50% of Russian oil transported on G7+ tankers had complied with the current price cap levels, Russia’s seaborne oil export revenues in September 2026 would have been approximately EUR 781 mn (8%) lower than under a scenario with no price cap compliance.
Create better enforcement mechanisms for the price cap policy
Sanctioning countries must implement measures that address attestation fraud — a key enabler of non-compliance. Maritime insurers or vessel owners currently do not have direct access to pricing information for the oil they insure or transport and are reliant on attestation documents provided by oil traders for price cap compliance. At the same time, the majority of Russian crude oil is traded by opaque entities located outside price cap coalition countries — such as the UAE and Hong Kong. These traders can fraudulently underreport the price that they paid to attain Western maritime services for the transport of Russian oil.
Maritime insurers and oil traders must be required to obtain a bank statement showing that the Russian oil was traded below the price cap to avoid fraudulent attestation documents being produced. This bank statement must be verified by the bank itself to reduce the risk of the oil trader fraudulently producing documents. It would also enable maritime service providers to independently verify the price paid for the oil.
As an alternative to amending and enforcing the price cap policy, sanctioning jurisdictions could utilise their leverage to tax Russia’s use of G7+ maritime services when transporting its fossil fuels.
Restrict the growth of ‘shadow’ tankers & tighten regulations targeting the refining loophole
- Frequent sanctioning of Russian ‘shadow’ vessels has shifted Russian oil back to tankers owned or insured in G7+ countries. Nonetheless, Russian ‘shadow’ tankers still hold sway over the transport of Russian crude oil. In addition, many sanctioned vessels continue to deliver oil to ports globally, with EU and UK sanctions in particular being frequently violated. Sanctioning countries must align their vessel lists and enforcement paradigms for a magnified effect on their operations.
- Maritime coastal states should intensify efforts to monitor, inspect, and detain ‘shadow’ fleet vessels that lack legal passage rights, such as unflagged, unlawfully idle, or security-risk vessels. Authorities must enforce and improve environmental and navigation laws within their territorial waters, investigating and boarding suspicious vessels when justified. Crews involved in criminal activity should face prosecution, and noncompliant ships and personnel should be subject to international arrest warrants.
- In its 18th sanctions package, the EU banned the imports of ‘oil refined from Russian crude’. The regulation bans imports from countries that are ‘net importers’ of crude oil. Net export status does not preclude the import and refining of Russian-origin crude, especially in jurisdictions with flexible or opaque crude sourcing practices. To close this enforcement gap, the exemption should be applied at the refinery level rather than the national level. Refined petroleum products should be subject to import restrictions if produced at facilities that have processed Russian crude within the past six months, regardless of the final product’s declared origin or the host country’s net export position.
- The exemptions for countries including the UK, the US, Canada, Norway, and Switzerland create an opportunity for oil products refined from Russian crude to be re-exported to the EU. This gap should be closed to ensure the sanctions are comprehensive and watertight. The EU should work with its partners to encourage them to also ban the import of oil products from refineries processing Russian crude.
- Imports of oil products or petrochemicals from storage terminals or re-export hubs in non-sanctioning countries that have received a shipment of Russian oil in the previous six months should be prohibited from exporting to sanctioning jurisdictions. This aims to prevent re-export hubs from obfuscating the origin of imported Russian oil products that are then sent to sanctioning countries, as seen in suspicious cases observed in Turkiye and Georgia.
Stronger sanctions enforcement and monitoring of violations
- Despite clear evidence of violations, there is a need for stronger enforcement of penalties by agencies against shippers, insurers, and vessel owners. This information must be shared widely in the public domain. Penalties against violating entities increase the perceived risk of being caught and serve as a deterrent.
- Penalties for violating the price cap must be significantly harsher. If found guilty of violating sanctions, vessels should be fined and permanently banned from accessing Western maritime services or entering ports in sanctioning jurisdictions.
- The G7+ countries should ban STS transfers of Russian oil in their territorial waters. STS transfers undertaken by old ‘shadow’ tankers with questionable maintenance records and insurance pose environmental and financial risks to coastal states and support Russia logistically in exporting high volumes of crude oil. Coastal states should require oil tankers suspected of being ‘shadow’ tankers transporting Russian oil through their territorial waters to provide documentation showing adequate maritime insurance. If they fail to do so and are identified as a ‘shadow’ tanker, they should be added to the Office of Foreign Assets Control (OFAC), UK, and European sanctions lists. This policy could limit Russia’s ability to transport its oil on ‘shadow’ tankers, which are not required to comply with the oil price cap policy.
- To strengthen the integrity of maritime operations, the International Maritime Organization (IMO) must revise its guidelines to enhance transparency regarding maritime insurance. The IMO should mandate that flag states require shipowners and insurers to publicly disclose key financial information, including insurer solvency data, credit ratings from recognised agencies, and audited financial statements. Maritime authorities of coastal states should be legally able and encouraged to detain tankers that fly false flags and therefore pose environmental and security threats. The IMO should also promptly report tankers operating under false flags or with revoked registrations, improving transparency and enabling authorities to better track falsely flagged vessels.
Relevant reports:
- Trump’s Diesel Insult to Lindsey Graham
- Fuel from South Korea being shipped to Russia as Ukraine war grinds on
- South Korea threatens legal action if fuel shipments to Russia found to have broken law
- Russia expands fleet as crackdown on stateless vessels intensifies
- Funding Putin: ‘Blood oil’ imports from major Asian supplier surge
See CREA’s live Russian Fossil Fuel Export Tracker and Russia Sanctions Tracker for the latest data on Russian fossil fuel exports and the impact of sanctions.
If you would like to obtain any of the data underlying these charts, please do not hesitate to contact us at queries-russia@energyandcleanair.org.
| Note on methodology: This monthly report uses CREA’s fossil shipment tracker methodology. The data used for this monthly report is a snapshot taken at the end of each month. The data provider revises and verifies data on trades and oil shipments throughout the month. We subsequently update this verified data each month to ensure accuracy. This might mean that figures for the previous month will change in our updated subsequent monthly reports. For consistency, we do not amend the previous month’s report; instead, we treat the latest one as the most accurate data for revenues and volumes. Russia’s daily revenues for commodities used in this report are derived as an average, using CREA’s pricing methodology. The number of vessels with false flags per month is calculated using an end-of-month snapshot. In other words, for each month, vessels were counted if their most recent flag change at the end of the month was to a false flag. This does not account for the vessels with multiple false flag periods (switches between false flags and verified flags, or between different false flags), only the most recent flag status at the end of the month. To calculate the oil delivered by ‘shadow’ tankers under each flag, we count each cargo of Russian crude oil or oil products once, in the month it was unloaded, under the flag flown on the loading date by the tanker that loaded it at a Russian port. A flag is treated as false when the registration in force on the loading date is not recognised by the flag state. ‘Shadow’ tankers are those that were sanctioned on the loading date or were not owned or insured in G7+ countries; G7+ owned or insured tankers that were not sanctioned are excluded. The chart names the three flags, other than the Russian flag, that carried the largest volumes over the 13 months shown. We assume that falsely flagged vessels that have not transported a single cargo in the last 15 months are not operational and therefore exclude them from the analysis. CREA’s estimates of the impact of a revised and lowered price cap have been updated since February 2025. These numbers are a more accurate representation of the revenue losses Russia would incur. |