
Author: Xiaoli Zhang; Data scientist: Miao Chien, Danny Hartono; with contributions from Lauri Myllyvirta, Lead Analyst
Despite declines in NO₂ levels across most provincial capitals, 22 of China’s 31 provincial capitals recorded increases in PM2.5 concentrations in September. Unfavourable weather and emissions both contributed to the largest rises. By the end of September, 18 and six capitals exceeded the PM2.5 and ozone benchmarks, respectively, with exceedances remaining concentrated in northern China.
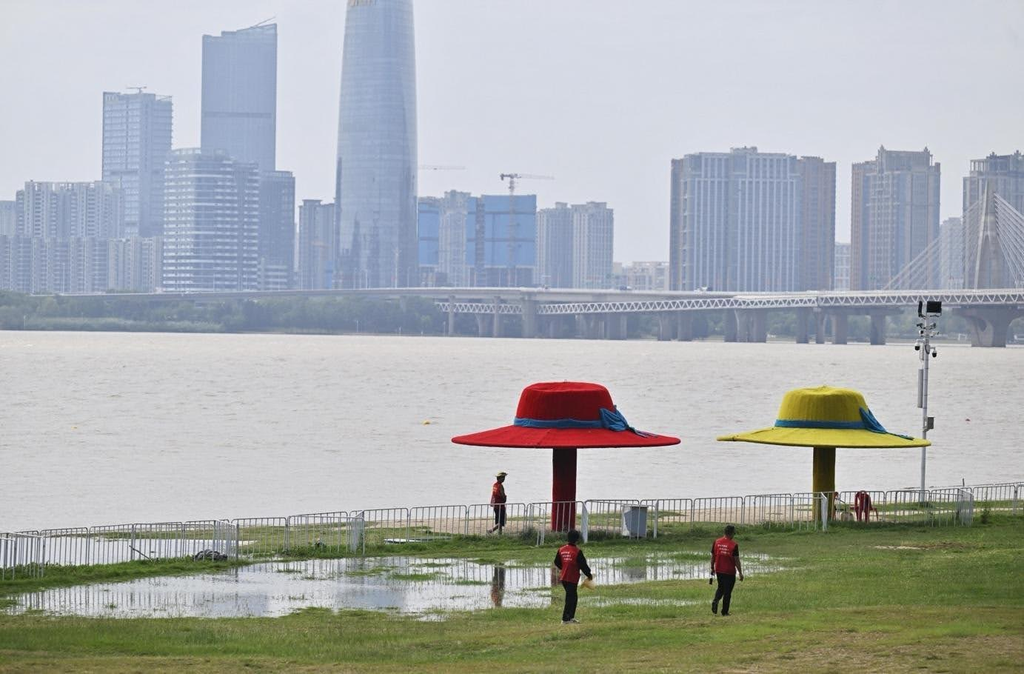
Rising waters submerge a beach in Nanchang, Jiangxi province, after heavy rain, Sep. 4, 2026. Photo: Imaginechina/Sipa USA
Key findings
- Following the tightening of China’s annual PM2.5 standard from 35 to 30 µg/m³ in March 2026, the number of provincial capitals failing to meet the standard rose sharply from six at the end of February to 18 by the end of March. The number remained at 16 from May to August before rising to 18 in September, with Nanchang and Hefei joining the list.
- PM2.5 levels rose year-on-year in 22 provincial capitals in September, up from 18 in August. Unfavourable weather and changes in emissions both contributed to the largest increases. Further air-quality improvements will depend increasingly on structural changes in energy, industry, and transport; otherwise, pollution can rebound quickly when weather turns less favourable.
- Haikou, a southern provincial capital that typically enjoys relatively good air quality, recorded the largest year-on-year increases in ozone concentrations at 90%, driven by higher emissions and unfavourable weather. In the Yangtze River Delta, ozone levels fell in Shanghai and Hangzhou but rose slightly in Nanjing.
- Lower emissions contributed clearly to declining NO2 levels across most provincial capitals. Only two cities—Fuzhou and Haikou—saw emissions contributing to higher NO2 concentrations. In some cities, unfavourable weather offset part of the benefits from emission reductions.
18 provincial capitals failed to meet the new annual PM2.5 standards
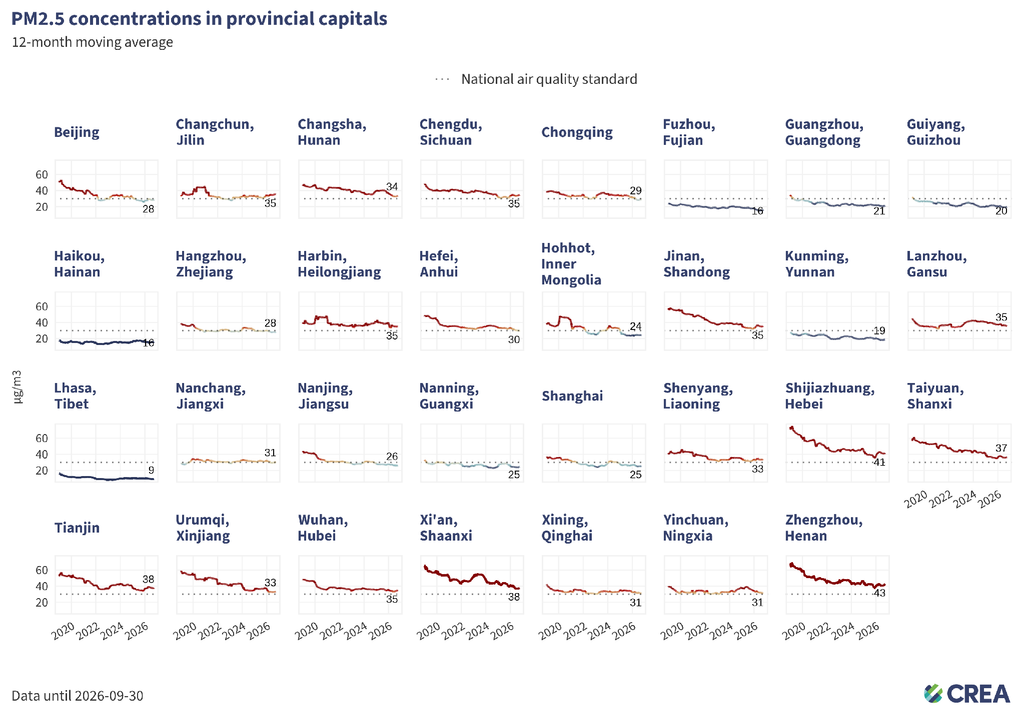
- By end of September, 18 of China’s 31 provincial capitals had 12-month average PM2.5 concentrations above the national annual standard of 30 µg/m³, meaning they failed to meet the standard. Nanchang (30.8 µg/m³) and Hefei (30.1 µg/m³) newly joined the list. Starting in March 2026, the new national standard for PM2.5 has been tightened from 35µg/m³ to 30 µg/m³.
- The cities with the highest PM2.5 levels remained concentrated in the Beijing-Tianjin-Hebei surrounding area. Zhengzhou (Henan) recorded the highest levels at 43 µg/m³, followed by Shijiazhuang (Hebei) at 41 µg/m³. Xi’an (Shaanxi) and Tianjin both recorded levels around 38 µg/m³.
- Provincial capitals that failed to meet the national PM2.5 standard were mainly concentrated in Northeast China and key air-pollution control regions, including the Beijing-Tianjin-Hebei surrounding area and the Fenwei Plain. Nanchang and Hefei’s addition to the list shows that the capitals of Jiangxi and Anhui also face pollution pressure.
PM2.5 levels saw year-on-year increases in 22 provincial capitals in September
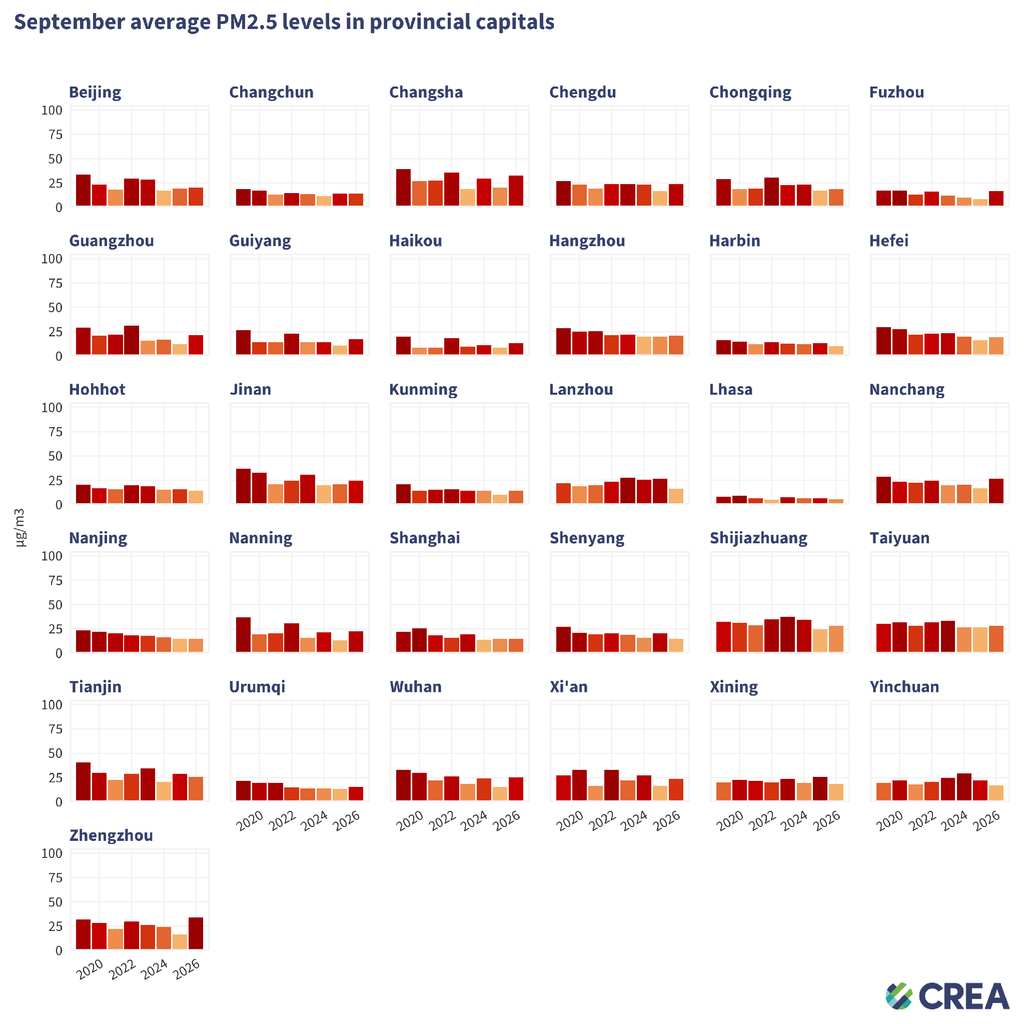
- The largest year-on-year increases were recorded in Zhengzhou (+105%), Fuzhou (+91%), and Guangzhou (+75%), with Nanning (+67%) and Wuhan (+66%) also recording large rises, highlighting a rebound in pollution across central and southern provincial capitals.
- Lanzhou (-39%), Shenyang (-29%), and Xining (-27%) recorded the biggest year-on-year declines.
Six provincial capitals exceeded the annual ozone limit
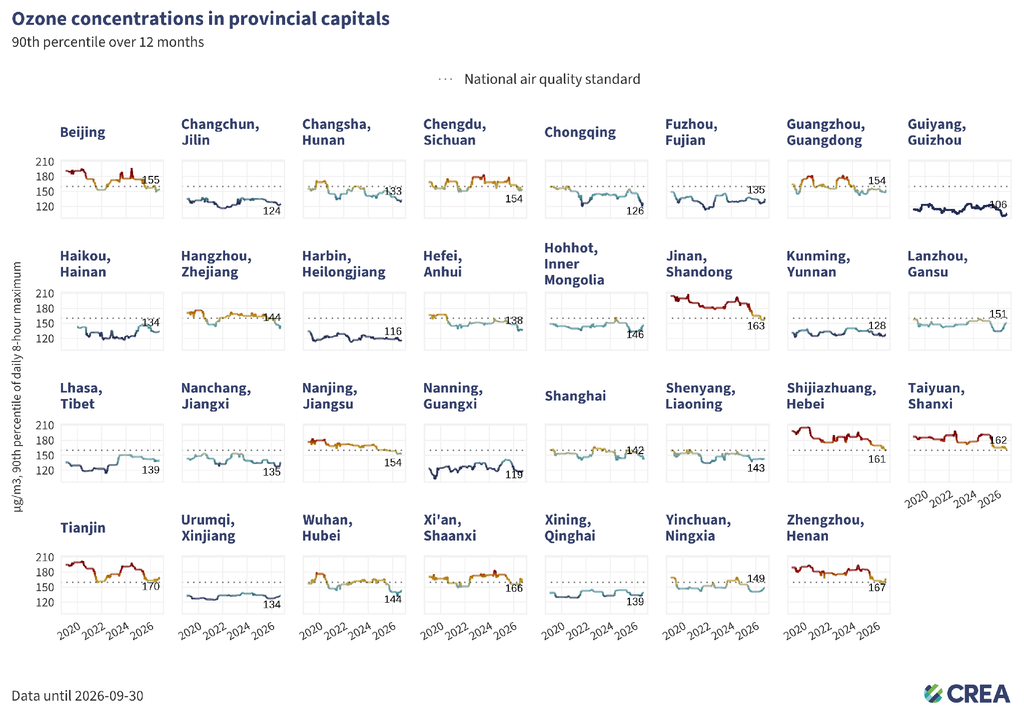
- As of the end of September 2026, six of 31 provincial capitals recorded 12-month 90th percentile ozone concentrations above the national standard of 160 µg/m³.
- Tianjin recorded the highest level at 170 µg/m³, followed by Zhengzhou (Henan) at about 167µg/m³, and Xi’an (Shaanxi) at about 166 µg/m³.
- All six non-compliant capitals were still in northern China, underlining the persistence of regional ozone pressure across the Beijing-Tianjin-Hebei region and nearby inland provinces.
Ozone levels saw year-on-year increases in 22 provincial capitals in September
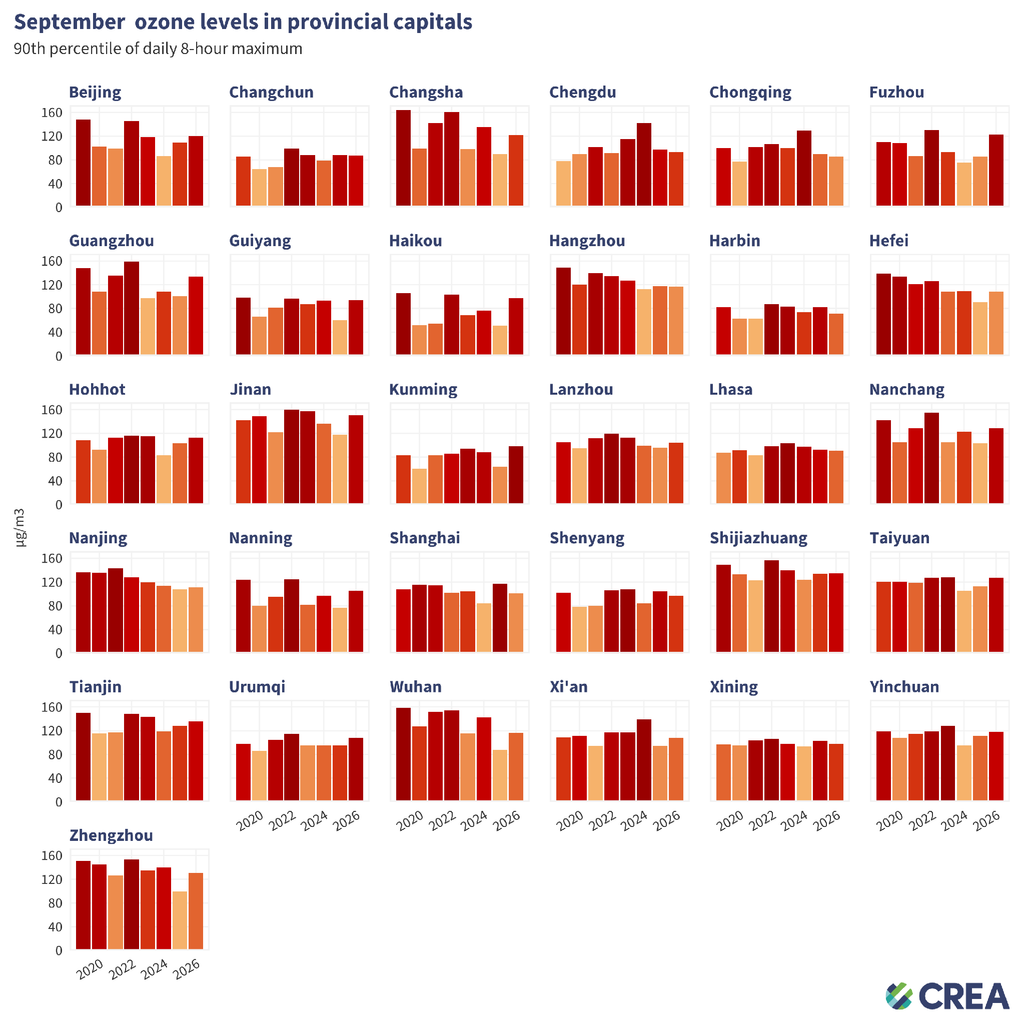
- Southern and western capital cities saw the largest year-on-year increase in ozone levels: Haikou (+90%), Guiyang (+55%), Kunming (+53%), Fuzhou (+44%), and Nanning (+38%).
- In the Yangtze River Delta, one of China’s key regions for sustained air-quality improvement, ozone concentration fell by 13% in Shanghai and 1% in Hangzhou, but rose by 3% in Nanjing. Harbin (−13%) and Shanghai (−13%) recorded the largest declines among the 31 capitals, followed by Shenyang (−8%).
- Oil displacement from electric vehicles and public transport helped drive a marked decline in urban NOx levels in China following the Strait of Hormuz shipping crisis.
Multi-pollutant pressure still concentrated in northern capitals
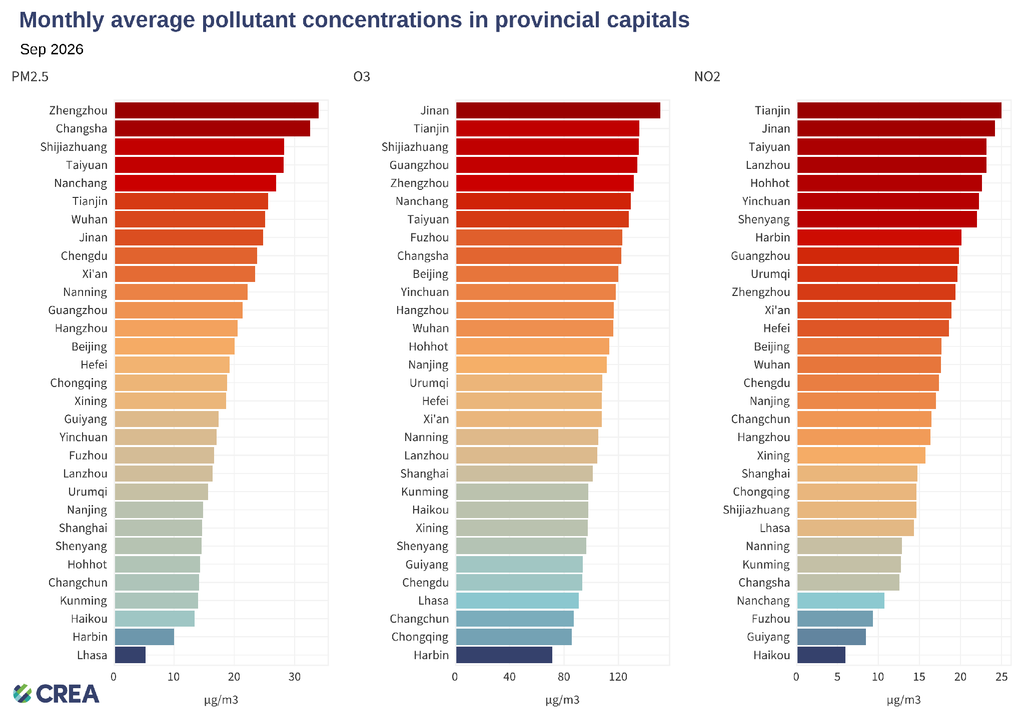
- Northern capitals continued to record high concentrations of all three pollutants. Tianjin, Jinan and Taiyuan ranked near the top for all three pollutants. Jinan had the highest monthly ozone level, while Tianjin had the highest NO₂ level.
- Pollution was also high in central and southern capitals. Changsha and Nanchang ranked second and fifth for PM2.5, respectively, while Guangzhou ranked fourth for ozone. Despite a sharp rise in ozone, Haikou maintained low PM2.5 and NO₂ levels.
Lower emissions drove widespread NO₂ declines
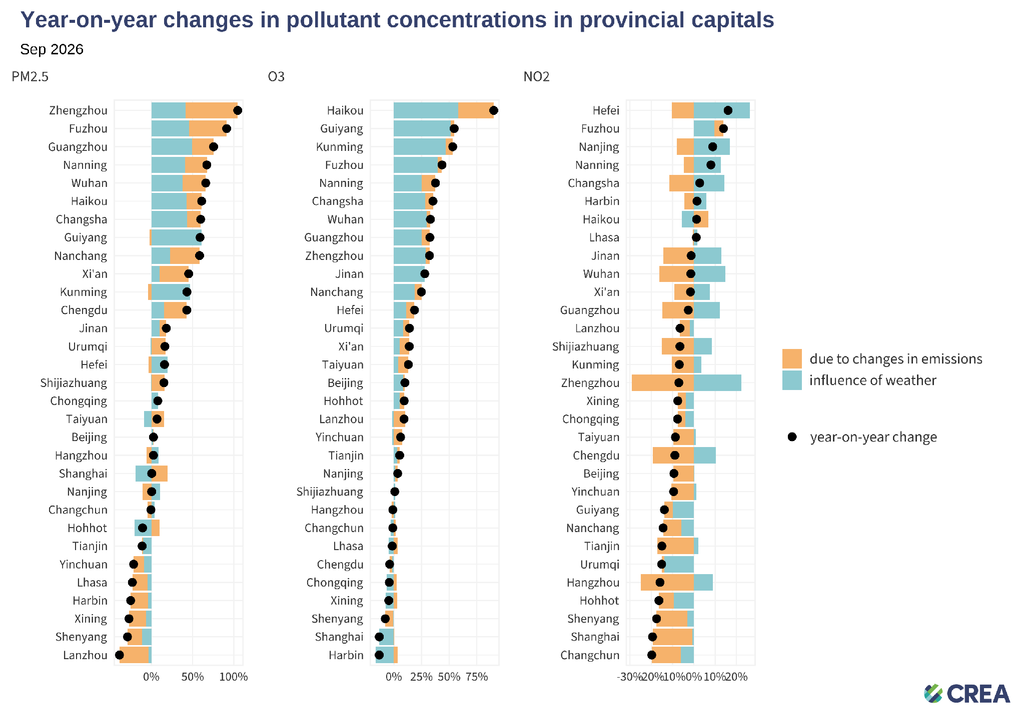
- Unfavourable weather and higher emissions both contributed to sharp PM2.5 rebounds across provincial capitals in September. The impact was most pronounced in Zhengzhou, where emissions contributed most strongly to higher PM2.5 concentrations.
- In Haikou, both unfavourable weather and rising emissions contributed to the largest year-on-year increase in ozone levels. Shanghai’s decline was mainly due to favourable weather.
- Lower emissions clearly contributed to declining NO2 levels across most provincial capitals. Only two cities—Fuzhou and Haikou—saw emissions contributing to higher NO2 concentrations. In some cities, unfavourable weather partly offset the benefits of emission reductions.
Worst 7-day air pollution episodes by pollutant
PM2.5 (excluding sandstorms)
| City | Province | Dates | Average concentration | Highest daily concentration |
|---|---|---|---|---|
| Handan | Hebei | Sep 19 – Sep 25 | 61.6778 | 75.0521 |
| Anyang | Henan | Sep 19 – Sep 25 | 61.0775 | 72.3968 |
| Hebi | Henan | Sep 19 – Sep 25 | 59.3041 | 77.9460 |
| Puyang | Henan | Sep 18 – Sep 24 | 58.0943 | 77.6250 |
| Liaocheng | Shandong | Sep 18 – Sep 24 | 57.8592 | 94.7361 |
Ozone
| City | Province | Dates | Average concentration | Highest daily concentration |
|---|---|---|---|---|
| Foshan | Guangdong | Sep 18 – Sep 24 | 188.2277 | 210.8125 |
| Tai’an | Shandong | Sep 13 – Sep 19 | 184.0446 | 207.0208 |
| Zibo | Shandong | Sep 14 – Sep 20 | 183.3482 | 209.4792 |
| Liaocheng | Shandong | Sep 18 – Sep 24 | 182.4286 | 227.8750 |
| Dongguan | Guangdong | Sep 18 – Sep 24 | 180.3155 | 228.5417 |
NO2
| City | Province | Dates | Average concentration | Highest daily concentration |
|---|---|---|---|---|
| Baotou | Inner Mongolia | Sep 18 – Sep 24 | 33.9757 | 50.6612 |
| Yangquan | Shanxi | Sep 11 – Sep 17 | 33.4392 | 36.1333 |
| Lanzhou | Gansu | Sep 21 – Sep 27 | 32.8887 | 40.7549 |
| Linyi | Shandong | Sep 11 – Sep 17 | 32.1772 | 44.4617 |
| Zhenjiang | Jiangsu | Sep 15 – Sep 21 | 31.9592 | 43.5808 |
Unit: µg/m3
Relevant analysis by CREA:
- China H1 2026 Air quality review: EV-related oil cuts emerge as a new driver for China’s clean air progress
- China’s air pollution control enters ‘deep water’ phase
- Why is China’s air pollution shifting west?
- China’s coal-to-chemicals growth risks climate goals
- Why China should get tougher on smog
- Carbon-intensive industries are worsening China’s ozone pollution