
The country’s traffic-related air pollution plummeted in H1, but continued coal pressure means long-term gains will require more effort.
By Qi Qin, China Analyst; Miao Chien, Data Scientist; with contributions from Lauri Myllyvirta, Lead Analyst
An aerial drone photo taken on July 6, 2026 shows the clouds scenery after rainfall at the Jinshanling section of the Great Wall at Luanping County of Chengde City, north China’s Hebei Province. Photo: Xinhua/Alamy
Key Findings
- China’s clean-air progress has entered a slower and more uneven phase. PM2.5 continued to decline after 2023, but the pace of improvement has slowed sharply compared with the earlier clean-air campaign period. Further gains are likely to be harder and more dependent on structural changes in energy, industry, and transport.
- Coal and transport electrification are pulling China’s air quality story in opposite directions. Coal-related activity remains a major pressure on PM2.5, especially now that earlier end-of-pipe control gains have narrowed. At the same time, electric vehicles (EVs) are displacing China’s need for oil at a growing scale, with avoided oil consumption reaching an estimated 33.7 Mtoe (Million Tonnes of Oil Equivalent) in H1 2026, roughly equivalent to 6% of China’s total crude oil imports in 2025, or about three weeks’ imports at the 2025 average pace.
- Urban nitrogen dioxide (NO2) pollution levels, which are closely linked to traffic emissions, saw a sharp 7% drop in the second quarter, after the Strait of Hormuz disruptions led to fuel price hikes and increases in EV usage, public transport, and car sharing.
- The Beautiful China 15th Five-Year Plan keeps air pollution control on the agenda, but national ambition remains modest. The strongest PM2.5 requirements are focused on key regions, while the national targets imply only incremental improvement by 2030. Ozone remains a policy gap, despite growing levels in warmer months.
- China’s stricter PM2.5 standard has exposed a larger compliance gap. Under the new 30 µg/m³ benchmark, 18 of 31 provincial capitals exceeded the standard in H1 2026, compared with 11 that exceeded the previous 35 µg/m³ benchmark in 2025.
- The 2030 target requires only a 4% reduction by 2030, even though achieving the 2035 target will require an overall decline of at least 11% from 2025 levels. This would leave most of the necessary progress until after 2030, when further reductions are likely to become increasingly difficult.
- If all cities met China’s new interim PM2.5 standard for 2030, roughly 156,000 air-pollution-related deaths per year could be avoided. With the stricter standard entering into force in 2031, this would nearly double to 300,000 avoided deaths per year.
- Northern cities saw the clearest PM2.5 rebound in H1 2026, largely due to unfavourable weather conditions. Shijiazhuang, Jinan, Beijing, and Tianjin saw some of the largest PM2.5 increases. Estimated emissions-related changes were negative in most provincial capitals, suggesting that pollution-control efforts continued to help, even though bad weather offset part of the progress.
- The three key air-pollution control regions faced different pressures. Jing-Jin-ji and surrounding areas saw a sharp winter-spring PM2.5 rebound. The Yangtze River Delta delivered the strongest PM2.5 improvement, but faced rising early-summer ozone pressure. The Fenwei Plain improved modestly but remained the highest-PM2.5 region among the three.
Provincial capital scorecard: stricter rules expose more gaps
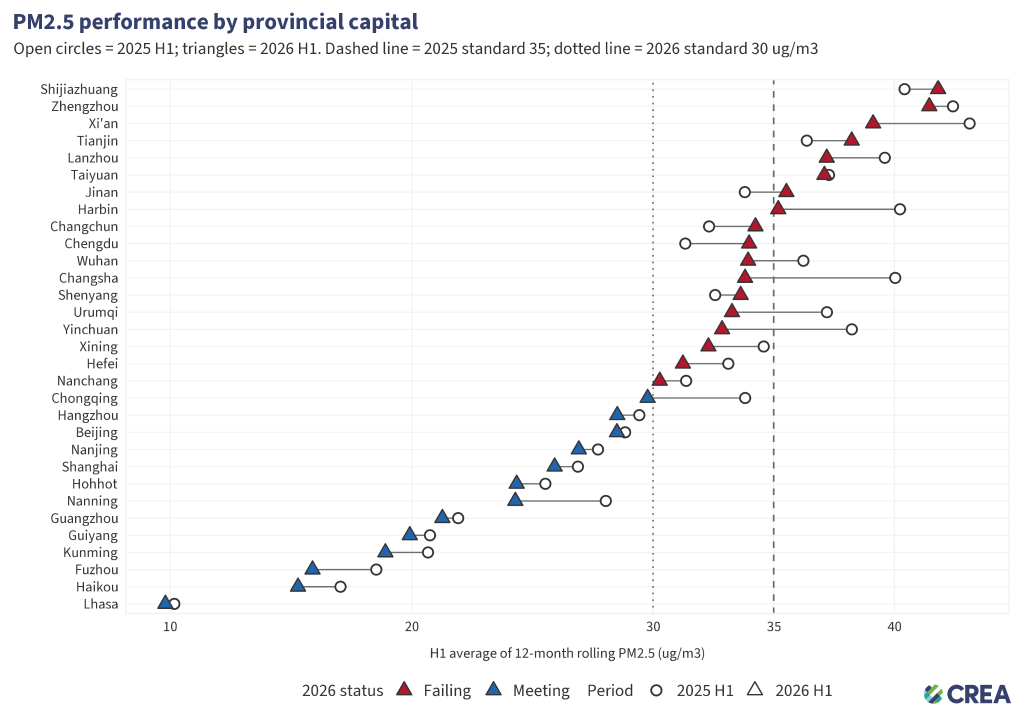
The stricter PM2.5 benchmark, which came into effect in March 2026, exposes a wider compliance gap among provincial capitals. Based on average 12-month rolling PM2.5 concentrations in H1 2026, 18 of China’s 31 provincial capitals exceeded the new 30 µg/m³ standard, compared with 11 capitals that exceeded the previous 35 µg/m³ benchmark in 2025.
This does not mean air quality has simply deteriorated year-on-year, since part of the increase reflects the lower threshold. However, among the 18 cities above the new standard, six also recorded higher PM2.5 levels than a year earlier, pointing to real setbacks in some places.
The gap is concentrated in northern, inland and coal- or industry-adjacent cities. Shijiazhuang, Zhengzhou, Xi’an, Taiyuan, Lanzhou and Jinan remained among the higher-PM2.5 provincial capitals, while Lhasa, Haikou, Fuzhou, Kunming and Nanning were among the lowest.
If all cities meet China’s current PM2.5 interim standard 30 µg/m³, an estimated 156,000 air-pollution-related deaths could be avoided each year (95% confidence interval: 107,000–206,000). If all cities meet the stricter annual limit of 25 µg/m³, which takes effect in 2031, the number of avoided deaths could rise to 300,000 per year (206,000–416,000).
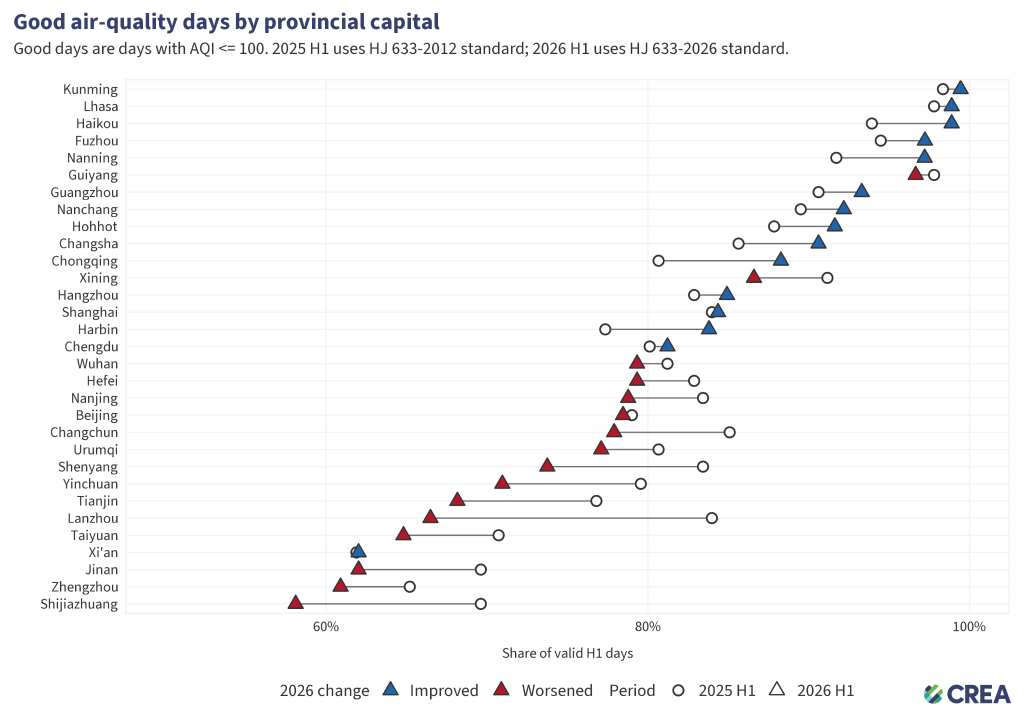
The broader AQI scorecard also points to limited progress. Across provincial capitals, the share of good-air-quality days fell from 83.1% in H1 2025 to 81.4% in H1 2026, with 16 capitals worsening and 15 improving.
The largest improvements include Chongqing, Harbin, Nanning, Changsha and Haikou, while the largest declines include Lanzhou, Shijiazhuang, Shenyang, Tianjin and Yinchuan.
The category mix was not uniformly negative: excellent days increased from 25% to 28%, while heavy and severe pollution days declined. However, the share of light-pollution days rose from 14% to 16%, reducing the overall good-air-day share.
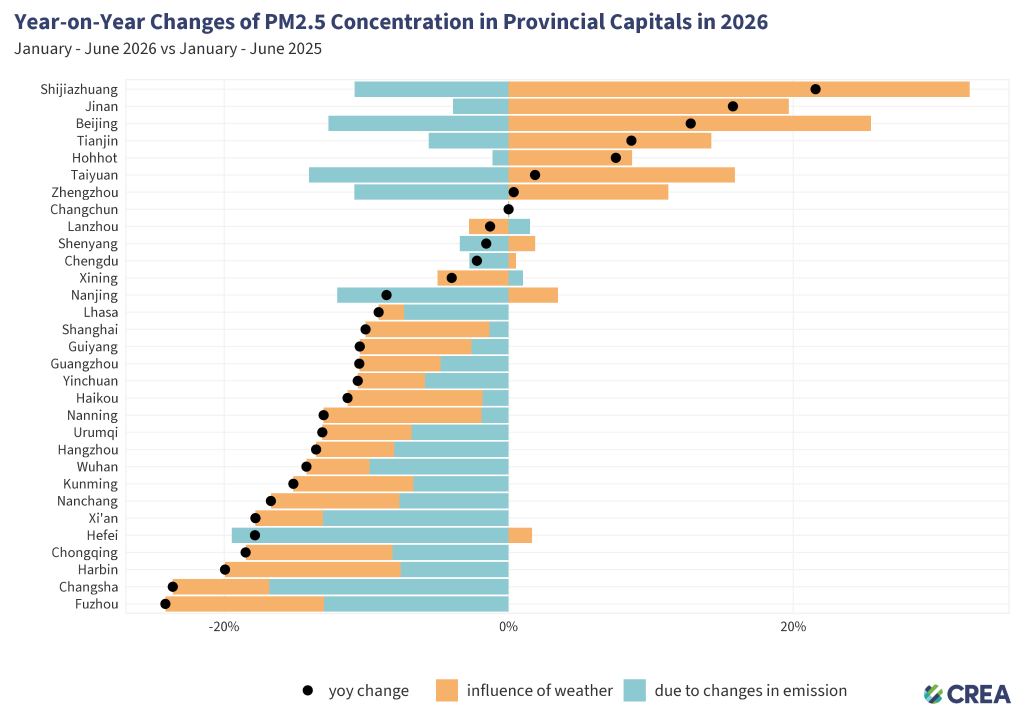
PM2.5 levels fell in most provincial capitals in H1 2026, but seven northern cities saw a rebound. The largest increases were concentrated in northern cities, led by Shijiazhuang (+21.6%), Beijing (+12.8%), Tianjin (+8.6%), and Hohhot (+7.5%).
Weather was the main driver behind these rebounds. In all seven cities where PM2.5 increased, meteorological conditions pushed pollution levels higher, while the estimated emission-related effect was negative. Across the 31 provincial capitals, 28 cities showed emissions-related improvements, suggesting that underlying pollution-control efforts continued to make progress.
However, the rebound also shows the limits of incremental gains. When weather conditions are unfavourable, modest emissions reductions may no longer be enough to prevent PM2.5 from rising.
PM2.5 fell sharply in Fuzhou (-24.1%), Changsha (-23.6%), Harbin (-19.9%), Chongqing (-18.5%), Hefei (-17.8%), and Xi’an (-17.8%). In many of these cases, less emissions and favourable weather worked in the same direction.
Key Regions: divergent seasonal pollution pressures
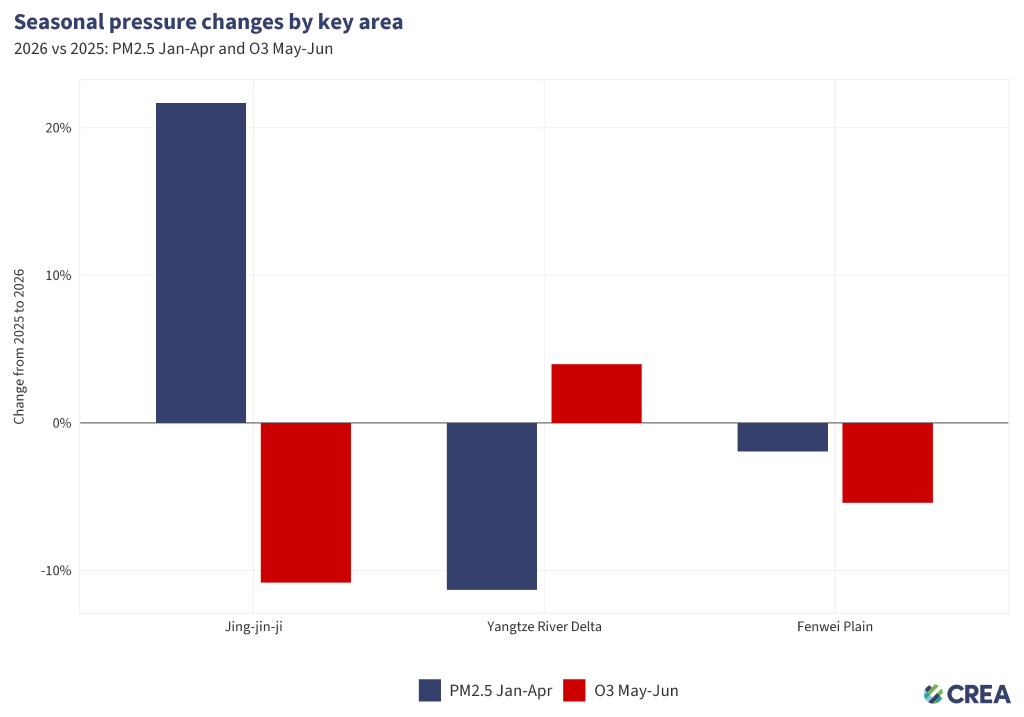
PM2.5 pollution was concentrated in winter and early spring, while ozone became more relevant as temperatures rose in May and June. The three key regions faced different challenges in the first half of 2026. Jing-Jin-Ji and surrounding area capitals saw a winter-spring PM2.5 rebound. The Yangtze River Delta made the strongest PM2.5 improvement but faced rising early-summer ozone. The Fenwei Plain improved in the latter part of the half-year but remained the region with the highest PM2.5 levels.
In the capital cities of Jing-Jin-Ji and surrounding areas, PM2.5 increased sharply in the first four months of 2026. Average concentrations in January-April were 21.7% higher than a year earlier. The rebound was strong in March, when PM2.5 reached 63.9µg/m³, compared with 42.7µg/m³ in March 2025. Conditions improved in May and June, with PM2.5 falling below 2025 levels. But this was not enough to offset the earlier rebound. For H1 as a whole, average PM2.5 still rose 9.3%, from 37.8µg/m³ to 41.4µg/m³. Ozone moved in the opposite direction, with May-June ozone falling 10.8% year-on-year.
The Yangtze River Delta capitals showed the strongest PM2.5 improvement among the three regions. H1 average PM2.5 declined 10.2%, from 34.1µg/m³ in 2025 to 30.7µg/m³ in 2026. But ozone moved in the opposite direction as temperatures rose. May-June ozone increased 4% year-on-year, suggesting that ozone pollution became more difficult to control even as PM2.5 continued to improve.
The Fenwei Plain capitals also improved, with H1 average PM2.5 falling 7.8%, from 45µg/m³ to 41.5µg/m³. Even so, it remained the most PM2.5-polluted of the three key regions. Ozone also eased earlier in the summer, with May-June levels down 5.4% year-on-year, although concentrations were still elevated by June.
From rapid reductions to slower progress
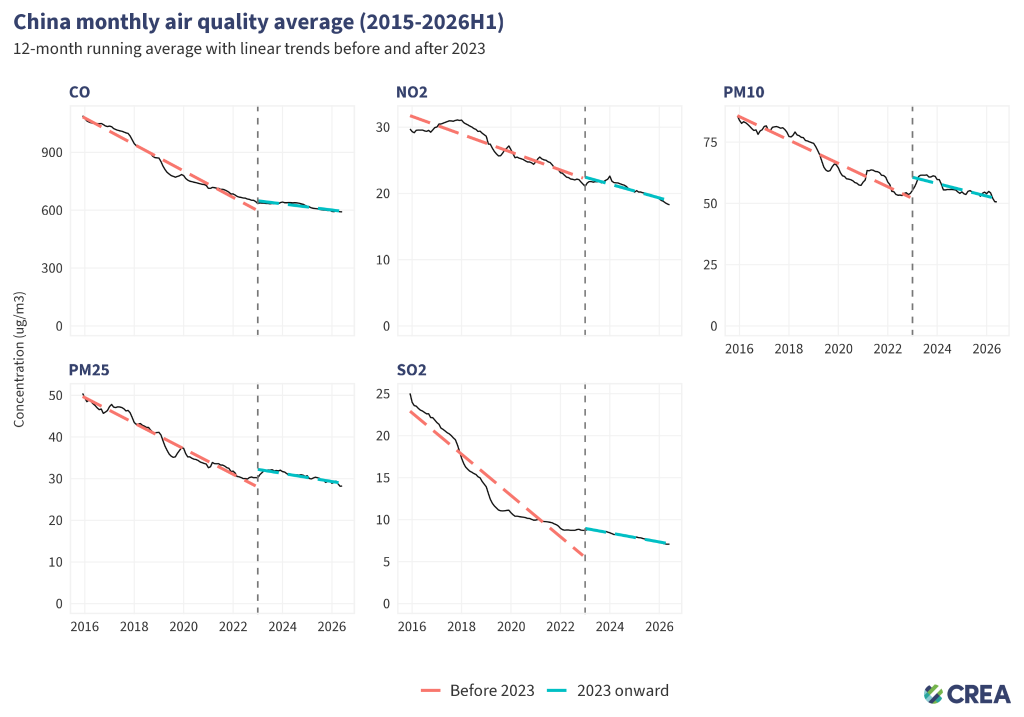
China’s air quality has improved substantially since 2015, but the pace of improvement has slowed since 2023. The 12-month running averages for major pollutants show steep reductions during the earlier phase of clean-air action, followed by much flatter trend lines in the past three-and-a-half years.
The slowdown is most obvious for PM2.5. On a 12-month running-average basis, PM2.5 concentrations fell by an average linear trend of 3.1 µg/m³ per year from late 2015 to the end of 2022. Since 2023, the decline has slowed to around 1 µg/m³ per year. PM2.5 continued to improve, but the rate of progress was much slower than during the earlier clean-air campaign period. Other pollutants also show a similar pattern.
The post-2023 trends suggest that China has moved from a phase of rapid, broad-based reductions to one in which further gains are harder and more incremental. Further PM2.5 reductions will depend less on one-off control upgrades, and more on deeper structural changes in energy, industry, and transport.
Structural drivers: coal pressure and EV-driven oil displacement
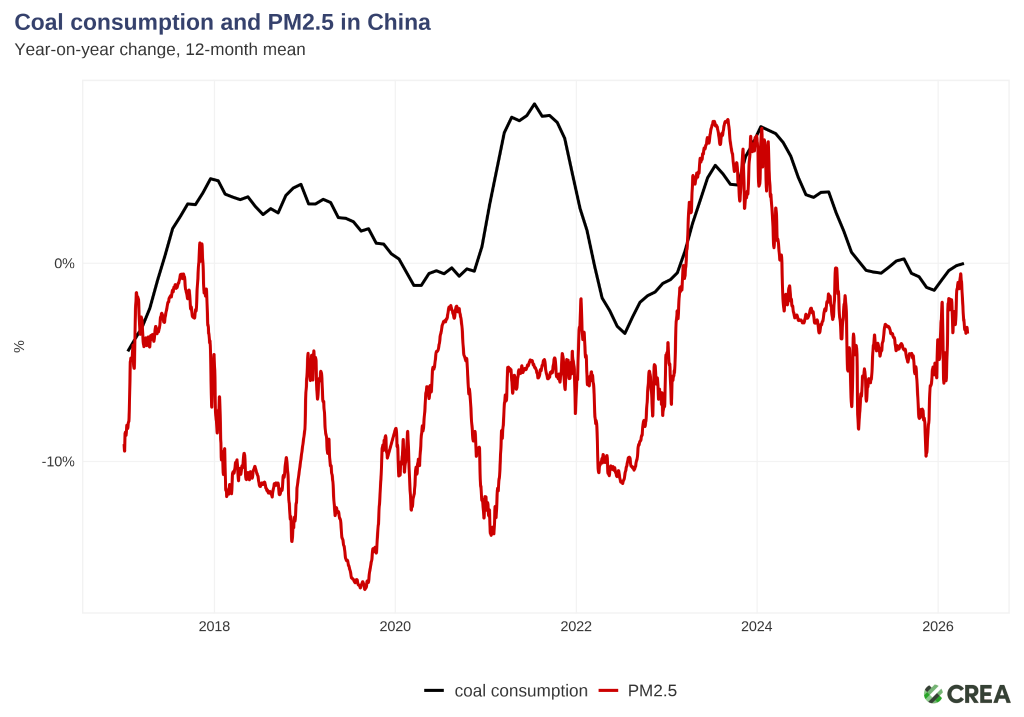
Coal is still one of the biggest pressures on China’s clean-air progress. PM2.5 levels are also shaped by weather, transport, industrial activity, and pollution-control measures. But in recent years, changes in coal consumption and PM2.5 have become more closely linked than they were during the earlier years of China’s clean-air campaign.
In the late 2010s, China was still able to cut PM2.5 sharply even when coal consumption was flat or rising. Between 2017 and 2019, coal consumption grew by around 2% year-on-year over 12 months, while PM2.5 fell by about 8% over the same period. China was still harvesting big gains from replacing small coal boilers, tightening industrial controls, and installing pollution-control equipment.
Since 2023, coal consumption has rebounded at times, and PM2.5 has become more vulnerable to that pressure, especially in late 2023 and early 2024. This coincided with China’s post-pandemic economic recovery and a wave of new coal power capacity coming online, particularly in the second half of 2023. PM2.5 improved again in 2025 and early 2026 as coal consumption growth slowed, but the gap between the two has not returned to the level seen in the earlier years. The space for easy PM2.5 reductions has narrowed. Earlier pollution-control upgrades have already delivered most of their benefits, and now bad weather can quickly erase part of the progress.
To keep PM2.5 falling, China will need deeper and more sustained reductions from the main coal-consuming sectors, especially power generation, heating, coal chemicals, and other heavy industries.
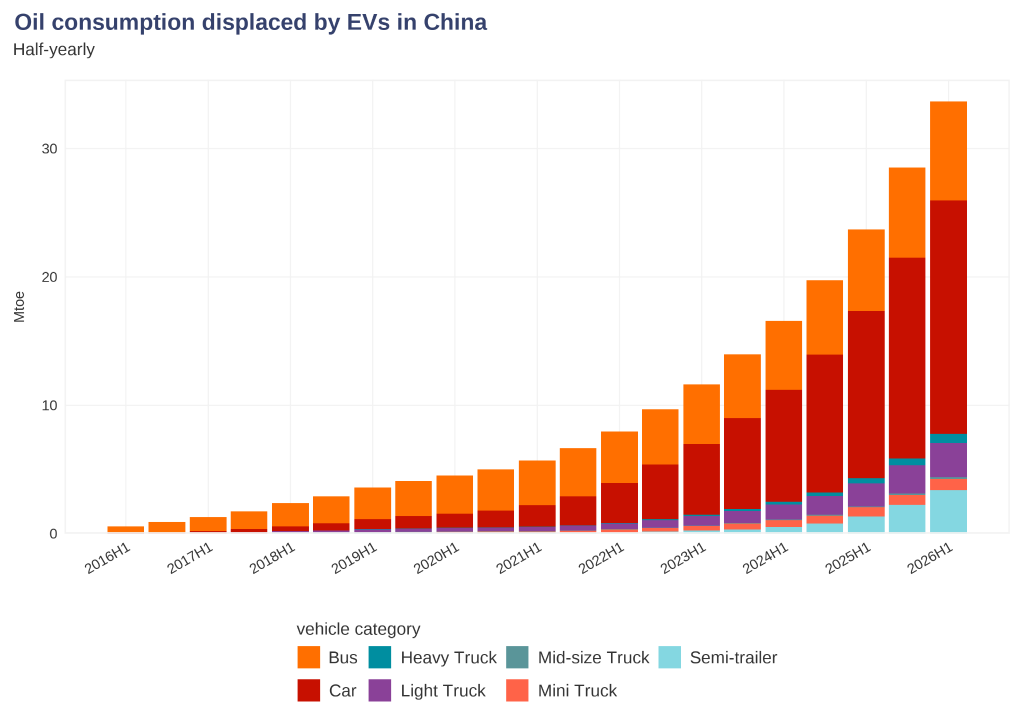
Transport electrification is the other side of China’s clean air story. While coal consumption is still a major source of pressure, the rapid growth of electric vehicles is now cutting into oil demand in a visible way. What was once a small effect in the mid-2010s has become large enough to matter.
In H1 2026, EVs displaced an estimated 33.7 Mtoe of oil consumption, up 42% from 23.7 Mtoe in 2025. The scale-up has been particularly rapid since 2023, when EV-driven oil displacement stood at 11.6 Mtoe in H1. In just three years, the volume has nearly tripled. The fossil fuel displaced by EVs in the recent six months was roughly equivalent to 6% of China’s total crude oil imports in 2025, around 22 days of imports at last year’s average rate.
Passenger cars are the largest driver. In H1 2026, electric passenger cars displaced 18.2 Mtoe, accounting for 54% of total EV oil displacement. Commercial vehicles are also becoming important. The fastest growth came from freight vehicles: oil displacement from electric semi-trailers rose by about 150% year-on-year in H1 2026.
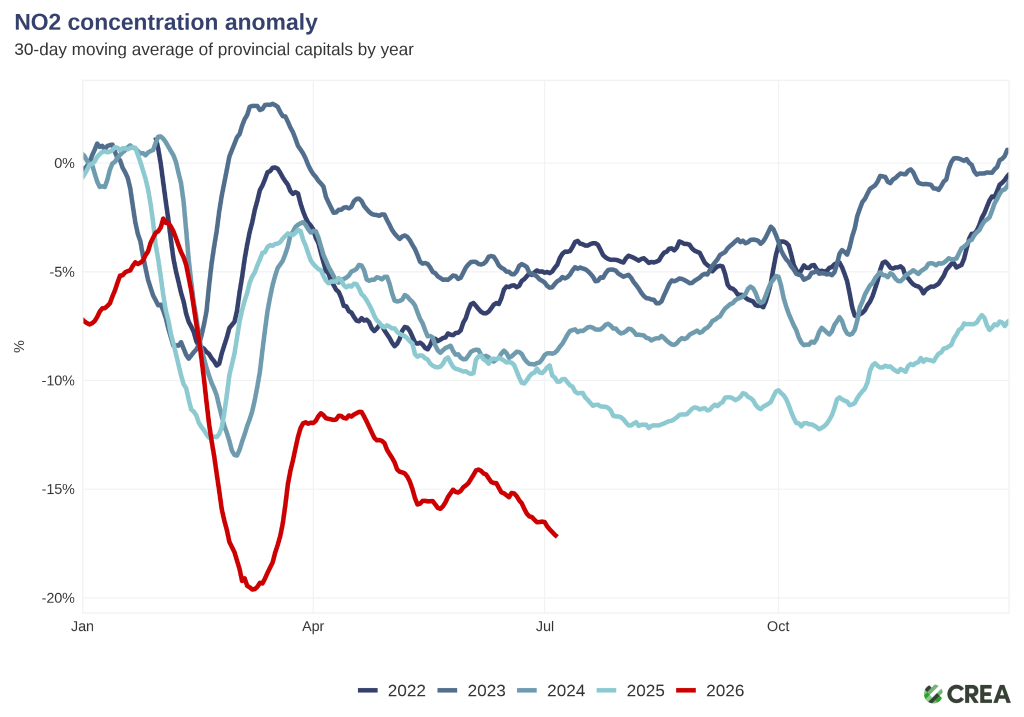
EVs reduce gasoline and diesel combustion, with the clearest benefits for transport-related NOx, primary particles and urban roadside exposure. In H1 2026, average NO2 concentrations in provincial capitals were about 6.2% lower than in H1 2025 and 7.3% below the 2022-2025H1 average. Urban NO2 pollution levels saw a sharp 7% drop in the second quarter, after the Strait of Hormuz disruptions led to fuel price hikes and increased uptake in EV usage, public transport, and car sharing. Industrial activity, weather, and power sector emissions all affect NO2. But as more petrol and diesel consumption is avoided, transport electrification is becoming harder to ignore in the clean air story.
As China’s PM2.5 improvement curve flattens, further clean air gains will depend more on structural change: cutting coal-related emissions on one side, and reducing petrol and diesel combustion on the other.
Beautiful China Plan raises regional stakes but leaves national ambition modest
The newly released Beautiful China 15th Five-Year Plan confirms that China will continue to prioritise air pollution control. Its strongest PM2.5 requirements are concentrated in the three key regions: Jing-Jin-Ji and surrounding areas, the Yangtze River Delta, and the Fenwei Plain. National-level PM2.5 ambition is comparatively modest, and ozone remains a policy gap.
The 2030 national target requires only a 4% reduction of PM2.5 by 2030, even though achieving the 2035 target will require an overall decline of at least 11% from 2025 levels. This would leave most of the necessary progress until after 2030, when further reductions are likely to become increasingly difficult.
If all the cities can meet the current standard of 25 µg/m³ by the end of 2030, China’s nationwide average PM2.5 concentration would fall by at least 22%, far more than the 4% reduction targeted in the country’s Beautiful China five-year plan.
What the new Beautiful China plan means for air quality
| Policy signal | Why it matters |
| National PM2.5 target: reduce from 28 µg/m³ in 2025 to 27 µg/m³ by 2030 | National ambition is incremental, especially compared with China’s earlier PM2.5 reductions. |
| Good-air-quality days: from 83.6% in 2025 to 85% by 2030 | The plan aims for only modest national improvement in day-to-day air quality. |
| Key region PM2.5 cuts: 15%, 10%, 15% by 2030 | The strongest PM2.5 mandates are concentrated in Jing-Jin-Ji and surrounding areas, the Yangtze River Delta, and the Fenwei Plain. |
| Coal control in key regions | The plan keeps coal reduction central to regional PM2.5 policy. |
| No ozone concentration target | Ozone remains a policy gap despite NOx and VOC (Volatile Organic Compounds) reduction targets. |
| Clean transport share in key industries: 75% nationwide, 85% in key regions | The plan links transport electrification to air-quality policy. |