
Russia’s fossil fuel export earnings fell 1% in June; meanwhile, France’s LNG imports climbed 34%
Authors: Luke Wickenden and Isaac Levi; Data scientist: Panda Rushwood
Key findings
- In June 2026, Russia’s fossil fuel export revenues fell by 1% month-on-month to EUR 734 mn per day, even as export volumes rose 7%.
- Russia’s crude oil export revenues fell 8% month-on-month, while export volumes increased 14%. The rise in export volumes was driven by a 68% month-on-month increase in crude loadings at the Black Sea port of Novorossiysk, offsetting declines of 10% at Ust-Luga and 9% at Primorsk, Russia’s Baltic ports.
- Ukraine’s sustained drone attacks on Russian refineries have sharply disrupted oil product exports, with June seaborne loadings falling 21% month-on-month to a record low amid domestic fuel shortages and a temporary jet fuel export ban.
- In June, the EU’s imports of Russian LNG dropped a mere 5% month-on-month; however, they remained 14% above June 2025 levels. France’s imports of Russian LNG increased by 34% month-on-month, despite a 35% decrease in total unloaded LNG.
- Despite the EU’s ban on imports of oil products made from Russian crude, eight shipments of oil products from refineries using Russian crude were unloaded at EU ports in June.
- Refineries in India, Turkiye, Brunei, and Georgia that use Russian crude exported EUR 814 mn of oil products to sanctioning countries in June 2026.
- India’s imports of Russian crude oil reached a record high, rising 34% month-on-month. India purchased EUR 4.5 bn of Russian crude in June.
- In June 2026, 54% of Russia’s seaborne oil was transported by ‘shadow’ tankers under sanctions. A further 43% of the volume was transported by G7+ tankers. The remainder was transported by non-sanctioned ‘shadow’ tankers.
- In June, 15 new vessels entered the Russian oil trade; twelve of these tankers were owned or insured by the G7+ at the time of loading.
- In June 2026, 45 ‘shadow’ vessels transporting Russian fossil fuels were operating under false flags at the end of the month.
- After becoming the second-largest flag registry for sanctioned Russian tankers, Cameroon has begun deregistering vessels, reducing the total from 143 at the end of March 2026 to 116 by June 2026.
Trends in total export revenues
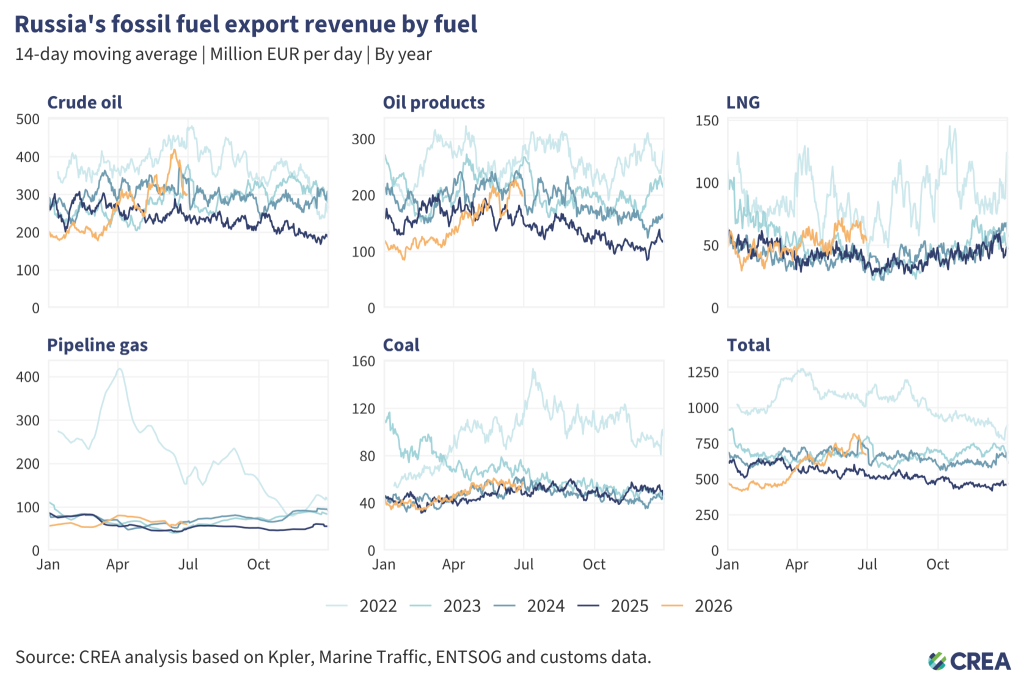
- In June 2026, Russia’s fossil fuel export revenues fell by 1% month-on-month to EUR 734 mn per day, even as export volumes rose 7%.
- Russia’s crude oil export revenues fell by 8% month-on-month to EUR 348 mn per day, while volumes increased by 14%. The increase in loadings was concentrated at Russia’s Black Sea port of Novorossiysk, where crude loadings jumped 68% month-on-month, even as loadings at its Baltic ports of Ust-Luga and Primorsk fell by 10% and 9%, respectively.
- In June, Russian pipeline crude oil export revenue fell by 10% month-on-month.
- Revenue from seaborne oil product exports unloaded at their destination ports increased 14% month-on-month to EUR 211 mn per day, the highest daily export revenue since June 2024. However, oil product loadings at Russian ports in June fell sharply by 21% month-on-month, pointing to weaker oil product revenues ahead. In June, Russia’s seaborne oil product loading volumes hit their lowest level on record. Tuapse, which saw a sustained campaign of drone strikes in May, has seen product loadings fall to zero in June. Ukraine’s drone strikes have reduced Russia’s refining capacity, triggering domestic fuel shortages that forced a temporary jet fuel export ban imposed in early June.
- Liquefied natural gas (LNG) export revenues increased by 9% to EUR 60 mn per day while export volumes rose 7% month-on-month.
- Pipeline gas export revenues decreased by 11% to EUR 60 mn per day, while export volumes dropped 3% month-on-month.
- Coal export revenues fell by 2% month-on-month to EUR 56 mn per day, while export volumes fell by 3%.
Who is buying Russia’s fossil fuels?
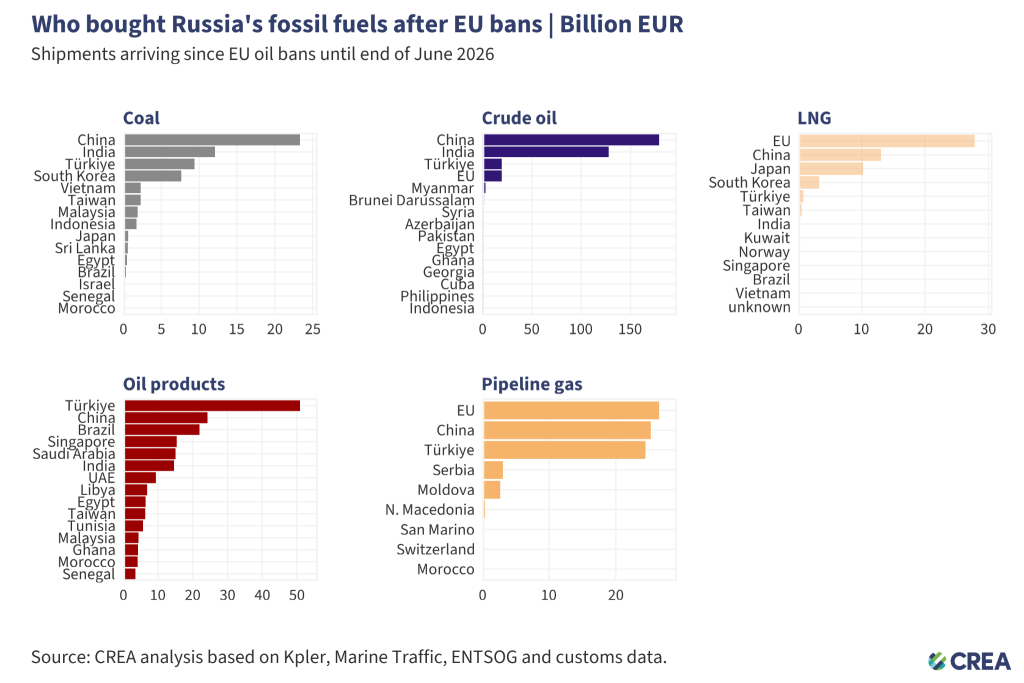
- Russia’s fossil fuel exports remain highly concentrated, with China dominating purchases of coal and crude oil, Turkiye leading purchases of oil products, and the EU remaining the largest buyer of LNG and pipeline gas — showing Moscow’s dependence on a narrow set of key customers.
- Coal: From 5 December 2022 until the end of June 2026, China purchased 37% of all Russian coal exports. India (19%), Turkiye (15%), South Korea (12%), and Vietnam (4%) round out the top five buyers’ list.
- Crude oil: China has bought 50% of Russia’s crude exports, followed by India (36%), Turkiye (6%), and the EU (6%).
- Oil products: Turkiye, the largest buyer, has purchased 26% of Russia’s oil product exports, followed by China (13%), Brazil (11%), and Singapore (8%).
- LNG: The EU remains the largest buyer of Russian LNG, accounting for almost half (49%) of Russia’s total LNG exports, followed by China (23%), and Japan (18%).
- Pipeline gas: The EU is the largest buyer, purchasing 32% of Russia’s pipeline gas exports, followed by China (31%), and Turkiye (30%).
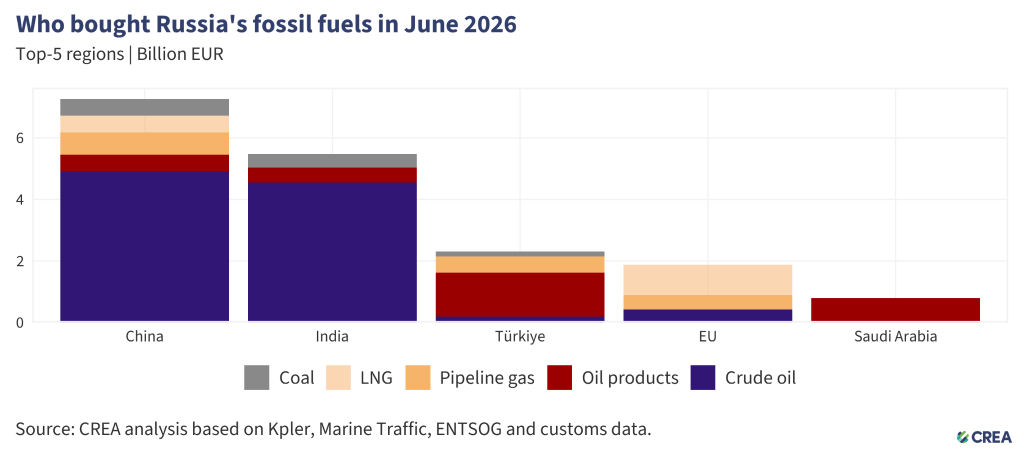
- In June 2026, China remained the largest global buyer of Russian fossil fuels, accounting for 41% (EUR 7.3 bn) of Russia’s export revenues from the top five importers. Crude oil accounted for 68% (EUR 4.9 bn) of China’s purchases, followed by pipeline gas (EUR 732 mn), coal (EUR 546 mn), and oil products (EUR 543 mn). LNG (EUR 539 mn) constituted the remainder of China’s imports.
- China’s total seaborne crude import volumes saw a 16% month-on-month decrease in June. China’s total seaborne crude oil imports continued to decline, with June imports 46% lower than in June 2025. Imports of Russian seaborne crude increased 8.7% month-on-month. The vast majority (62%) of China’s seaborne Russian crude imports were East Siberia–Pacific Ocean (ESPO) grade, shipped from the Pacific port of Nakhodka. China also saw a 121% increase in imports of Sokol-grade crude oil from Russia’s Pacific port of De Kastri.
- Russian imports by Chinese installations rose in June. Much of the increase was driven by the Rizhao installation, which saw its Russian imports increase more than fourteenfold month-on-month, reaching the highest level in the past three years.
- India was the second-largest buyer of Russian fossil fuels in June 2026, importing a total of EUR 5.5 bn of Russian hydrocarbons. Crude oil constituted 83% of India’s purchases, totalling EUR 4.5 bn. Oil products (EUR 488 mn) and coal (EUR 444 mn) constituted the remainder of their monthly Russian imports.
- India’s total crude import volumes recorded a 5.4% month-on-month increase in June 2026. India’s imports of Russian crude oil reached the highest level on record in June 2026, rising 34% month-on-month. The Jamnagar refinery saw the largest month-on-month rise in imported volumes of Russian crude (150% month-on-month increase), followed by the Paradip (126%), Kochi (83%), and Vadinar (45%) refineries.
- Turkiye was the third-largest importer, purchasing EUR 2.3 bn of Russian hydrocarbons in June. Oil products accounted for the largest share at 62% (EUR 1.4 bn), followed by pipeline gas (EUR 523 mn), and crude oil (EUR 196 mn). The remainder of Turkiye’s monthly imports from Russia consisted of coal (EUR 165 mn).
- In June 2026, Turkiye’s total seaborne crude imports saw a 5% month-on-month decrease, while imports from Russia fell 4%. The STAR refinery and the Tupras Izmit refinery were the only two installations to unload shipments of Russian crude in June 2026.
- Diesel accounted for half of Turkiye’s imports of Russian oil products; most of these diesel shipments departed from Russia’s Baltic Sea port of Primorsk.
- The EU was the fourth-largest buyer of Russian fossil fuels, accounting for almost 11% (EUR 1.9 bn) of Russia’s export revenues from the top five importers in June.
- Fifty-two percent of the EU’s imports (EUR 993 mn) consisted of LNG, 25% consisted of pipeline gas. The remaining 22% consisted of crude oil transported through the Druzhba pipeline to Hungary and Slovakia.
- In June, the EU’s imports of Russian LNG dropped a mere 5% month-on-month; however, they increased 14% year-on-year. The EU’s LNG imports usually drop in the summer months as warmer weather lowers natural gas demand. France was the EU Member State that reported the largest increase in Russian LNG shipments, which rose 34% month-on-month.
- EU imports of Russian LNG in June remained above their June 2025 level, underscoring the need for strict enforcement and transparency to ensure the EU’s ban on short-term Russian LNG supply contracts, which took effect on 25 April 2026, is not undermined by higher imports under legacy contracts. Under the REPowerEU regulation, Russian LNG imports remain permissible if the underlying short-term supply contracts were concluded before 17 June 2025.
- Saudi Arabia was the fifth-largest importer of Russian fossil fuels in June, purchasing EUR 799 mn, all of which consisted of oil products. While the Jizan Refinery saw an 82% month-on-month decrease in imports of Russian oil products, this was offset by increased Russian imports to the Jeddah South Power Plant and the Shuqaiq Steam Power Plant.
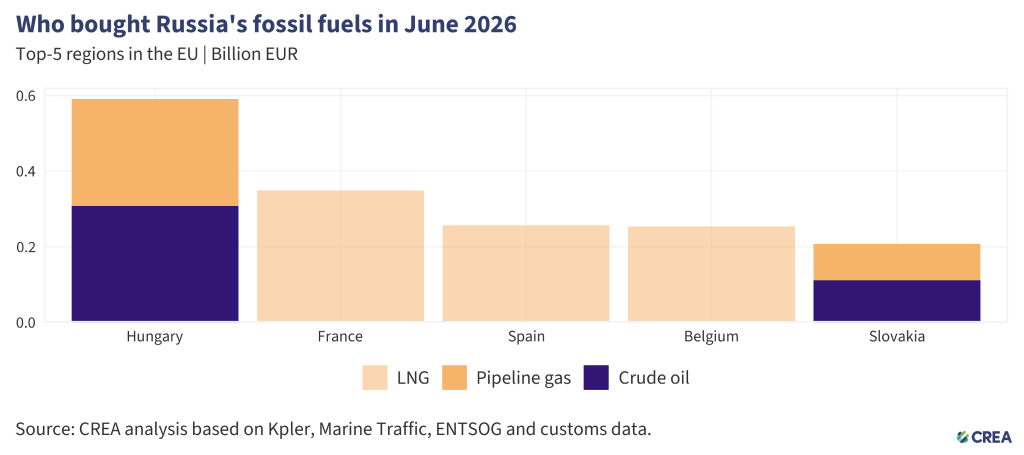
- In June 2026, the five largest EU importers of Russian fossil fuels paid Russia a combined EUR 1.7 bn. Natural gas (pipeline and LNG) — partially sanctioned by the EU — accounted for 75% of the value of imports from the five largest buyers. The five largest EU importers purchased EUR 861 mn of Russian LNG in June, EUR 379 mn of pipeline gas, and EUR 421 mn of crude oil through the Druzhba pipeline.
- Hungary and Slovakia received EUR 379 mn in pipeline gas via the Balkan Stream pipeline.
- Hungary was the EU’s largest buyer, importing EUR 591 mn of Russian fossil fuels. In June, Hungary’s imports of Russian fossil fuels consisted of pipeline gas and crude oil.
- France was the EU’s second-largest importer, purchasing EUR 349 mn worth of Russian LNG in June. France’s imports of Russian LNG increased by 34% month-on-month, despite a 35% decrease in total unloaded LNG. The French port of Montoir observed a fourfold increase in Russian LNG shipments in June compared to May 2026.
- Spain was the third-biggest importer, receiving EUR 258 mn of Russian fossil fuels, all of which was LNG. Total LNG imports decreased by 33% month-on-month, broadly in line with Spain’s 38% drop in Russian LNG unloadings. The Cartagena installation did not unload any Russian LNG cargoes in June, after receiving its first shipment in a year and a half in May.
- Belgium was the bloc’s fourth-largest importer of Russian hydrocarbons, unloading EUR 254 mn of Russian LNG in June. Belgium’s LNG imports from Russia decreased by a marginal 3% month-on-month. Meanwhile, its total LNG unloadings dropped by a higher proportion of 26% month-on-month.
- Slovakia was the fifth-largest EU importer, receiving EUR 208 mn in Russian fossil fuel imports. Their June imports consisted of EUR 96 mn in pipeline gas purchases and EUR 112 mn in crude oil imports via the Druzhba pipeline.
- Despite the EU’s ban on imports of oil products made from Russian crude, which came into force on 21 January 2026, eight shipments of oil products from refineries using Russian crude — identified as high risk according to EU guidance — were unloaded at EU ports in June.
- Four of these shipments departed from Turkiye’s refineries, while two originated in India and another two in Georgia.
- In June, France and Italy unloaded two shipments each from these refineries, which were running on Russian crude. Meanwhile, Bulgaria, Belgium, Cyprus and Malta each received one shipment.
- Enforcement agencies in Member States must investigate shipments of oil products imported from refineries that run on Russian crude to prevent Russian oil molecules from entering the bloc, which would violate the EU’s recently implemented ban.
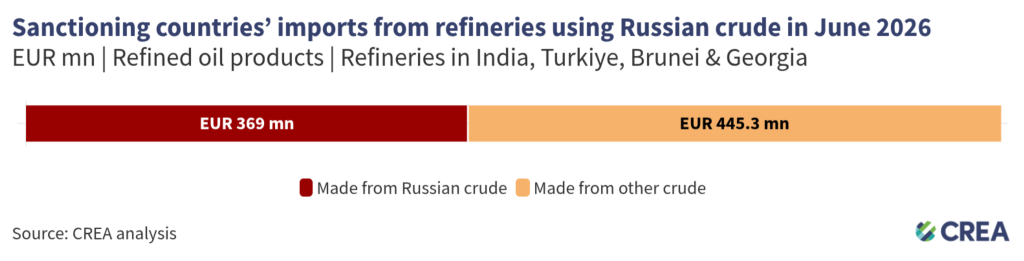
- Refineries in India, Turkiye, Brunei, and Georgia that use Russian crude exported EUR 814 mn of oil products to sanctioning countries in June 2026. The importers included the EU (EUR 225 mn), Australia (EUR 424 mn), and the US (EUR 165 mn). An estimated EUR 369 mn of these products were refined from Russian crude.
- There was a marginal 2% month-on-month increase in exports of oil products from these refineries to sanctioning countries.
- Exports of oil products to the EU from refineries running on Russian crude dropped 9% in value terms month-on-month, while those to Australia rose 75% month-on-month.
- In June 2026, the UK unloaded its first shipment of jet fuel produced at India’s Jamnagar refinery following the UK Government’s exemption allowing imports of diesel and jet fuel refined from Russian crude oil. The cargo, valued at approximately EUR 63 mn, was unloaded at the ports of Thames Haven and the Isle of Grain.
- Exports to the US originated at the Jamnagar refinery in India, the SOCAR-owned STAR refinery in Turkiye, and the Tupras Izmit refinery as well. In the prior three months, 60% of the Tupras Izmit refinery’s crude oil feedstock and 27% of the Jamnagar refinery’s feedstock came from Russia.
- The Kulevi refinery in Georgia continues to run solely on Russian crude and has not received a single shipment of non-Russian crude, while also exporting refined products to the EU after the ban came into force. At the end of March, the CEO of the refinery’s operating company stated that they are working to replace Russian crude oil. Additionally, the Georgian port of Kulevi has stated that it will no longer accept Russian oil as of August or September this year. Despite this commitment to end reliance on Russian crude, 100% of the refineries’ imports came from Russia in June 2026. Furthermore, the refinery narrowly escaped being added to the EU sanctions list in March.
How are oil prices changing?
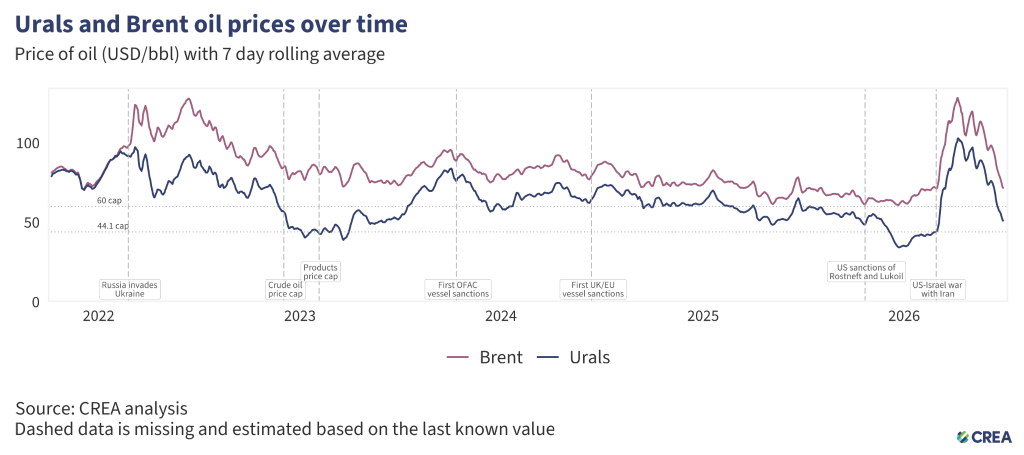
- In June 2026, the average price of Russia’s Urals crude fell by 26% month-on-month to USD 63.18 per barrel, still significantly higher than the EU and UK price cap of USD 44.1 per barrel, which took effect on 1 February 2026. As tanker traffic transporting fossil fuels through the Strait of Hormuz has increased significantly in June, oil prices declined amid market reassessment of the likelihood of sustained disruptions to oil flows.
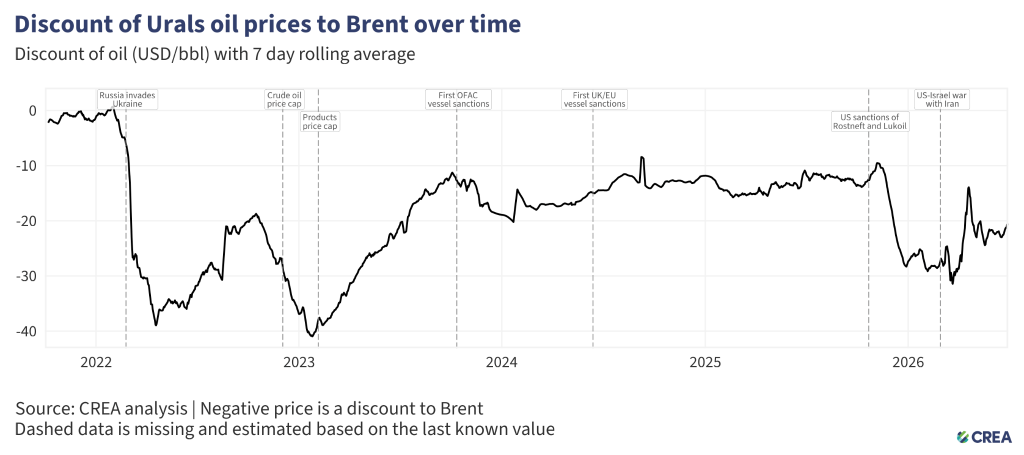
- In June, the price discount of Urals-grade crude oil relative to the global benchmark Brent remained flat at 28%, or USD 24 per barrel.
| Notice: On 19 May 2026, we modified our pricing model for Urals crude oil with an aim to estimate free-on-board (FOB) value instead of over-the-counter (OTC) and contract for difference (CFD) financial instruments. This provides more accurate estimates of therevenues Russia receives from Urals crude exports. The new model lowered CREA’s estimate of Russia’s Urals crude revenue by 7.0% (11.6 EUR bn)1. While the previous model was not designed to estimate FOB values, the new model aligns much more closely with FOB market sources, reducing the mean absolute percentage error (MAPE) from 18% to 5.2% and reducing the mean signed deviation (MSD) from 9.3 USD/bbl to 0.1 USD/bbl.2 1. Figures are based on an internal review dated 13 May 2026 and may differ slightly from the final published estimates. 2. When compared to market FOB market sources between April 2025 and March 2026. |
Sanctioned tankers carry the majority of Russian crude despite G7+ sanctions
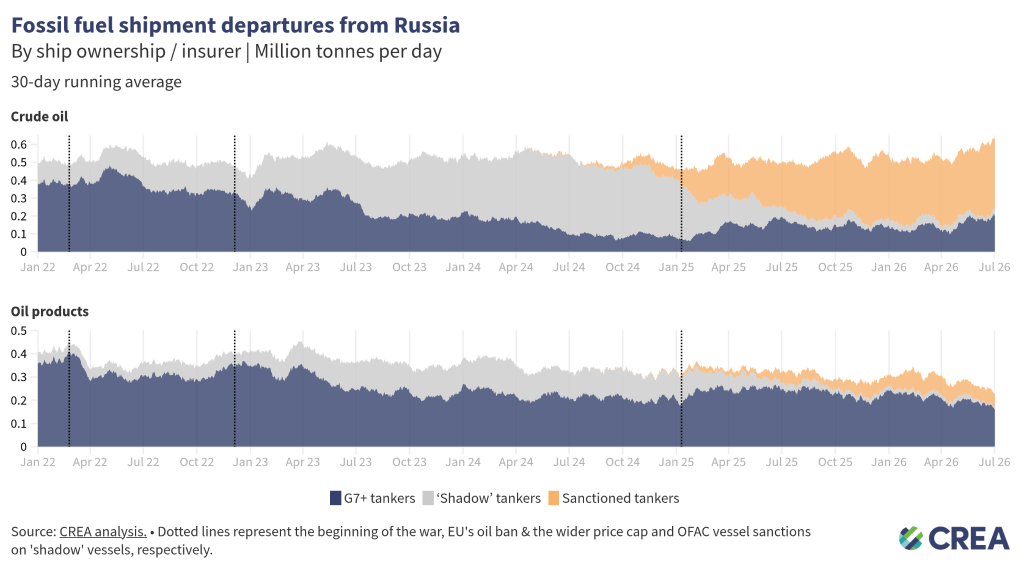
- In June 2026, 54% of Russia’s seaborne oil was transported by ‘shadow’ tankers under sanctions. A further 43% of the volume was transported by G7+ tankers. The remainder was transported by non-sanctioned ‘shadow’ tankers.
- G7+ tankers transported 31% of Russian crude oil exports in June, while non-sanctioned ‘shadow’ tankers accounted for 3% of the total. The largest share, 66%, was carried by sanctioned ‘shadow’ tankers.
- For oil products, Russia’s dependence on G7+ tankers is higher; these tankers transported 73% of Russian oil products in June. Sanctioned ‘shadow’ tankers carried 24% of total Russian oil product volumes, while non-sanctioned ‘shadow’ tankers accounted for 3% of the volume.
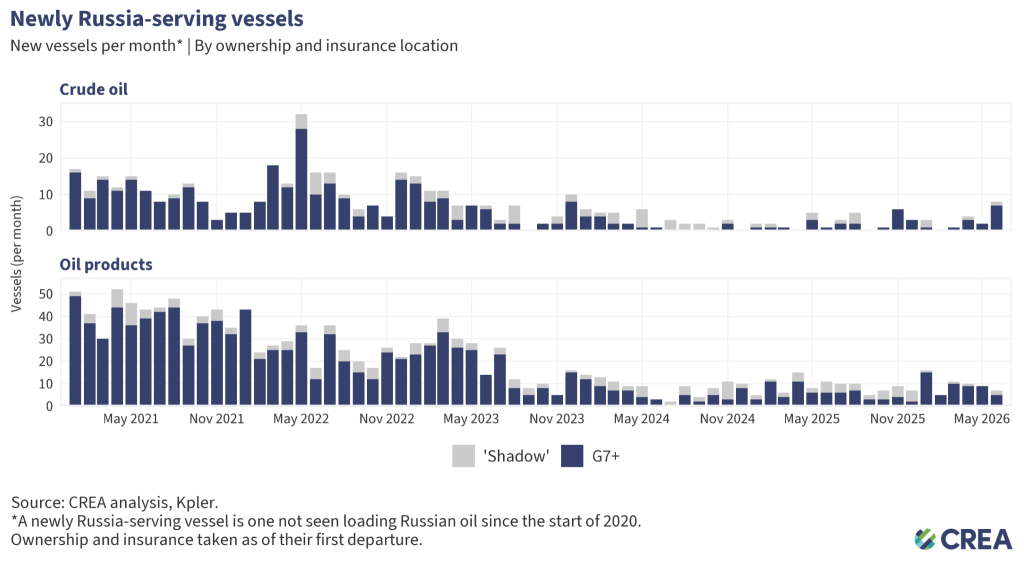
- In June 2026, 15 new vessels entered the Russian oil trade, none of which had loaded Russian oil at any point since the start of our analysis period in 2020. This total is above the average (roughly 12 new vessels per month) over the past 12 months. 12 of these 15 newly Russia-serving vessels were owned or insured by the G7+ at the time of loading.
- Newly Russia-serving ‘shadow’ fleet vessels (no ownership or insurance registered in sanctioning countries) have slowed to a trickle across 2026, with only three new ‘shadow’ fleet vessels shifting to serve Russian routes in June.
- In June 2026, seven vessels transported Russian oil products for the first time since 2020, five of which were owned or insured in G7+ countries at the time of loading.
- In June 2026, eight tankers transported Russian crude oil for the first time since 2020. This is the highest number of new vessels entering the Russian crude oil trade since December 2023, two and a half years ago. Seven of these vessels were owned or insured in G7+ jurisdictions, and one was a ‘shadow’ vessel.
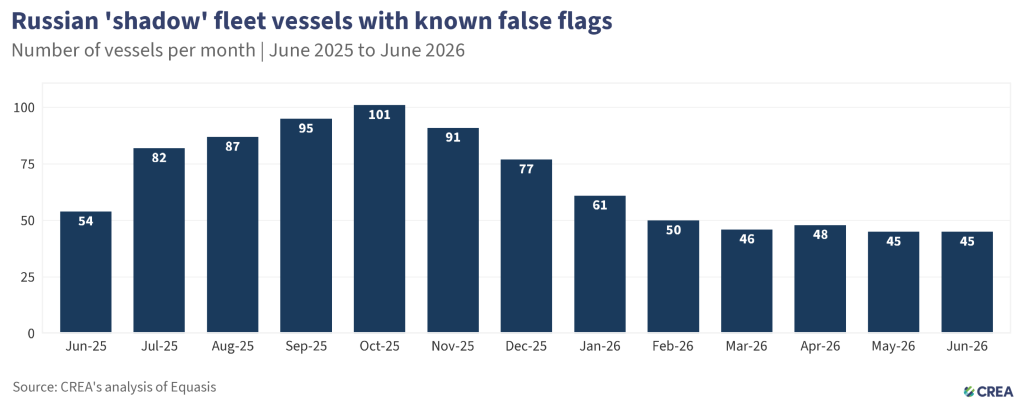
- In June 2026, 45 ‘shadow’ vessels were operating under false flags at the end of the month. Four vessels (9%) appear to be idle, having not loaded any cargo in over a year.
- Of the 45 falsely flagged vessels, 13 (29%) have carried both Russian and Iranian oil, alternating between the two sanctioned trades. Six falsely flagged vessels most recently loaded Iranian crude or products and two loaded Venezuelan crude oil, pointing to a shared ‘shadow’ infrastructure that services Russia, Iran, and Venezuela interchangeably.
- A spell of inactivity rarely signals a return to legitimate trade. Of the false-flagged tankers that went idle for over a year and have since resumed loading oil, 18 of 27 came back still flying a false flag, most often switching to Iranian, Venezuelan or Omani cargo instead of Russian oil. Time spent idle under a false flag tends to precede a return to sanctioned oil rather than an exit from it.
- Nine vessels delivered EUR 282 mn of Russian crude oil and oil products while flying a false flag in June, down 28% month-on-month.
- All three vessels operating under a false flag that loaded crude oil or oil products in June departed from Russia’s Black Sea ports.
- In June 2026, three Russian ‘shadow’ tankers were reported to have been detained and inspected, compared with two tankers detained in May 2026.
- The French Navy boarded and detained the sanctioned ‘shadow’ tanker Tagor on 1 June in the Atlantic Ocean after determining that it was sailing under a false Cameroonian flag. The vessel was diverted for further inspection to verify its nationality and compliance with international sanctions.
- The French Navy boarded and detained the Russian ‘shadow’ tanker Deliver on 23 June off the coast of Sicily after determining that it was sailing in breach of the law of the sea, including suspected irregularities with its claimed Cameroonian flag. The vessel was escorted to an anchorage for further inspection to verify its nationality and compliance with international sanctions.
- The UK Royal Marine Commandos, supported by the National Crime Agency and the Royal Air Force, boarded and detained the sanctioned Russian ‘shadow’ tanker Smyrtos in the English Channel on 14 June. The vessel was also suspected of operating under a false Cameroonian flag. This marked the UK’s first interception of a Russian ‘shadow’ fleet tanker following the government’s 25 March announcement authorising the British military to board sanctioned ‘shadow’ fleet vessels transiting UK waters.
- Following Cameroon’s decision to remove numerous Russian ‘shadow’ fleet tankers from its registry, at least one now falsely flagged vessel has diverted from the traditional Suez route to India and is instead transiting via the Cape of Good Hope from Russia’s Baltic ports. This illustrates how enforcement measures are increasing the cost and complexity of transporting Russian crude, for example by requiring longer journeys.
Cameroon deregisters dozens of vessels after quietly becoming the Russian ‘shadow’ fleet’s second-largest home for sanctioned vessels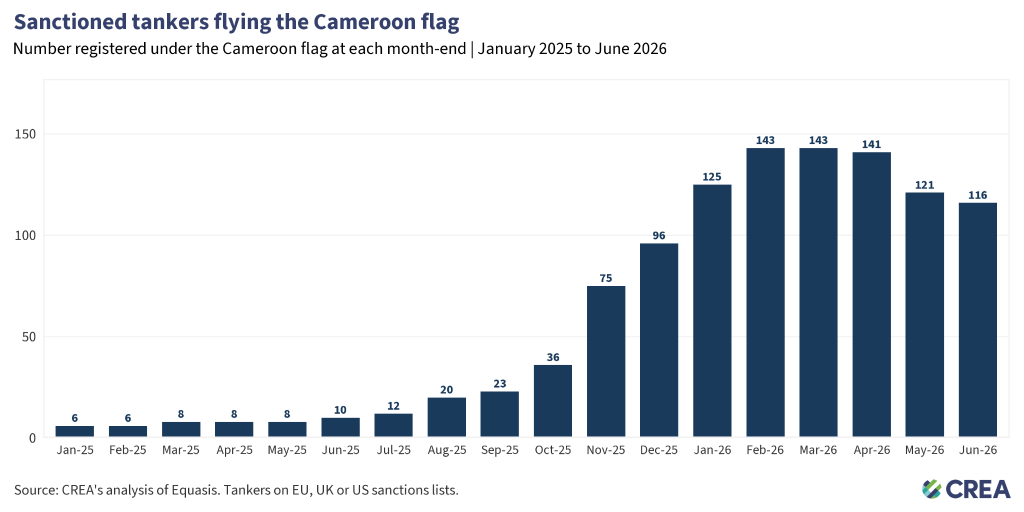 Over the past year, Cameroon has become one of the fastest-growing flags in Russia’s crude oil and oil product trade. The number of sanctioned tankers reported as flying the Cameroon flag climbed from 10 at the end of June 2025 to a peak of 143 in February 2026. In November 2025, the number of sanctioned vessels flagged by Cameroon increased by 39 in one month. This increase made Cameroon the second-largest flag for sanctioned tankers in the Russian oil trade, behind only Russia’s own registry and ahead of every other flag of convenience, as pressure pushed some alternative registries out of the trade. However, under pressure from the EU and Ukraine, and after Cameroon’s government said its own investigation had found its flag being used unlawfully, including through fraudulent registration websites, it suspended new registrations and began stripping ‘shadow’ tankers from its books. According to Equasis, 22 sanctioned tankers left the Cameroon flag in May 2026 against just two joining, pulling the total down from 141 at the end of April to 121 by the end of May and 116 by the end of June. It is likely to keep falling as more deregistrations feed through. In June, three tankers suspected of falsely flying the Cameroon flag were detained by European navies. To avoid EU waters, where the risk of interception is highest, at least one tanker still flying the Cameroon flag is taking a much longer route. The Invicta (IMO 9250543), one of the vessels struck off the Cameroon registry, appears to be sailing around the Cape of Good Hope to India instead of transiting the Strait of Gibraltar and the Suez Canal. Around a third of the tankers that left the Cameroon registry in May (7 of 22) had already sailed under a false flag before Cameroon ever registered them¹. Most vessels removed from the Cameroon registry do not appear to have found a new registry: 18 of the 22 now show no valid flag. Only a handful have re-registered so far, mostly to Equatorial Guinea and Sierra Leone, the registries that appear to be now absorbing the displaced vessels. This is not a particularly new trend. 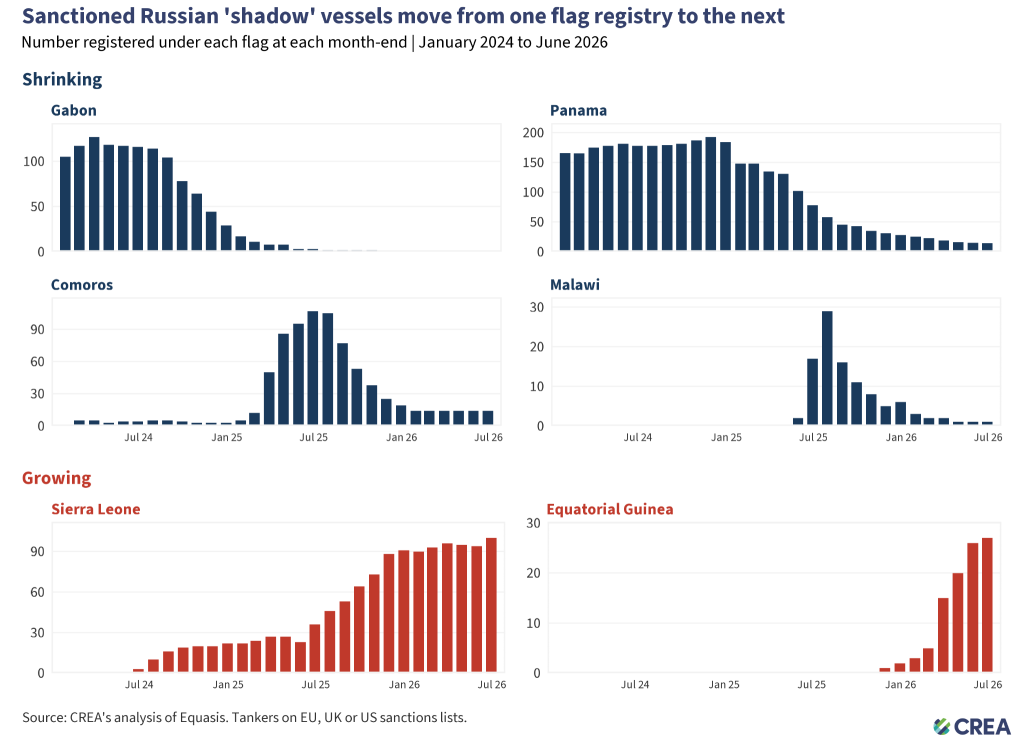 Some flag registries that host the ‘shadow’ fleet are outright fabrications, used without the knowledge of the countries whose names they carry. For example, Malawi, a landlocked country with no legitimate maritime registry, was among the most commonly used false flag for tankers transporting Russian oil in 2025. In July 2025, the Malawian Secretary for Transport and Public Works wrote to the IMO requesting action against fraudsters using its name. But even genuine national flag registries have been handed to private contractors to operate them and have turned them into ‘shadow’-fleet havens. A single Dubai-based operator managed both the Gabon and Comoros registries and became the first registry operator to be sanctioned by the EU and the UK. Both Gabon and Comoros have since deflagged Russian ‘shadow’ tankers. Comoros, which flagged a peak of 107 sanctioned tankers in mid-2025, now flags just 14, while Gabon, which peaked at 127 in early 2024, now flags none. Panama, once the largest flag registry for Russian ‘shadow’ tankers with 193 vessels, now flags just 14. Each time a registry closes business to sanctioned Russian ‘shadow’ tankers, the tonnage shifts to the next one willing to take it. That next registry now appears to be Equatorial Guinea, which grew from 2 sanctioned tankers in December 2025 to 27 in June 2026, adding more sanctioned vessels over the past three months than any other flag.If Cameroon continues to de-flag Russian ‘shadow’ tankers, they are unlikely to stop sailing; instead, they will likely move to the next registry willing to flag them. Tankers repeatedly caught hopping from one false flag to another are increasingly reverting to Russia’s own registry, which offers greater protection from external pressure. Already the largest flag registry for sanctioned tankers, it has continued to grow, with the number of sanctioned vessels flying the Russian flag increasing from 125 at the end of 2024 to 219 by June 2026. 1. Vessel flags are taken from Equasis, which records flag changes with a short and variable reporting lag. We treat both tankers now showing no valid flag and those already re-registered elsewhere as our proxy for vessels struck off Cameroon’s register; we cannot always separate a vessel that left voluntarily from one that was expelled, and because of the lag, some now-stateless tankers may already have reflagged while a few may not yet be recorded as struck off. |
‘Shadow’ tankers pose significant risks to ecology and the impact of sanctions
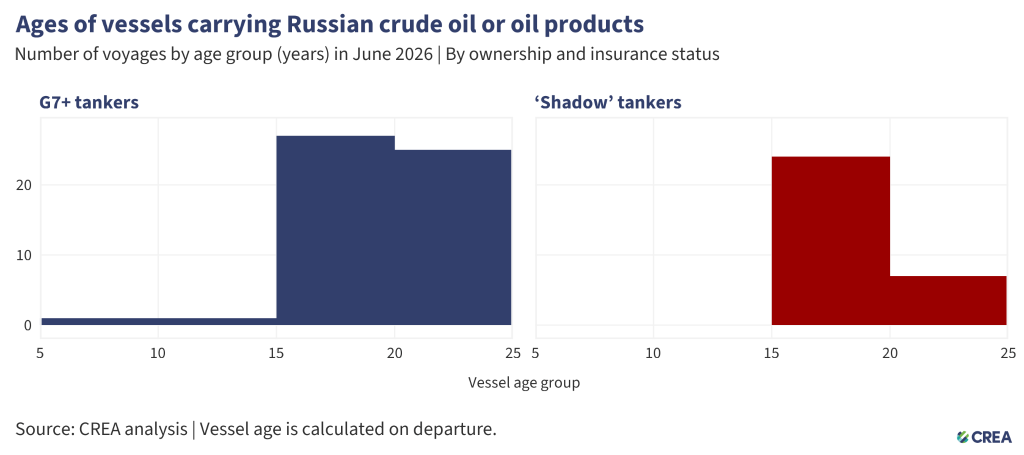
- In June 2026, 405 vessels exported Russian crude oil and oil products. Among them, 248 were G7+ owned or insured tankers, and the remaining 157 were ‘shadow’ tankers. Additionally, 42% (66 in total) of these ‘shadow’ tankers were at least 20 years old or older.
- Older ‘shadow’ tankers transporting Russian oil through EU waters pose environmental and financial risks due to their age, poor maintenance, and inadequate protection and indemnity (P&I) insurance. In the event of an oil spill or accident, coastal states may face significant cleanup costs and damage to their marine ecosystems.
- The cost of cleanup and compensation from an oil spill by tankers with dubious insurance could amount to over EUR 1 bn for taxpayers in coastal countries.
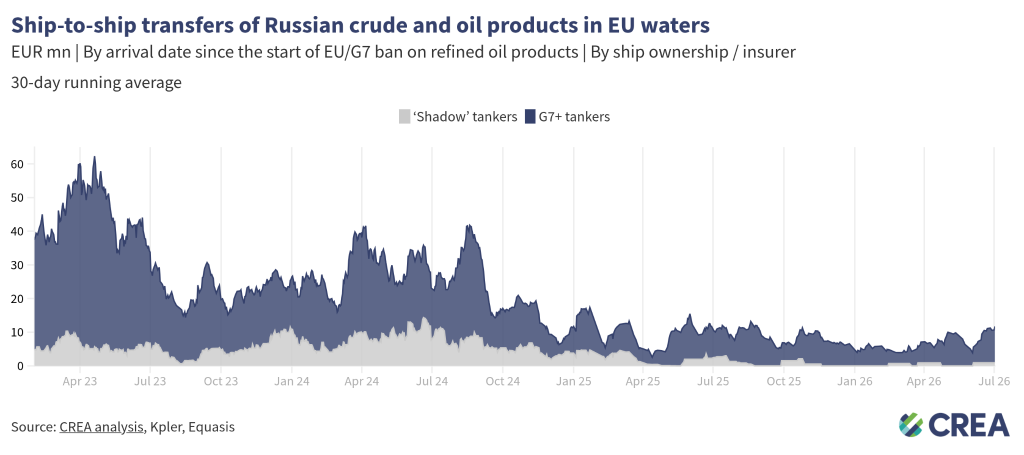
- In June 2026, an estimated EUR 149 mn worth of Russian oil was transferred via ship-to-ship (STS) transfers in EU waters.
- All STS transfers of Russian oil in EU waters were conducted in Cypriot (52%), Spanish (26%), and Polish waters (22%)
- Daily transfers averaged EUR 5 mn in June 2026.
How can Ukraine’s allies tighten the screws?
Russia’s fossil fuel export revenues have fallen since the sanctions were implemented, subsequently constricting Putin’s ability to fund his full-scale invasion of Ukraine. However, much more should be done to limit Russia’s export earnings and constrain the funding of the Kremlin’s war chest.
Lower the oil price cap to a baseline that tightens Russian revenues
The oil price cap has failed to impose a durable constraint on Russian crude export earnings, working only briefly and selectively for Urals while leaving other grades and export channels largely unaffected. Urals prices have dipped below the USD 60 per barrel cap level (the crude oil price cap level was lowered to USD 44.1 per barrel as of 1 February 2026) for mere short periods of time, while ESPO crude has consistently traded well above the cap due to its structural orientation toward China and Pacific markets.
G7+ sanctions have focused on Russian revenues rather than on restricting Russian export volumes — aimed at keeping Russian barrels flowing in global markets and easing fears of supply constraints. Policies such as the price cap are mainly aimed at reducing the price at which Russia could sell their oil.
In January 2026, as Russian oil prices fell sharply due to market oversupply, the EU proposed a ban on maritime services that facilitate Russia’s crude oil exports. Subsequently, in April 2026, the EU adopted its 20th sanctions package, which includes the basis for a future maritime services ban on Russian crude oil and petroleum products; however, it will be implemented only if an agreement is reached with the G7 and the Price Cap Coalition members. The maritime services ban would have, for the first time, targeted Russian oil export volumes and aimed at shrinking the tanker capacity required to transport Russia’s oil globally.
A massive spike in oil prices following reduced flows of fossil fuel shipments through the Strait of Hormuz has prompted a rethink of this policy to avoid creating further supply crunches in global markets. Therefore, in the face of the current energy crisis of 2026, CREA recommends that the price cap coalition either fix the price cap policy to a base level that severely restricts Russian revenues or implement a value-based sanction, such as a tax on the use of Western maritime services for transporting Russia’s fossil fuels.
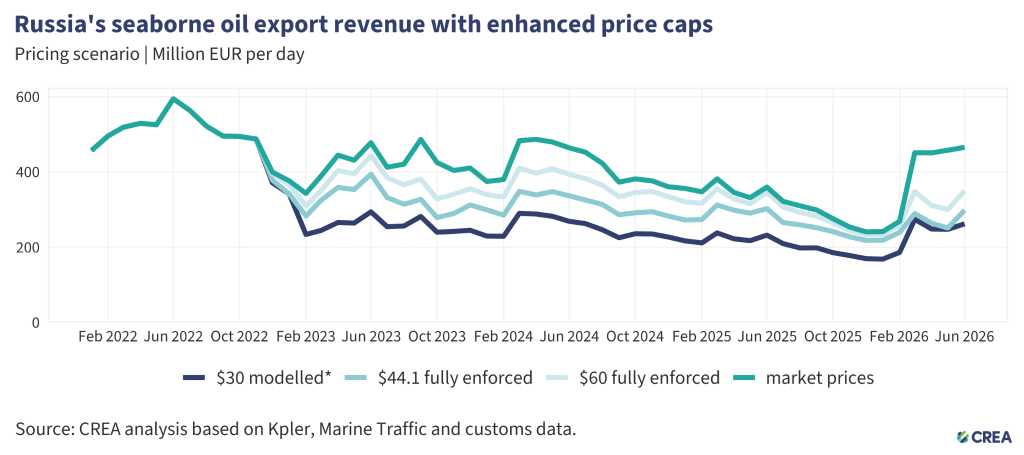
- For the price cap policy to achieve its desired impact, strong enforcement is key. In June 2026, full enforcement of the USD 44.1 per barrel price cap would have reduced revenues by 36% (approximately EUR 5 bn).
- CREA recommends that the price cap be set at the lower level of USD 30 per barrel — still well above Russia’s production cost, which averages USD 15 per barrel. This price cap would have slashed Russia’s oil export revenue by 39% from the start of the EU sanctions in December 2022 until the end of June 2026.
- In June alone, a fully enforced USD 30 per barrel price cap would have slashed Russian revenues by 44% (EUR 6.1 bn).
- Lowering the price cap would be deflationary, reducing Russia’s oil export prices and inducing more production from Russia to make up for the drop in revenue.
Create better enforcement mechanisms for the price cap policy
- Sanctioning countries must implement measures that address attestation fraud — a key enabler of non-compliance. Maritime insurers or vessel owners currently do not have direct access to pricing information for the oil they insure or transport and are reliant on attestation documents provided by oil traders for price cap compliance.
- At the same time, the majority of Russian crude oil is traded by opaque entities located outside price cap coalition countries — such as the United Arab Emirates (UAE) and Hong Kong. These traders can fraudulently underreport the price that they paid to attain Western maritime services for the transport of Russian oil.
- Maritime insurers and oil traders must be required to obtain a bank statement showing that the Russian oil was traded below the price cap to avoid fraudulent attestation documents being produced. This bank statement must be verified by the bank itself to reduce the risk of the oil trader fraudulently producing documents. It would also enable maritime service providers to independently verify the price paid for the oil.
- As an alternative to amending and enforcing the price cap policy, sanctioning jurisdictions could utilise their leverage to tax Russia’s use of G7+ maritime services when transporting its fossil fuels.
Restrict the growth of ‘shadow’ tankers & tighten regulations targeting the refining loophole
- Frequent sanctioning of Russian ‘shadow’ vessels has shifted Russian oil back to tankers owned or insured in G7+ countries. Nonetheless, Russian ‘shadow’ tankers still hold sway over the transport of Russian crude oil. In addition, many sanctioned vessels continue to deliver oil to ports globally, with EU and UK sanctions in particular being frequently violated. Sanctioning countries must align their vessel lists and enforcement paradigms for a magnified effect on their operations.
- Maritime coastal states should intensify efforts to monitor, inspect, and detain ‘shadow’ fleet vessels that lack legal passage rights, such as unflagged, unlawfully idle, or security-risk vessels. Authorities must enforce and improve environmental and navigation laws within their territorial waters, investigating and boarding suspicious vessels when justified. Crews involved in criminal activity should face prosecution, and noncompliant ships and personnel should be subject to international arrest warrants.
- In its 18th sanctions package, the EU banned the imports of ‘oil refined from Russian crude’. The regulation bans imports from countries that are ‘net importers’ of crude oil. Net export status does not preclude the import and refining of Russian-origin crude, especially in jurisdictions with flexible or opaque crude sourcing practices. To close this enforcement gap, the exemption should be applied at the refinery level rather than the national level. Refined petroleum products should be subject to import restrictions if produced at facilities that have processed Russian crude within the past six months, regardless of the final product’s declared origin or the host country’s net export position.
- The exemptions for countries including the UK, the US, Canada, Norway, and Switzerland create an opportunity for oil products refined from Russian crude to be re-exported to the EU. This gap should be closed to ensure the sanctions are comprehensive and watertight. The EU should work with its partners to encourage them to also ban the importation of oil products from refineries running on Russian crude.
- Imports of oil products or petrochemicals from storage terminals or re-export hubs in non-sanctioning countries that have received a shipment of Russian oil in the previous six months should be prohibited from exporting to sanctioning jurisdictions. This aims to prevent re-export hubs from obfuscating the origin of imported Russian oil products that are then sent to sanctioning countries, such as in the suspicious cases observed in Turkiye and Georgia.
Stronger sanctions enforcement and monitoring of violations
- Despite clear evidence of violations, there is a need for stronger enforcement of penalties by agencies against shippers, insurers, and vessel owners. This information must be shared widely in the public domain. Penalties against violating entities increase the perceived risk of being caught and serve as a deterrent.
- Penalties for violating the price cap must be significantly harsher. If found guilty of violating sanctions, vessels should be fined and permanently banned.
- The G7+ countries should ban STS transfers of Russian oil in G7+ waters. STS transfers undertaken by old ‘shadow’ tankers with questionable maintenance records and insurance pose environmental and financial risks to coastal states and support Russia logistically in exporting high volumes of crude oil. Coastal states should require oil tankers suspected of being ‘shadow’ tankers transporting Russian oil through their territorial waters to provide documentation showing adequate maritime insurance. Upon failing to do so, having been identified as a ‘shadow’ tanker, they should be added to the Office of Foreign Assets Control (OFAC), UK, and European sanctions lists. This policy could limit Russia’s ability to transport its oil on ‘shadow’ tankers, which are not required to comply with the oil price cap policy.
- To strengthen the integrity of maritime operations, the International Maritime Organization (IMO) must revise its guidelines to enhance transparency regarding maritime insurance. The IMO should mandate that flag states require shipowners and insurers to publicly disclose key financial information, including insurer solvency data, credit ratings from recognised agencies, and audited financial statements. Maritime authorities of coastal states should be legally able and encouraged to detain tankers that fly false flags and therefore pose environmental and security threats.
Relevant reports:
- Ukraine’s drone campaign against Russia’s energy infrastructure takes a toll, but falls short of a game changer
- Cheap oil is hitting Russia’s budget harder than drone strikes
- The billion-euro loophole: How is Russia still earning revenue from oil exports to Europe in spite of sanctions?
- Drone Hits On Hydrocrackers Spark Fuel Crunch, As Ukraine Pounds Russia’s Refineries
- A cat-and-mouse game with the Russian shadow fleet
| Note on methodology: This monthly report uses CREA’s fossil shipment tracker methodology. The data used for this monthly report is taken as a snapshot at the end of each month. The data provider revises and verifies data on trades and oil shipments throughout the month. We subsequently update this verified data each month to ensure accuracy. This might mean that figures for the previous month change in our updated subsequent monthly reports. For consistency, we do not amend the previous month’s report; instead, we treat the latest one as the most accurate data for revenues and volumes. Russia’s daily revenues for commodities used in this report are derived as an average, using CREA’s pricing methodology. The number of vessels with false flags per month is calculated using an end-of-month snapshot. In other words, for each month, vessels were counted if their most recent flag change at the end of the month was to a false flag. This does not account for the vessels with multiple false flag periods (switches between false flags and verified flags, or between different false flags), only the most recent flag status at the end of the month. To calculate the volume and value carried by false flags through EU waters, we filter for vessels that load from Russia’s northern and western ports (Ust-Luga, Primorsk, Vysotsk, St Petersburg, Murmansk, Arkhangelsk, Kaliningrad) in the current month and check whether they have transited the Danish Straits, the English Channel or the Straits of Gibraltar. We assume that falsely flagged vessels that have not transported a single cargo in the last two years are not operational and therefore exclude them from the analysis. CREA’s estimates of the impact of a revised and lowered price cap have been updated since February 2025. These numbers are a more accurate representation of the revenue losses Russia would incur. Our earlier numbers significantly underestimated the impact of a lower price cap due to a bug that we identified that mislabelled commodities in our model. |