By Vaibhav Raghunandan and Petras Katinas
Russian fossil fuel revenues rose for the first time in two months to cap the year, however coal exports crash to lowest level since the invasion
Key findings
- In 2024, Russian revenues from fossil fuels witnessed a 5% year-on-year reduction along with a similar 6% drop in the volumes of exports through the year.
- In 2024, there was a 6% increase in Russian revenues from crude oil exports, despite a 2% reduction in export volumes hinting at a rebound in the price of Russian oil. In a similar vein, there was a 9% year-on-year increase in revenues from pipeline gas. This rise though was minimal when compared to the 18% increase in export volumes.
- In December, Russia’s monthly fossil fuel export revenues saw a 4% month-on-month rise to EUR 652 mn per day, the first rise in two months.
- In December, Russian revenues from pipeline gas were the highest since December 2022. This surge coincided with the last month for Russian gas transit through Ukraine. The five year deal expired at the end of 2024 and earned Russia EUR 5.8 bn in pipeline gas exports to the EU in the most recent year.
- In December, Russia was the largest exporter of liquified natural gas (LNG) to France. While there was a 7% month-on-month increase in France’s imports of LNG, Russian LNG imports grew by a massive 30%.
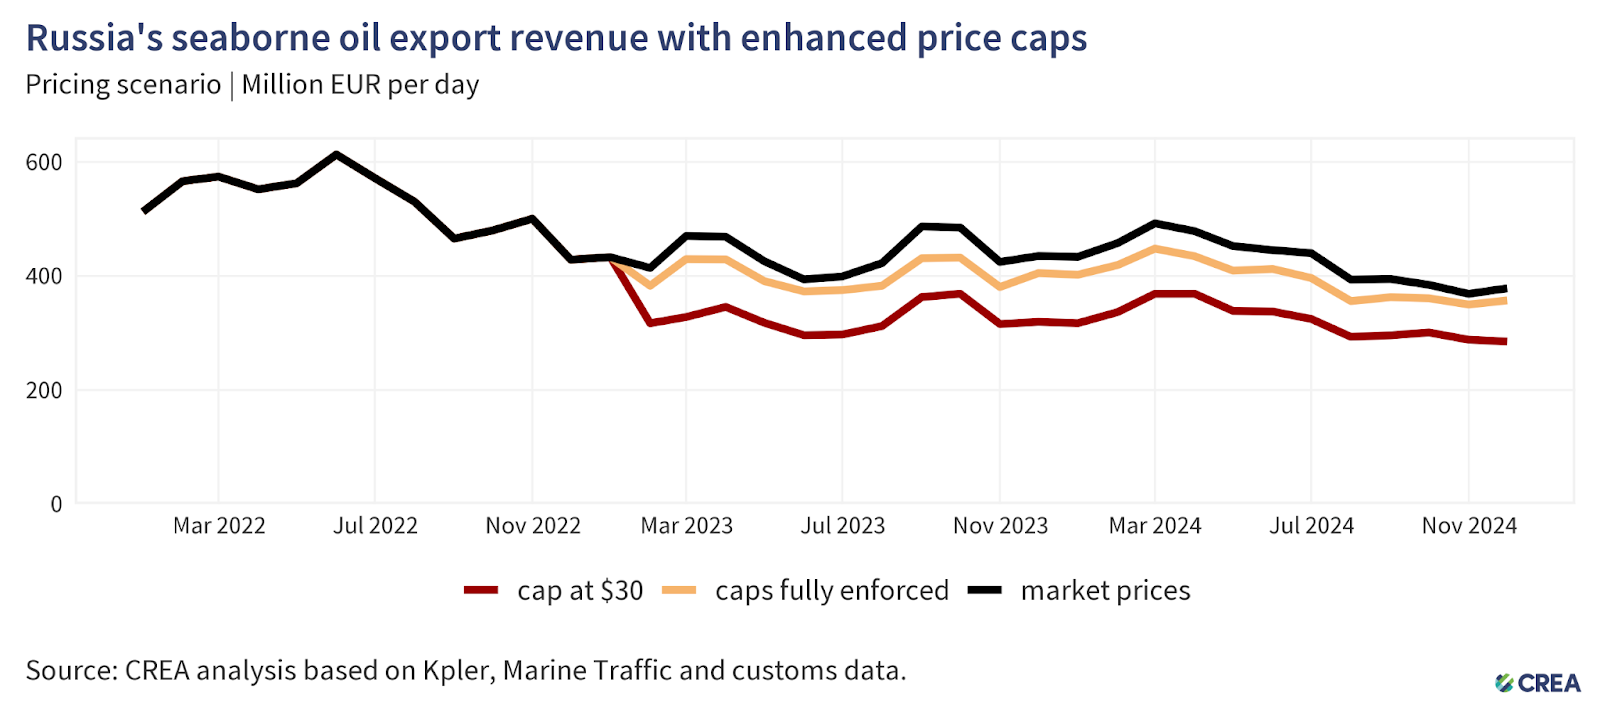
- A lower price cap of USD 30 per barrel (still well above Russia’s production cost, which averages USD 15 per barrel) would have slashed Russia’s oil export revenue by 25% (EUR 76 bn) from the start of the sanctions in December 2022 until the end of December 2024. In December alone, a USD 30 per barrel price cap would have slashed Russian revenues by 25% (EUR 2.9 bn).
Trends in total export revenue
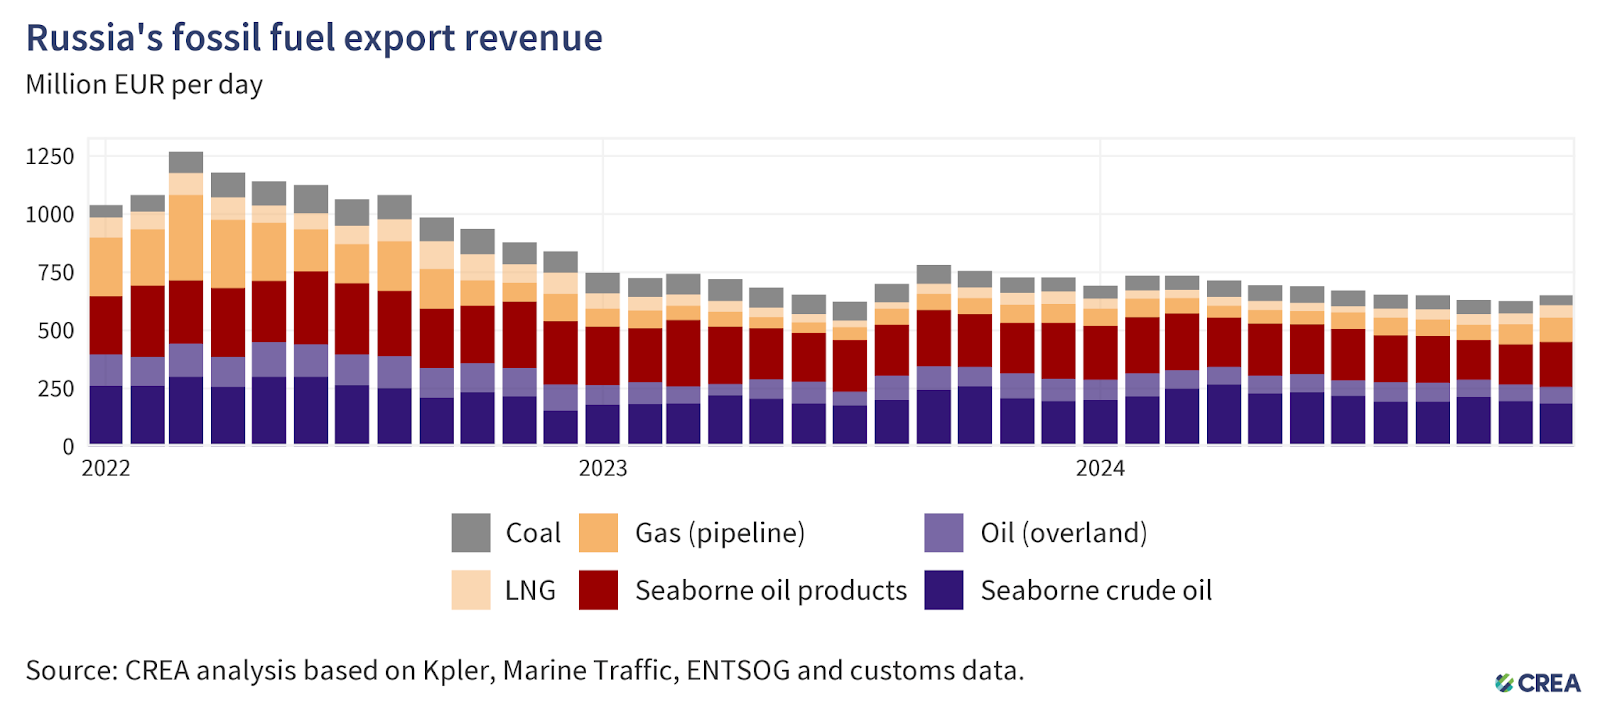
- In December, Russia’s monthly fossil fuel export revenues saw a 4% month-on-month rise to EUR 652 mn per day, the first rise in two months.
- Revenues from seaborne crude oil (EUR 184 mn per day) dropped by 5% month-on-month while import volumes dropped by a similar 6%.
- Revenues from crude oil via pipeline (EUR 72 mn per day) increased by a marginal 2% in December.
- There was a massive 20% surge in Russian revenues from LNG (EUR 55 mn per day) in December — the biggest figures since February 2023.
- For the second straight month there was a rise in Russian revenues from pipeline gas, which grew by a massive 19% rise in December. The monthly revenues (EUR 104 mn per day) were the highest since December 2022. Volumes of pipeline gas exports also rose by 17% in December, the highest since May 2022. These surges coincided with the last month for Russian gas transit through Ukraine. The five year deal expired at the end of 2024 and earned Russia EUR 5.8 bn in pipeline gas exports to the EU in the most recent year.
- There was a significant 12% month-on-month rise in Russian revenues from seaborne oil products, to EUR 194 mn per day.
- Russian revenues from coal exports crashed to their lowest levels since the invasion of Ukraine in December. Revenues saw a 19% month-on-month drop to EUR 42 mn per day.
Who is buying Russia’s fossil fuels?
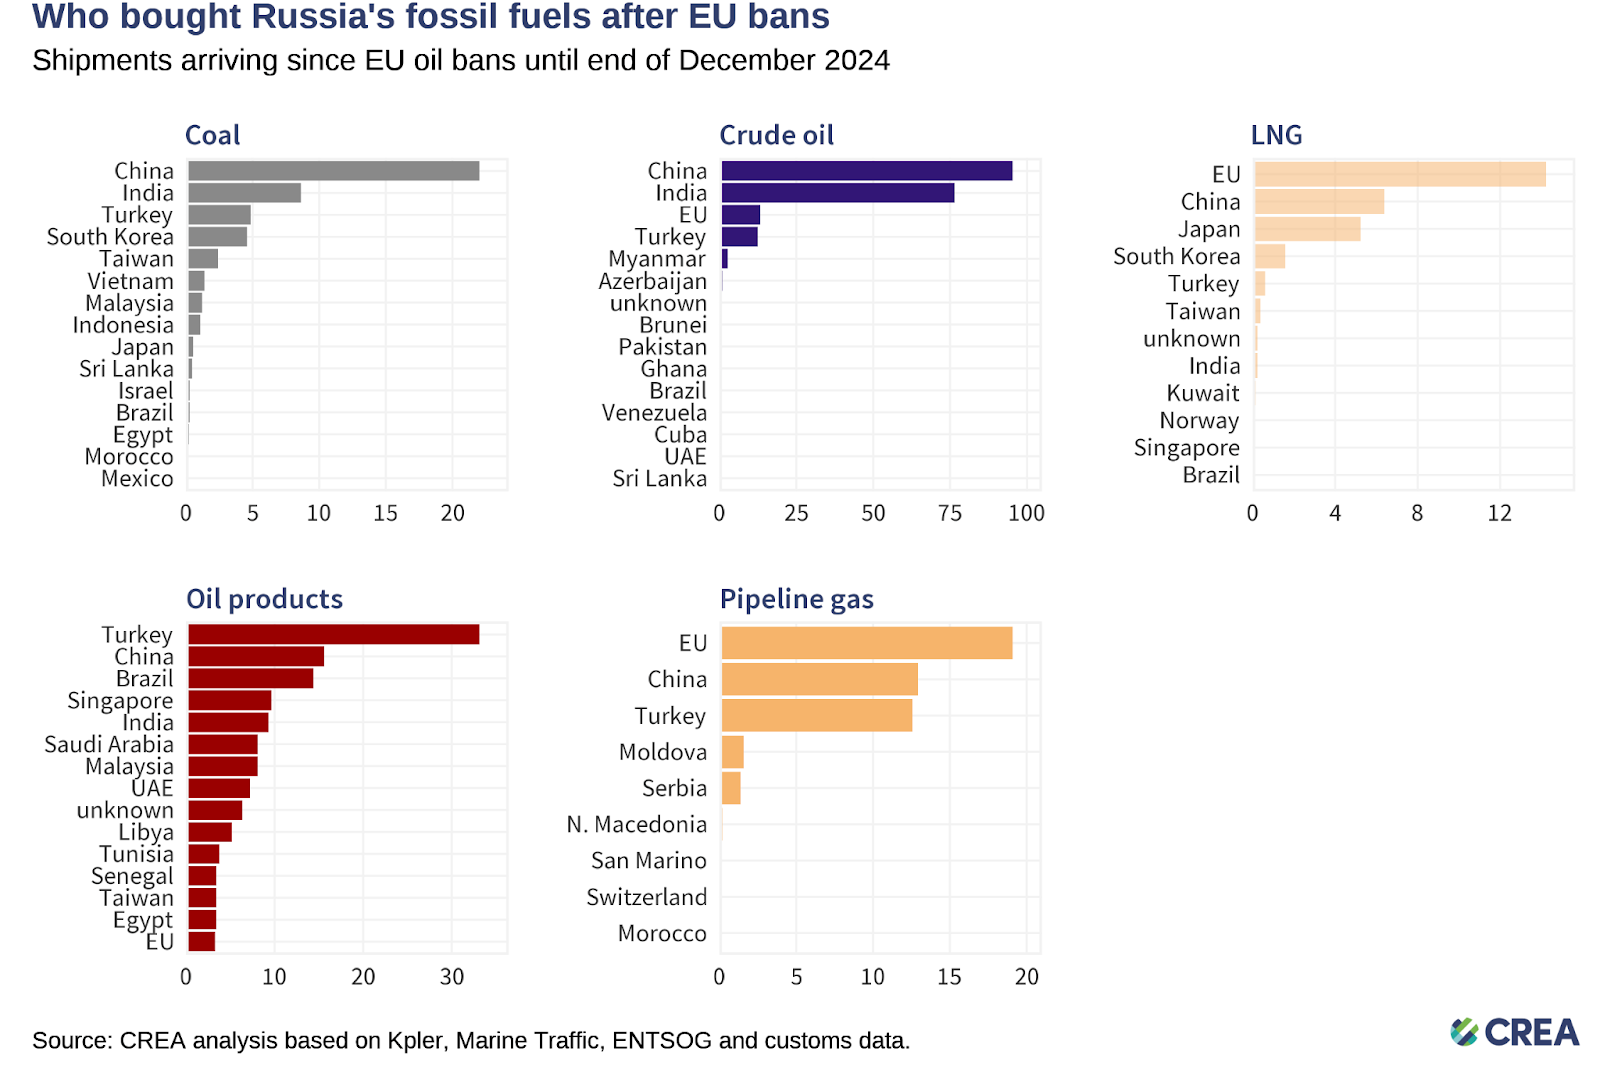
- Coal: From 5 December 2022 until the end of December 2024, China purchased 46% of all Russia’s coal exports. India (17%), Turkey (10%), South Korea (10%), and Taiwan (5%) round off the top five buyers list.
- Crude oil: China has bought 47% of Russia’s crude exports, followed by India (37%), the EU (7%), and Turkey (6%).
- Oil products: Turkey, the largest buyer, has purchased 25% of Russia’s oil product exports, followed by China (12%), and Brazil (11%).
- LNG: The EU was the largest buyer, purchasing 49% of Russia’s LNG exports, followed by China (22%), and Japan (18%).
- Pipeline gas: The EU was the largest buyer, purchasing 40% of Russia’s pipeline gas, followed by China (27%), and Turkey (26%).
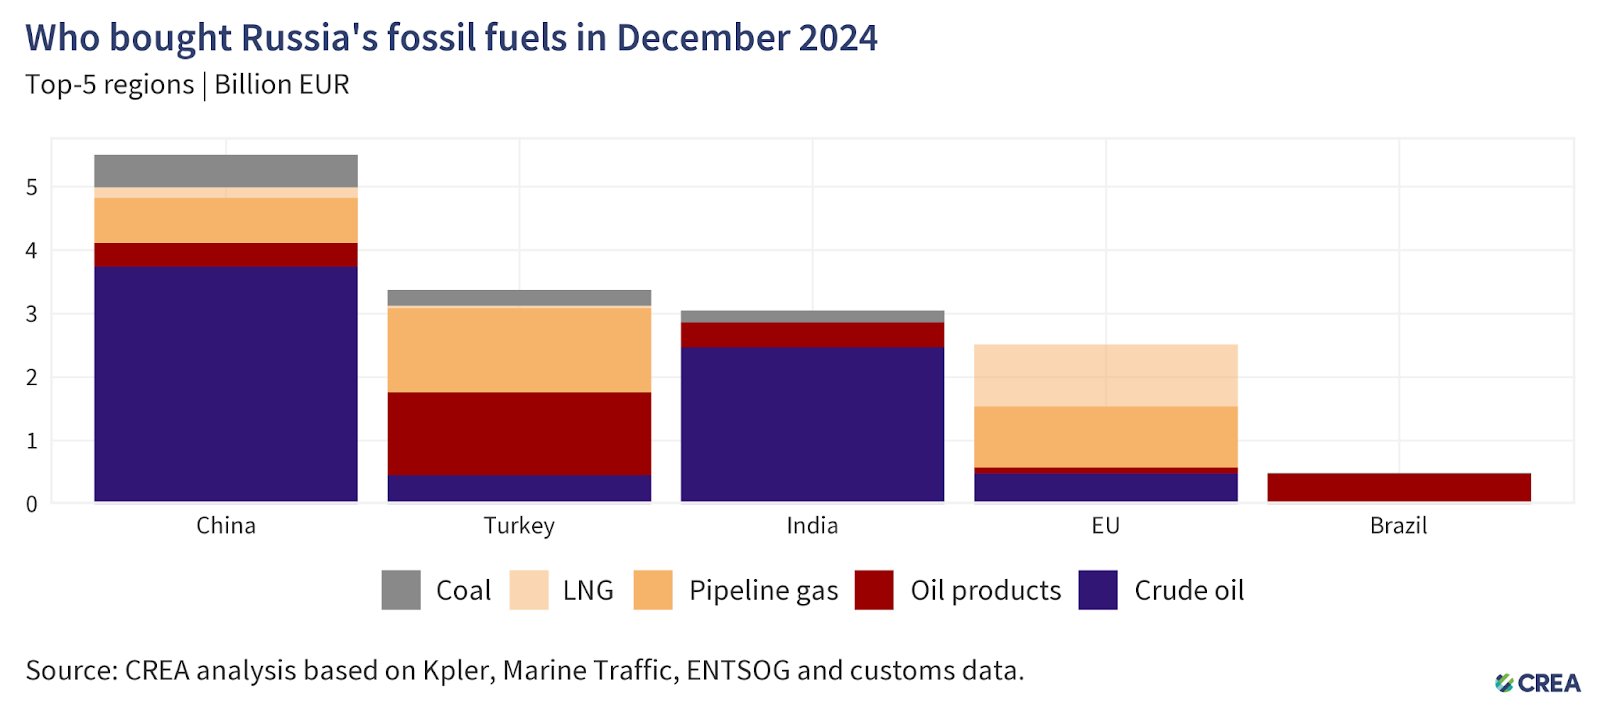
- China remained the largest buyer of Russian fossil fuels in December, accounting for 37% (EUR 5.5 bn) of Russia’s monthly export earnings from the top five importers. Crude oil comprised 68% (EUR 3.7 bn) of China’s imports from Russia. There was a 10% month-on-month rise in Russian revenues from exports to China in December, chiefly due to a 96% increase in revenues from oil products (EUR 376 mn) and a 45% increase in revenues from pipeline gas (EUR 706 mn).
- Turkey remained the second highest importer of fossil fuels from Russia for a second straight month, contributing 23% (EUR 3.3 bn) to Russia’s monthly export earnings from its top five importers. Turkey’s imports also saw a 15% month-on-month increase — chiefly due to a 15% surge in imports of coal and a 62% rise in imports of pipeline gas.
- India was the third highest buyer of Russian fossil fuels in December, contributing 20% (EUR 3 bn) to Russia’s monthly export earnings from its top five importers. After a sharp drop in November, India’s crude imports from Russia returned to the norm, recording a 57% month-on-month rise. These were their highest imports of Russian crude in the final quarter of the year.
- India’s import volumes of crude oil surged to a four month high in December, even as Russian crude volumes fell to their lowest since November 2022 — the second straight month they’ve done so. As private refiners have entered into long term contracts with Russian companies, the volume of Russian crude on the spot market has reduced. State refineries which purchase on the spot market have diversified to other sources, leading to the drop in volumes.
- The EU was the fourth largest buyer of Russian fossil fuels in December, their imports accounting for 17% (EUR 2.5 bn) of the top five purchasers. LNG comprised the largest share of the EU’s purchases of Russia’s fossil fuels (39%), followed by pipeline gas (38%).
- Brazil bought EUR 493 mn of Russian fossil fuels in December, which consisted of oil products (EUR 480 mn) and coal (EUR 12.8 mn).
| Refining loophole sent USD 3.9 bn in tax revenue to Kremlin in 2024 |
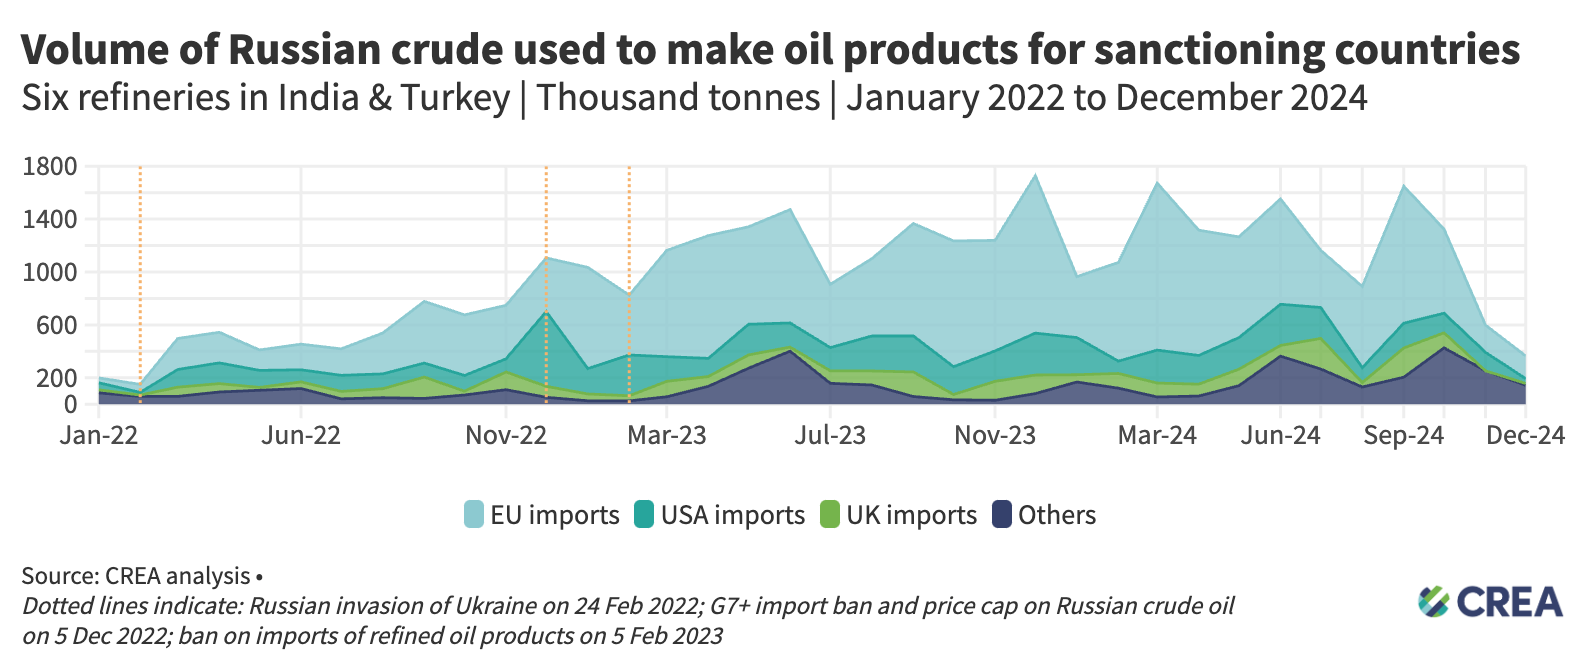 The refining loophole, which allows non-sanctioning countries to import Russian oil, refine it, and export the refined products to sanctioning countries, continued boosting Russia’s crude export revenues in 2024. In 2024, sanctioning countries’ imported EUR 15.8 bn of oil products from six refineries in India and Turkey. An estimated EUR 6.6 bn of this was refined from Russian crude. An estimated EUR 6.1 bn of Russian crude oil was used by these six refineries to create products for sanctioning countries. Sanctioning countries’ imports of refined oil products from these refineries using Russian crude has generated EUR 3.9 mn in tax revenues for the Kremlin, financing its brutal war on Ukraine.In the first three quarters of 2024, the loophole saw a 10% year-on-year increase, as India and Turkey became bigger players in the refined oil market. A significant drop in India’s Russian crude imports in the final quarter of the year saw the yearly figures drop by 6% in comparison to 2023. The EU is the biggest importer of oil products from the above countries’ refineries, with, on average, 14% of their total production targeted towards exports for the bloc. Over a fifth of these refineries’ total exports were directed to the EU in 2024, during which India became the largest exporter of oil products to the bloc. The refining loophole, which allows non-sanctioning countries to import Russian oil, refine it, and export the refined products to sanctioning countries, continued boosting Russia’s crude export revenues in 2024. In 2024, sanctioning countries’ imported EUR 15.8 bn of oil products from six refineries in India and Turkey. An estimated EUR 6.6 bn of this was refined from Russian crude. An estimated EUR 6.1 bn of Russian crude oil was used by these six refineries to create products for sanctioning countries. Sanctioning countries’ imports of refined oil products from these refineries using Russian crude has generated EUR 3.9 mn in tax revenues for the Kremlin, financing its brutal war on Ukraine.In the first three quarters of 2024, the loophole saw a 10% year-on-year increase, as India and Turkey became bigger players in the refined oil market. A significant drop in India’s Russian crude imports in the final quarter of the year saw the yearly figures drop by 6% in comparison to 2023. The EU is the biggest importer of oil products from the above countries’ refineries, with, on average, 14% of their total production targeted towards exports for the bloc. Over a fifth of these refineries’ total exports were directed to the EU in 2024, during which India became the largest exporter of oil products to the bloc. |
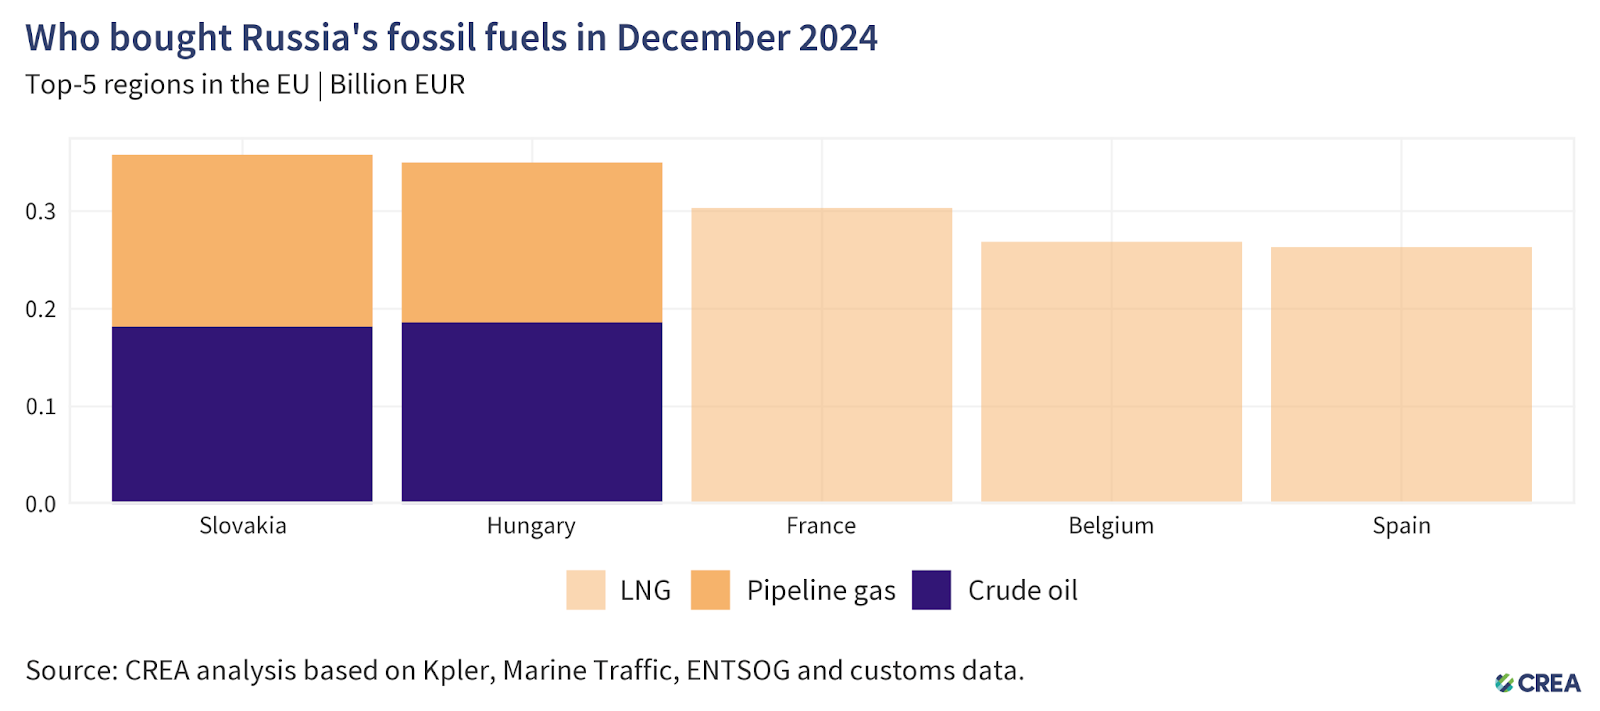
- In December, the five largest Russian fossil fuel importing countries in the EU paid Russia a total of EUR 1.5 bn for their imports. The EU has granted an exemption for Russian crude oil imported through the southern branch of the Druzhba pipeline to Hungary, Slovakia, and the Czech Republic. While Russian pipeline gas and LNG also remain unsanctioned, the pipeline transit through Ukraine ended in December 2024, thereby ending Gazprom’s gas deliveries to Slovakia as well as to Czechia and Austria.
- In December, Slovakia was the largest importer of Russian fossil fuels within the EU, with imports totalling EUR 358 mn. Slovakia’s imports consisted of crude oil (EUR 181 mn) and gas via pipeline (EUR 176 mn).
- The second-highest importer was Hungary, with imports totalling EUR 350 mn. Hungary’s imports consisted of EUR 186 mn of crude oil and EUR 163 mn of gas via pipeline.
- France, the third-largest buyer within the EU, imported Russian LNG worth EUR 303 mn in December. In December, Russia was the largest exporter of LNG to France. While there was a 7% month-on-month increase in France’s imports of LNG, Russian imports grew by a massive 30% and comprised 37% of their total LNG imports for the month.
- The entirety of Belgium and Spain’s imports of Russian fossil fuels in December comprised Russian LNG worth EUR 268 mn and EUR 263 mn, respectively.
How are oil prices changing?
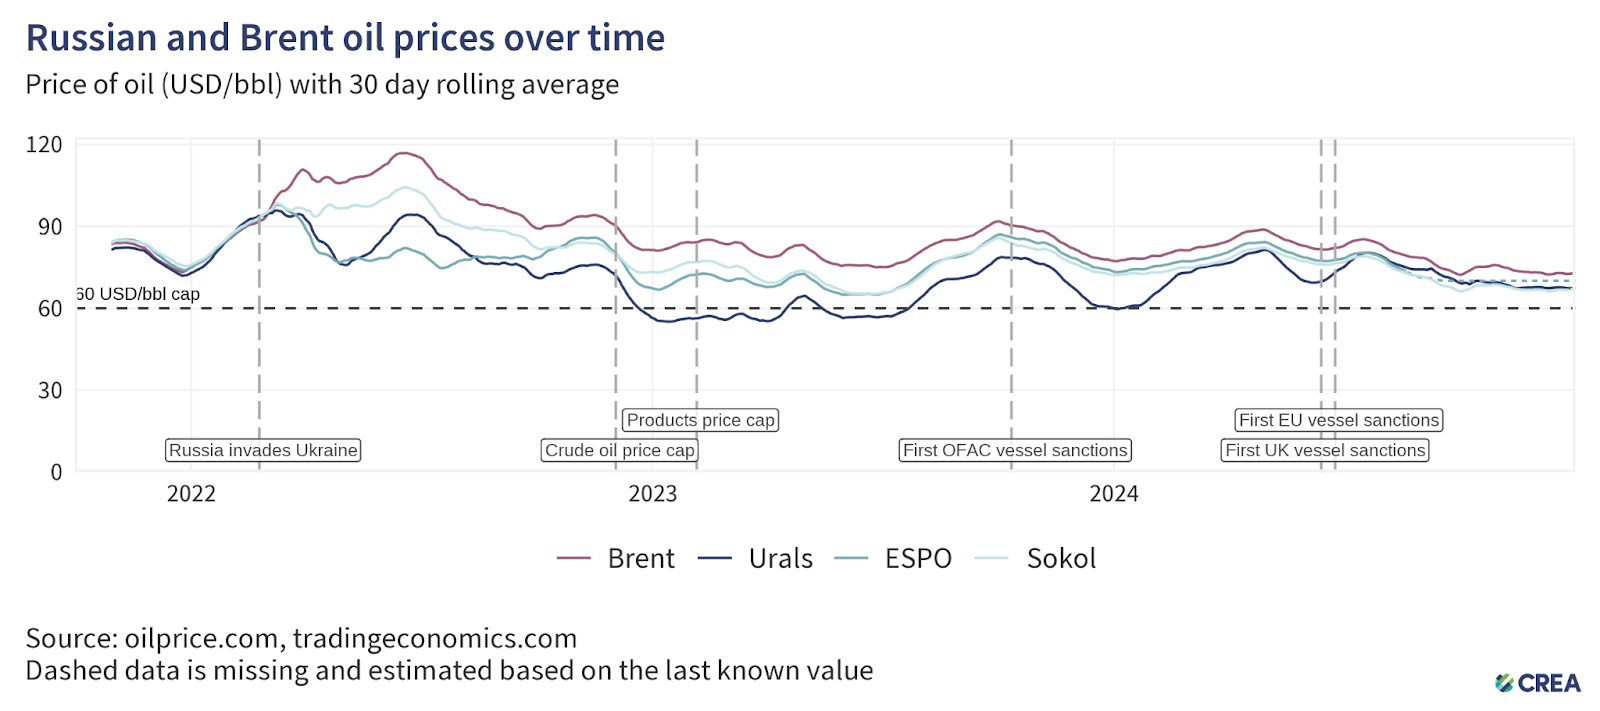
- In December 2024, the average Urals spot price stayed at the same level and remained above the price cap, trading at USD 67.49 per barrel.
- The price of the East Siberia Pacific Ocean (ESPO) and Sokol blends of Russian crude oil, primarily associated with sales to Asian markets, remained at the same level in December .
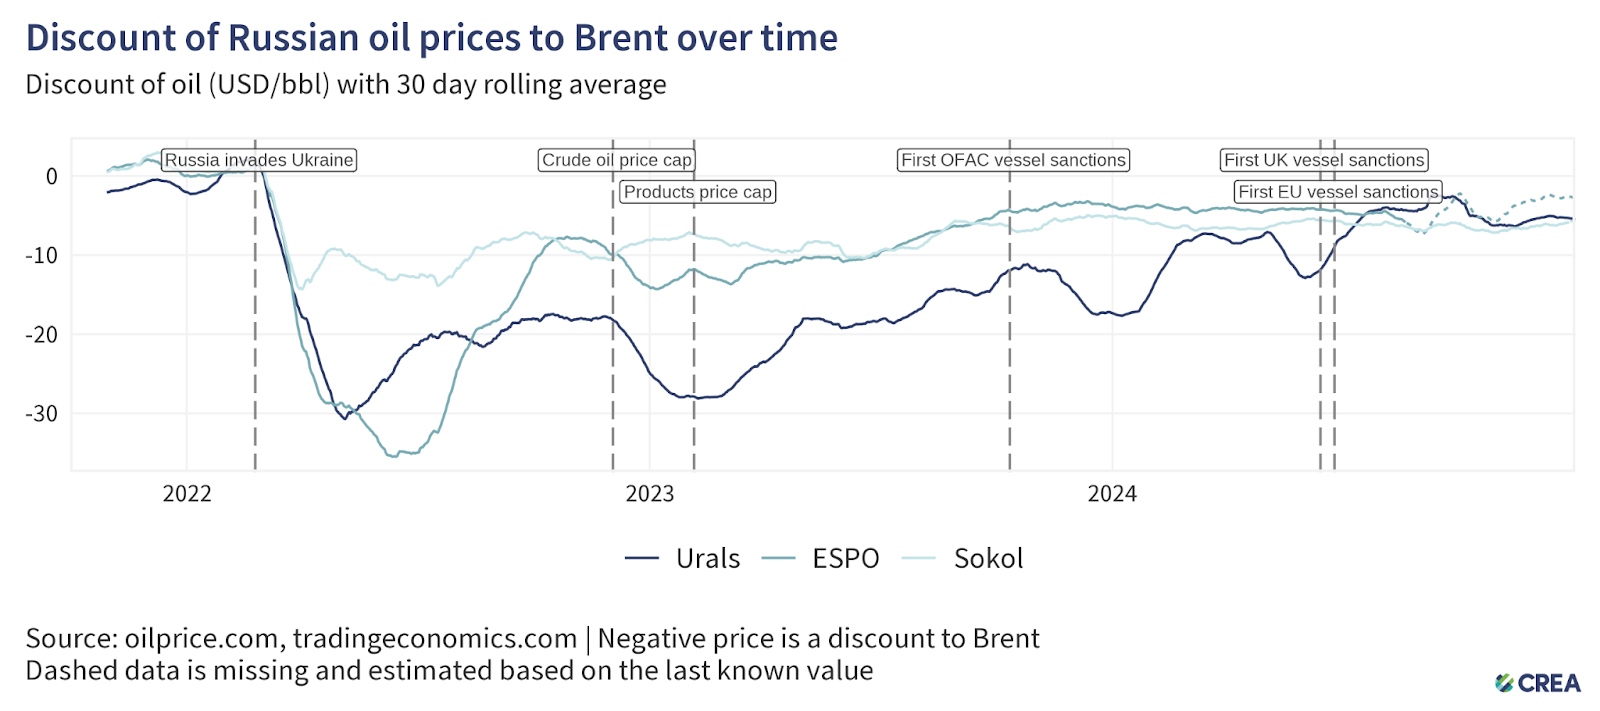
- In December, the discount on Urals-grade crude oil increased 12.6% month over month to an average of USD 5.25 per barrel compared to Brent crude oil.
- The discount on the ESPO grade narrowed by a massive 30.59% and to an average of USD 2.69 per barrel, while the discount on the Sokol blend narrowed by 8.96% to USD 6.06 per barrel.
- Throughout this period, vessels owned or insured by the G7+ countries continued to load Russian oil in all Russian port regions where average exported crude oil prices remained above the price cap level. These cases call for further investigation by enforcement agencies for breaches of sanctions.
The growth of ‘shadow’ tankers reduces G7+ shipping industry’s leverage over Russia
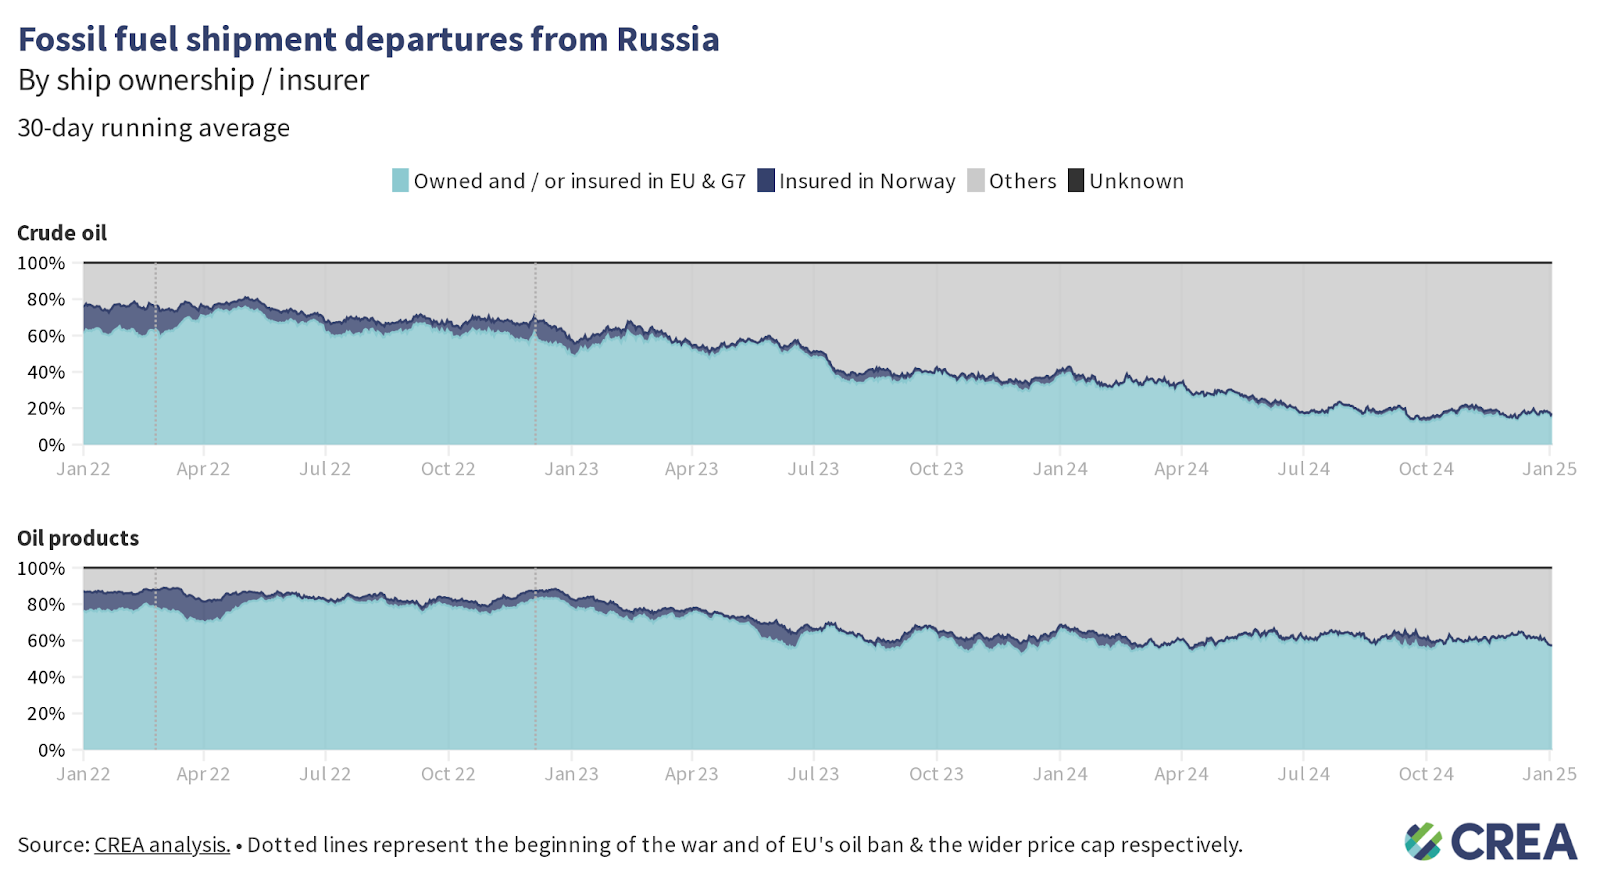
- In December, 36% of Russian seaborne crude oil and its products were transported by tankers subject to the oil price cap. The remainder was shipped by ‘shadow’ tankers and was not subject to compliance with the oil price cap policy.
- ‘Shadow’ tankers transported 82% of the total volume of Russian seaborne crude oil, while tankers owned or insured in countries implementing the price cap accounted for 18% of the total volume of Russian crude exported in December.
- ‘Shadow’ tankers transporting oil products handled 40% of Russia’s total volume of products. The remaining volume was shipped by tankers subject to the price cap policy.
‘Shadow’ tankers pose significant risks to ecology & impact of sanctions
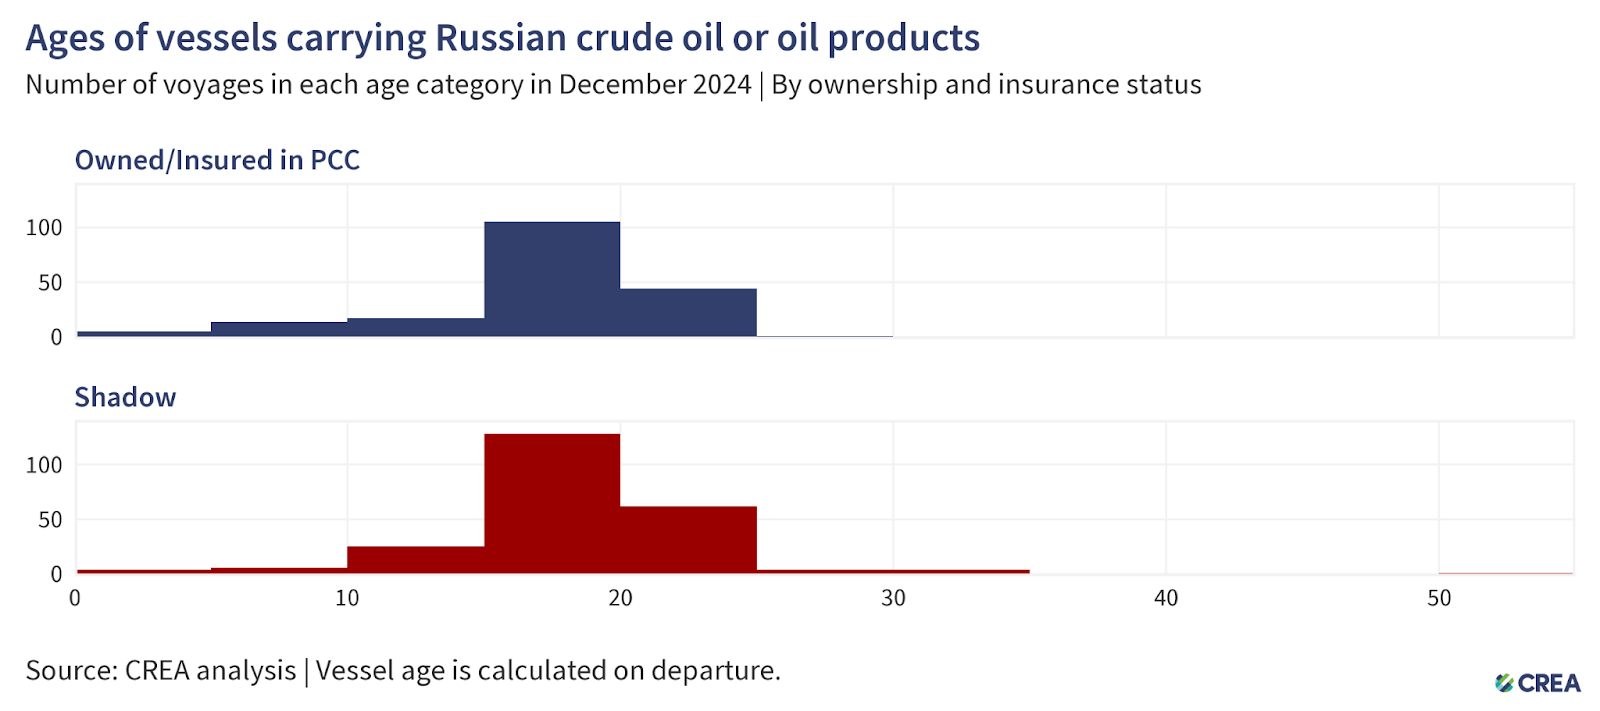
- In December 2024, 420 vessels exported Russian crude oil and oil products, of which 234 were ‘shadow’ tankers. 30% of these ‘shadow’ tankers were at least 20 years or older. The oldest tanker transporting Russian oil in December was 54 years old.
- Older ‘shadow’ tankers transporting Russian oil and petroleum products across EU Member States’ exclusive economic zones, territorial waters, or maritime straits raise environmental and financial concerns due to their age, questionable maintenance records, and insurance coverage. Their insurance potentially lacks sufficient protection & indemnity (P&I) coverage to cover the cost in the event of an oil spill or catastrophe. In the case of accidents, coastal countries may bear the financial brunt of the cleanup, not to mention the repercussions of damage to their marine ecology.
- The cost of clean-up and compensation resulting from an oil spill from tankers with dubious insurance could amount to over EUR 1 bn for the coastal country’s taxpayers.
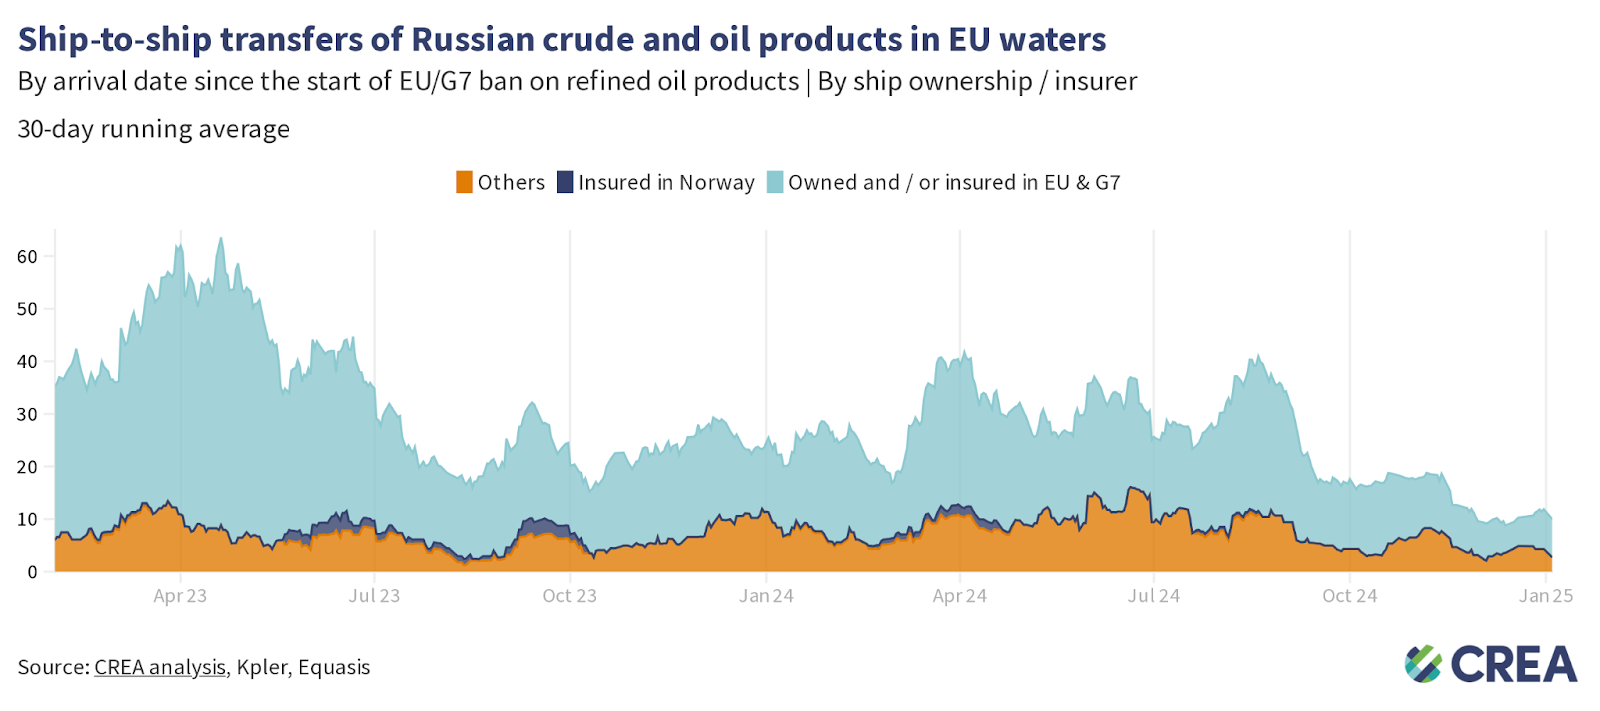
- In December, EUR 174 mn of Russian oil underwent ship-to-ship (STS) transfers in EU waters.
- 63% of these transfers were facilitated by tankers covered by G7+ insurance. STS transfers of Russian oil severely undermine sanctions by allowing Russia to evade sanctions and price caps by splitting the cargo to multiple buyers and mixing lower-priced Russian oil with non-Russian oil.
- The ‘shadow’ tankers, which averaged 17 years old, conducted environmentally dangerous ship-to-ship transfers totaling EUR 65 mn in EU waters.
How can Ukraine’s allies tighten the screws?
Russia’s fossil fuel export revenues have fallen since the sanctions were implemented, subsequently constricting Putin’s ability to fund the war. However, much more should be done to limit Russia’s export earnings and constrict the funding of the Kremlin’s war chest. This includes lowering the oil price cap, increasing monitoring and enforcement of sanctions, and banning unsanctioned fossil fuels such as LNG and pipeline fuels that are legally allowed into the EU.
Lowering the oil price cap
- A lower price cap of USD 30 per barrel (still well above Russia’s production cost, which averages USD 15 per barrel) would have slashed Russia’s oil export revenue by 25% (EUR 76 bn) from the start of the sanctions in December 2022 until the end of December 2024. In December alone, a USD 30 per barrel price cap would have slashed Russian revenues by 25% (EUR 2.9 bn).
- Lowering the price cap would be deflationary, reducing Russia’s oil export prices and inducing more production from Russia to make up for the otherwise drop in revenue.
- Since introducing sanctions until the end of December 2024, thorough enforcement of the price cap would have cut Russia’s export revenues by 8% (EUR 25.11 bn). In December 2024 alone, full enforcement of the price cap would have reduced revenues by 6% (approximately EUR 0.66 bn).
Restrict the growth of ‘shadow’ tankers & plug the refining loophole
- Russia’s reliance on tankers owned or insured in G7+ countries has fallen due to the growth of ‘shadow’ tankers. This subsequently impacts the coalition’s leverage to lower the price cap and hit Russia’s oil export revenues. Sanctioning countries must prevent Russia’s growth in ‘shadow’ tankers that are immune to the oil price cap policy.
- G7+ countries must also plug the widening refining loophole by banning the importation of oil products produced from Russian crude oil. This would enhance the impact of the sanctions by disincentivising third countries from importing large amounts of Russian crude and helping cut Russian export revenues. Banning the imports of oil products from refineries that process Russian crude oil would also lower the price of Russian oil, as they would struggle to find buyers or expand their market.
Stronger enforcement & monitoring
- Enforcement agencies overseeing the sanctions must take proactive measures against violating entities, including insurers registered in price cap coalition countries, shippers, and vessel owners.
- Despite clear evidence of violations, agencies must do more to enforce penalties against shippers, insurers, or vessel owners. This information must be shared widely in the public domain. Penalties against violating entities increase the perceived risk of being caught and serve as a deterrent.
- Penalties for violating the price cap must be significantly harsher. Current penalties include a 90-day ban on vessels from securing maritime services after violating the price cap, a mere slap on the wrist. If found guilty of violating sanctions, vessels should be fined and banned in perpetuity.
- Sanctions enforcement bodies must continue to sanction ‘shadow’ tankers as doing so hinders Russia’s ability to transport its oil above the price cap. CREA estimates that the Office of Foreign Assets Control (OFAC)’s initial sanctioning of ‘shadow’ tankers widened the discount that Russia offered buyers of its oil and cut Russia’s crude oil export revenues by 5% (EUR 512 mn per month).
- The lack of proper monitoring and enforcement along with rising oil prices have increased Russia’s export revenues to fund its war against Ukraine.
- The G7+ countries should ban STS transfers of Russian oil in G7+ waters. STS transfers undertaken by old ‘shadow’ tankers with questionable maintenance records and insurance pose environmental and financial risks to coastal states and support Russia in logistically exporting high volumes of crude oil. Coastal states should require ‘shadow’ tankers transporting Russian oil through their territorial waters to provide documentation showing adequate maritime insurance. If ‘shadow’ tankers fail to do so, they should be added to the OFAC, UK, and European sanctions list. This policy could limit Russia’s ability to transport its oil on ‘shadow’ tankers, exempt from complying with the oil price cap policy.
Relevant reports:
- Debunking Robert Fico’s Ukraine gas transit myths
- Investigation finds that Russia continues to ship oil to EU despite sanctions
- Rising costs squeeze intermediaries out of thriving Russian oil trade with India
- Russia to increase oil, gas exports to China in 2025 to sustain income
- Making the Baltic a “shadow-free” zone
| Note on methodology: Update 2023-10-19 – We now use Kpler to estimate seaborne exports from Russia and other countries. This change increases our tracker’s estimate of exports from Russia to the world by EUR 77.8 bn (+18% increase) and the exports to the EU by EUR 12.4 bn (+2.8% increase). We have also changed how we receive protection and indemnity (P&I) insurance information about ships to obtain data directly from known P&I providers and Equasis. This ensures we have recorded the correct start date for a ship’s insurance. Find out more details on the changes in our methodology, which are explained in our article about the migration from automatic identification system (AIS) data providers to the Kpler dataset. The data used for this monthly report is taken as a snapshot at the end of each month. The data provider revises and verifies data on trades and oil shipments throughout the month. We subsequently update this verified data each month to ensure accuracy. This might mean that figures for the previous month change in our updated subsequent monthly reports. For consistency, we do not amend the previous month’s report; instead, we treat the latest one as the most accurate data for revenues and volumes. Calculating the impact of sanctions: We estimated the impact of the EU/G7 crude oil ban and price cap by estimating the price of Urals in the absence of the cap and Russia’s invasion of Ukraine. We do this by first calculating the average difference between the spot prices of Brent and Urals in the year before the invasion. This average difference is used to estimate an expected price of Urals based on the current value of Brent since the start of the price cap. We use this expected price of Urals and the current price of Urals, along with the volumes of Urals traded from Kpler, to estimate the difference in the total value of Russia’s exports. |