By Panda Rushwood, Data Scientist, CREA; and Hubert Thieriot, Data Lead, CREA
Overview
As of 19 October 2023, CREA is now using Kpler to estimate seaborne exports of fossil fuels from Russia and other countries. This change increases our tracker’s estimates of exports, since the start of the invasion to the end of September 2023, from Russia to the world by EUR 77.8 bn (+18% increase) and the exports to the EU by EUR 12.4 bn (+2.8% increase). Despite the change to the total, the overall trends are similar but there are a few areas where our estimates change significantly: the total crude oil exported has decreased by EUR 13.8 bn but the total oil products exported has increased by EUR 65.2 bn. We explore these changes later in this post.
Kpler replaces our automatic identification system (AIS) data providers MarineTraffic and Datalastic for the majority of commodities that we track. We will continue to use our AIS data providers to identify a small number of seaborne liquefied petroleum gas (LPG) exports from Russia which we do not identify using the Kpler data. We have not changed our data sources for fossil fuel overland exports (pipeline, road, and rail). Old reports and publications will not be changed or updated with Kpler data.
We are making this change to give a more accurate analysis of energy exports from Russia and how they have changed since the invasion of Ukraine.
There are many benefits to using Kpler including more accurate estimations of trade volumes, a more granular breakdown of fossil fuel types, better identification of ship-to-ship transfers, and additional data allowing us to generate new insights in the future. With our former approach, we were solely relying on AIS data, whilst Kpler combines it with customs data, market sources and fixtures (contracts for chartering ships).
Pricing
We have also updated our pricing models to reflect Kpler’s more granular product classification. We now use Eurostat for training data to estimate the prices for gasoline, diesel, and fuel oils; this is instead of a single oil products category.
Insurance
Additionally, we have improved our methodology to record protection and indemnity (P&I) insurance information directly from the insurance providers to get the correct insurance inception date (start-date of insurance validity). This was after we identified that Equasis may display a provider update date (date they received provider update) instead of the actual P&I inception date. With the new methodology, we initially obtain the P&I provider’s details from Equasis and then check the ship against the insurance provider directly to get the inception date. We still store Equasis’s inception date as a fallback if the provider doesn’t have the details for the ship. We haven’t yet connected our database to acquire information from all insurance providers yet but we will continue to add new providers over time.
Impact of changes on our analysis
Kpler’s use of multiple data sources to provide data on fossil fuel flows has affected our analysis and tracker. To understand what has changed and why, we have compared the differences between the old tracker (using AIS data providers) and the new tracker (using Kpler).
While the migration to Kpler data only affects seaborne flows, we have chosen to include overland flows (pipeline, road, and rail) in the comparison to show the proportional effects of the change on the whole tracker.
We have compared these two methodologies between the start of Russia’s full-scale invasion of Ukraine in February 2022 until the end of September 2023. All charts and figures cover this period.
The changes that we have identified happen for a few different reasons:
- New ships. Kpler has identified additional ships which weren’t identified by our AIS data providers. This causes an increase in export volumes across all commodities.
- Change in commodities, volumes, and number of trades. Kpler has more accurate details on commodity types and volumes shipped. This leads to an increase for most commodities. However, some crude oil exports have been recategorised as oil product exports, decreasing the total value for crude oil and further increasing the value for oil products.
- Excluded ships. Kpler excludes some voyages and ships that we identified from our AIS data providers.
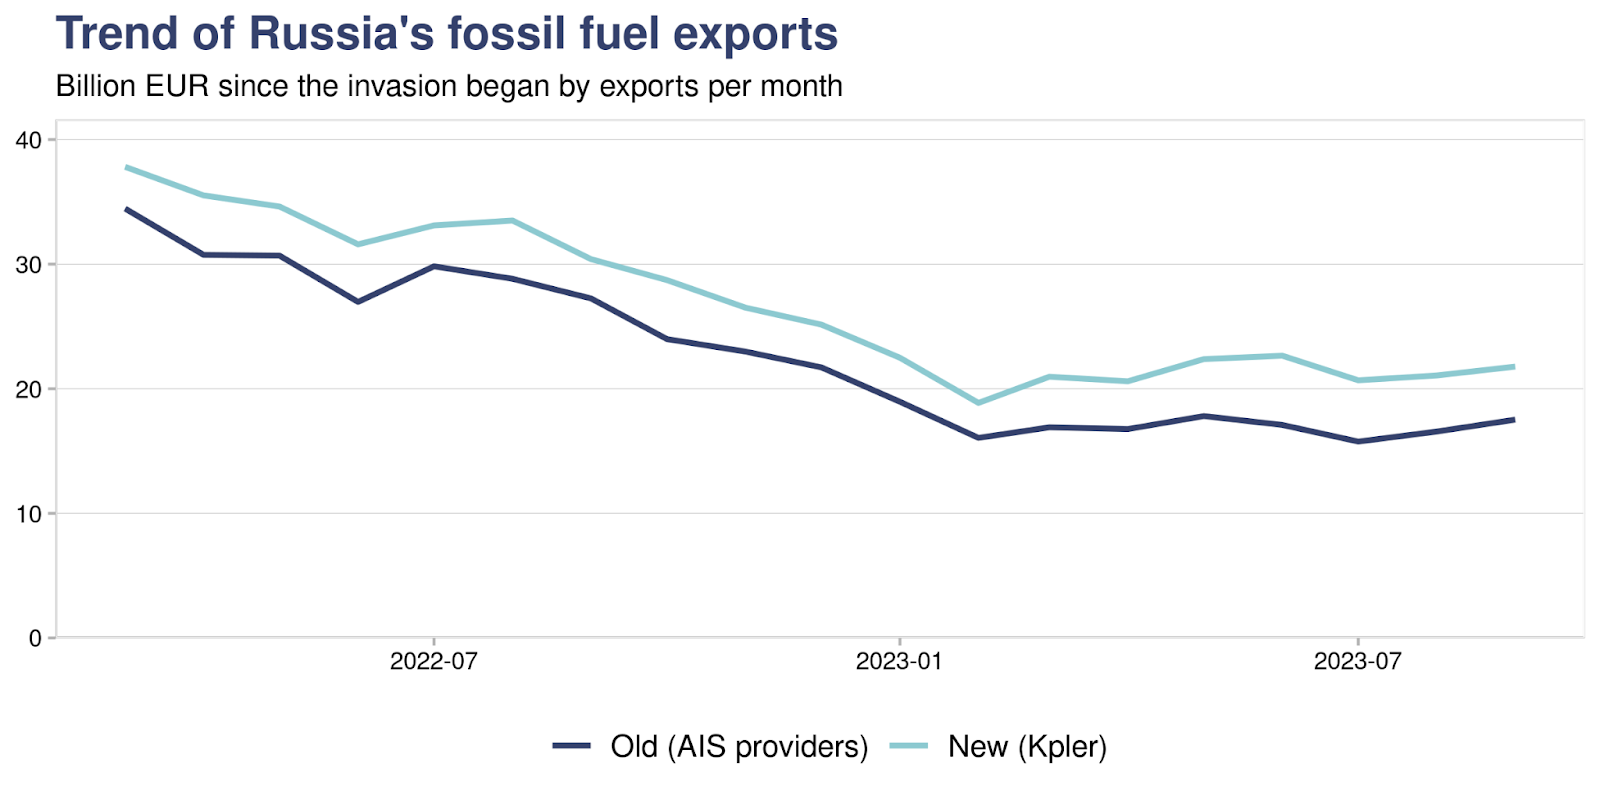
Overall, these changes lead to an increase in our total estimation of Russia’s exports by EUR 77.8 bn since the start of their invasion until the end of September 2023. In addition, the trend in global Russian exports is similar between the trackers, apart from an ongoing difference between the two, as shown in the chart below.
Commodities
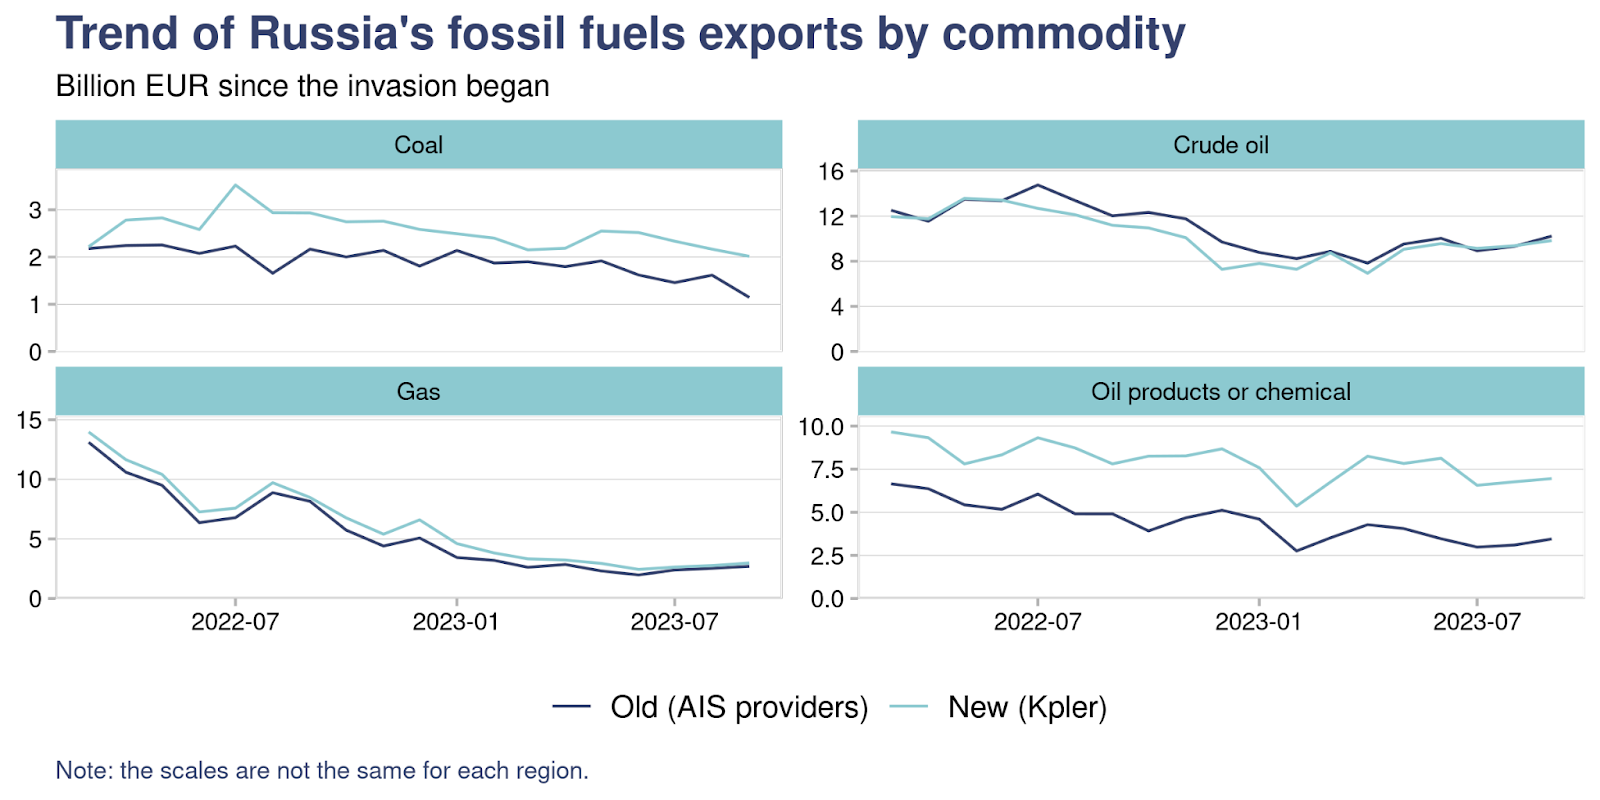
For Russia’s exports of the major commodity groups since their invasion of Ukraine until the end of September 2023, this leads to:
- coal exports: ↑ 67.6 mn tonne (+35%) | ↑ EUR 12.5 bn (+34%)
- crude oil: ↓ 30.8 mn tonne (-7.3%) | ↓ EUR 13.8 bn (-6.6%)
- gas exports: ↑ 18.2 mn tonne (+14%) | ↑ EUR 14 bn (+13%)
- oil products or chemicals: ↑ 76.2 mn tonne (+61%) | ↑ EUR 65.2 bn (+75%)

Like the overall trend, the trends in exports for each commodity are similar between the old and new methodology, though there are some further differences in the export of coal, as demonstrated in the chart below.
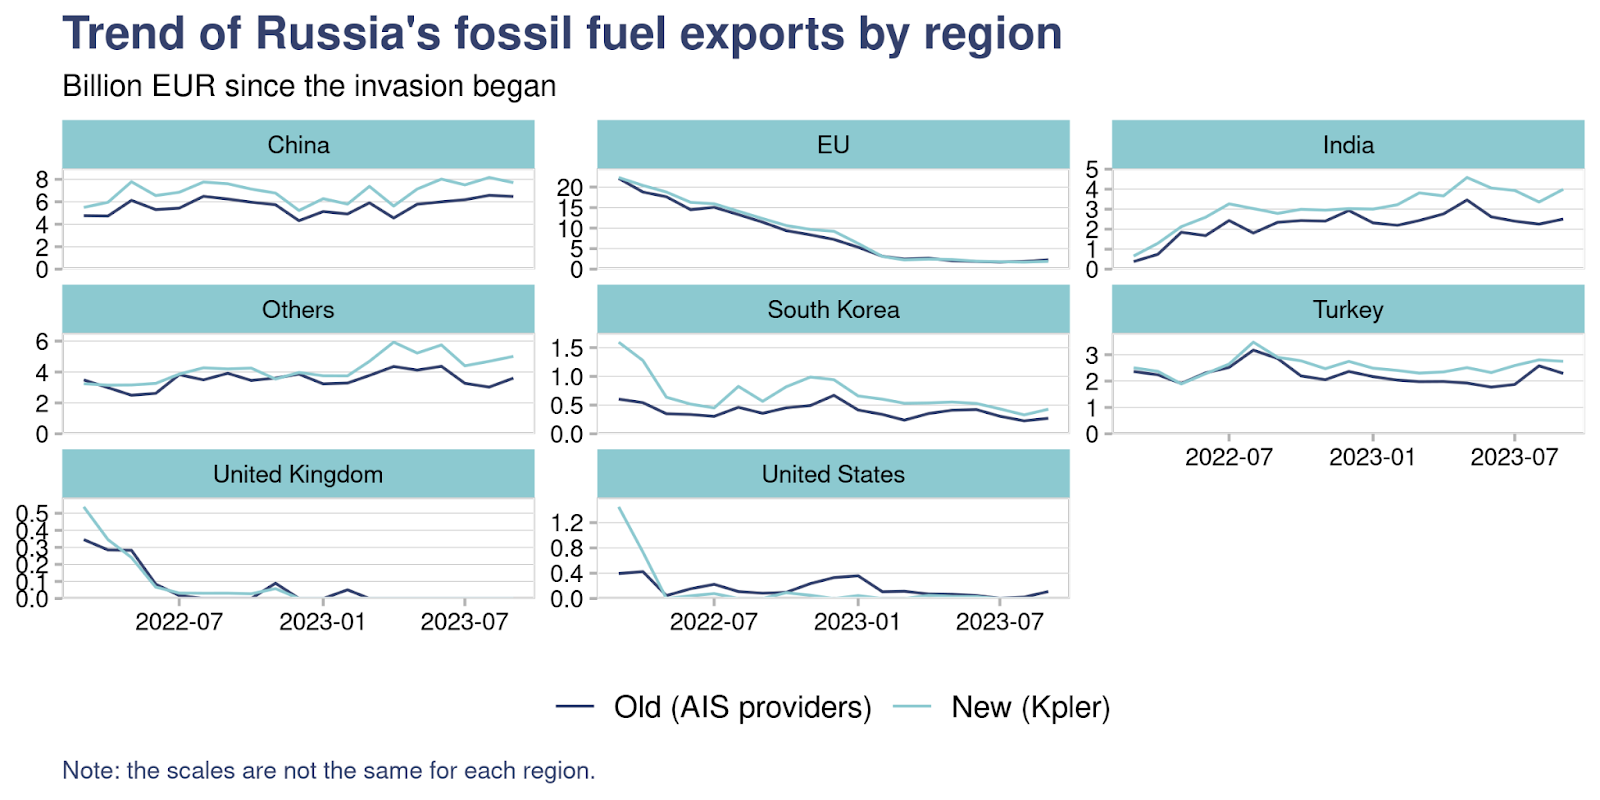
Regions
For most regions, our estimation of Russia’s export value increases, except for a small decrease of exports to the United States driven by a higher proportion of ships excluded by Kpler.
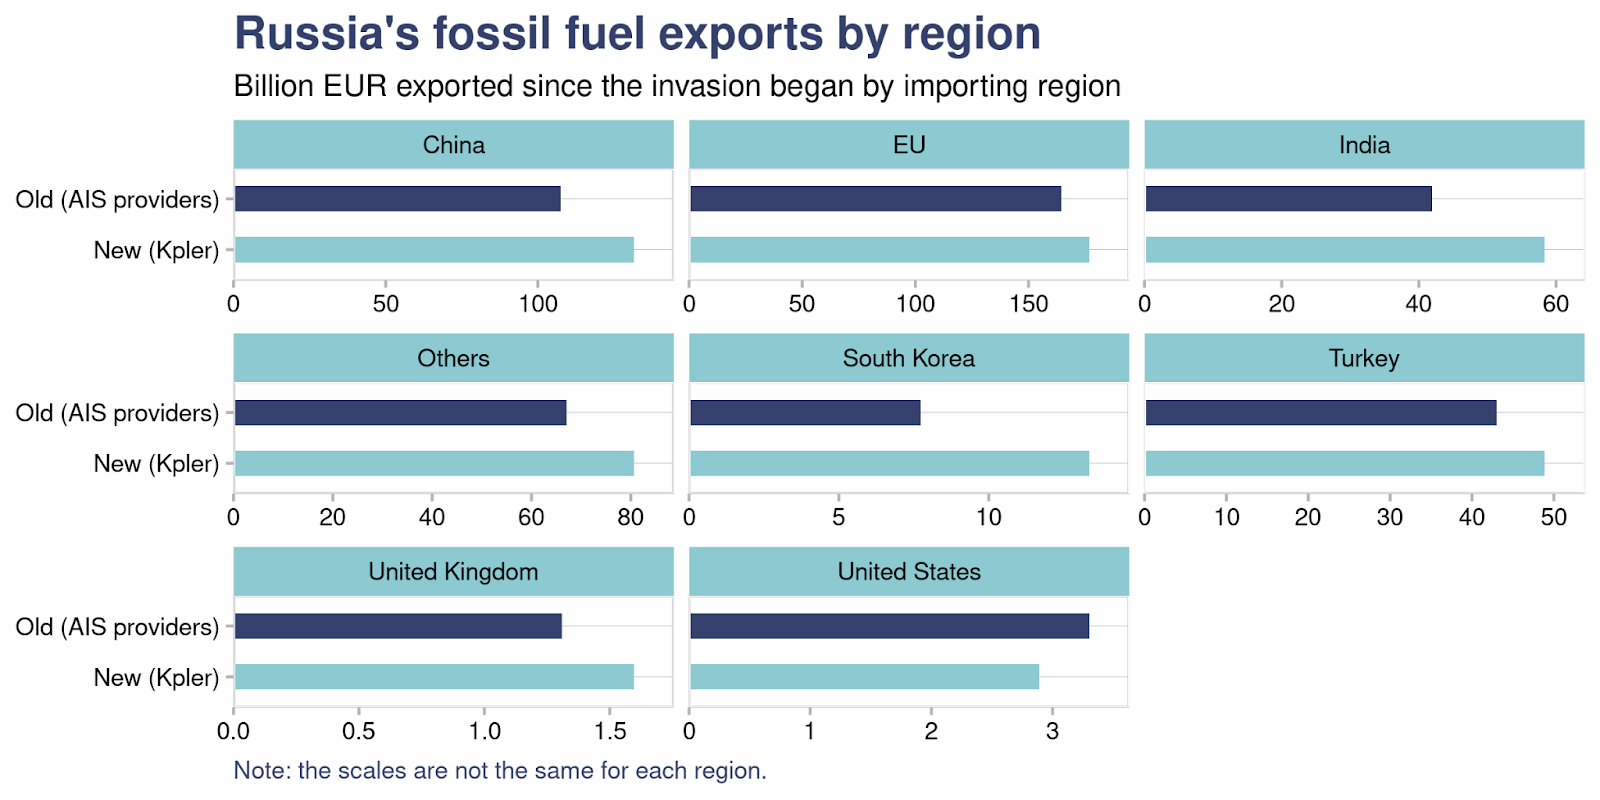
For most regions, the trends are similar between the tracker’s old and new methodology, as shown in the chart below.
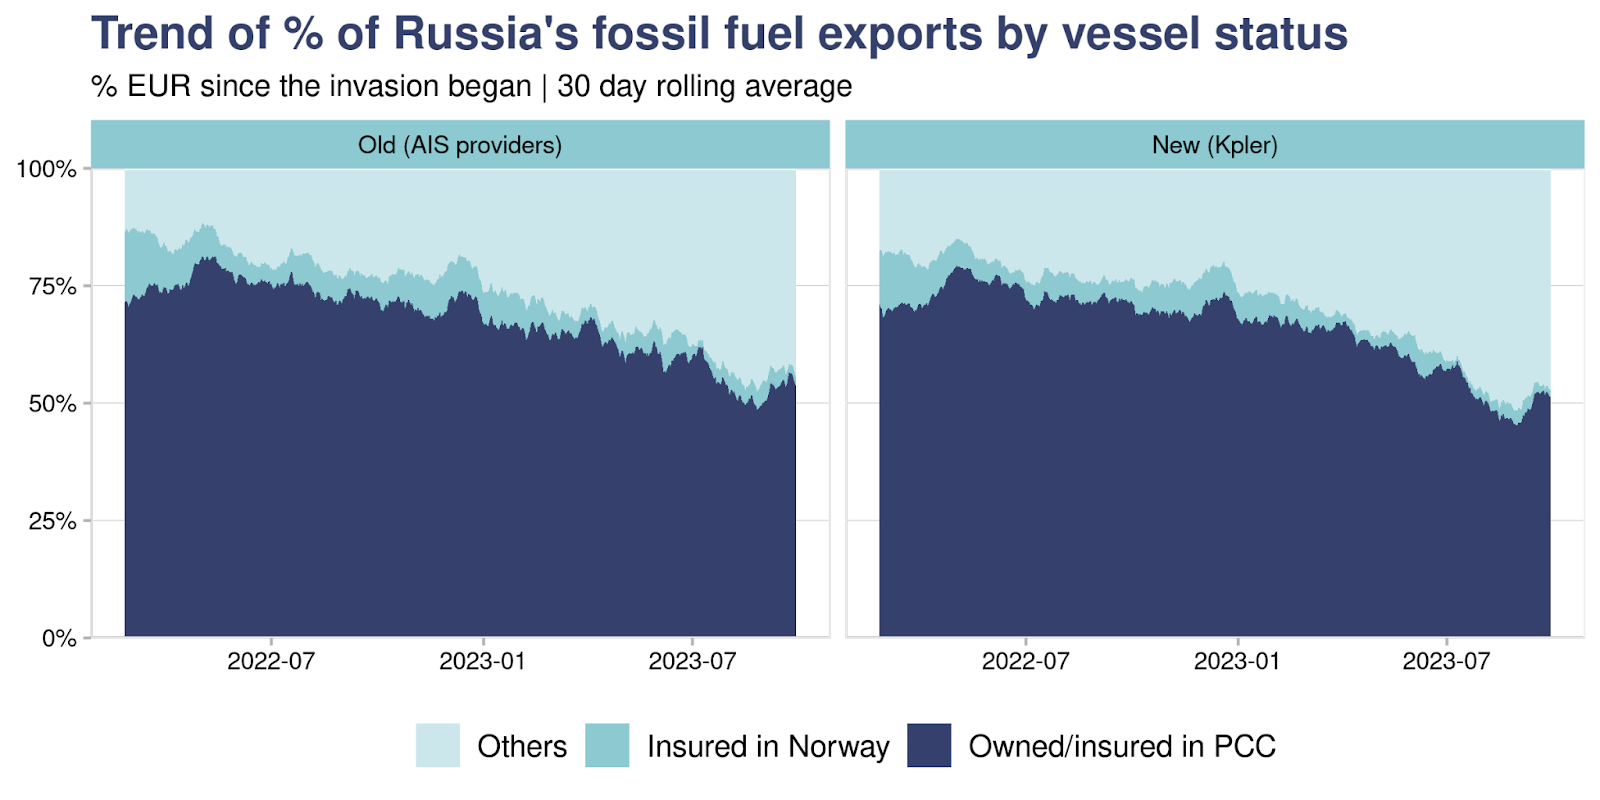
Price cap coalition (PCC)
Using Kpler, we have identified higher oil export values transported on G7 and EU owned or insured vessels.
However, proportionally, we show a slight decrease of export values transported on vessels owned or insured in PCC countries when we transfer to the new methodology.
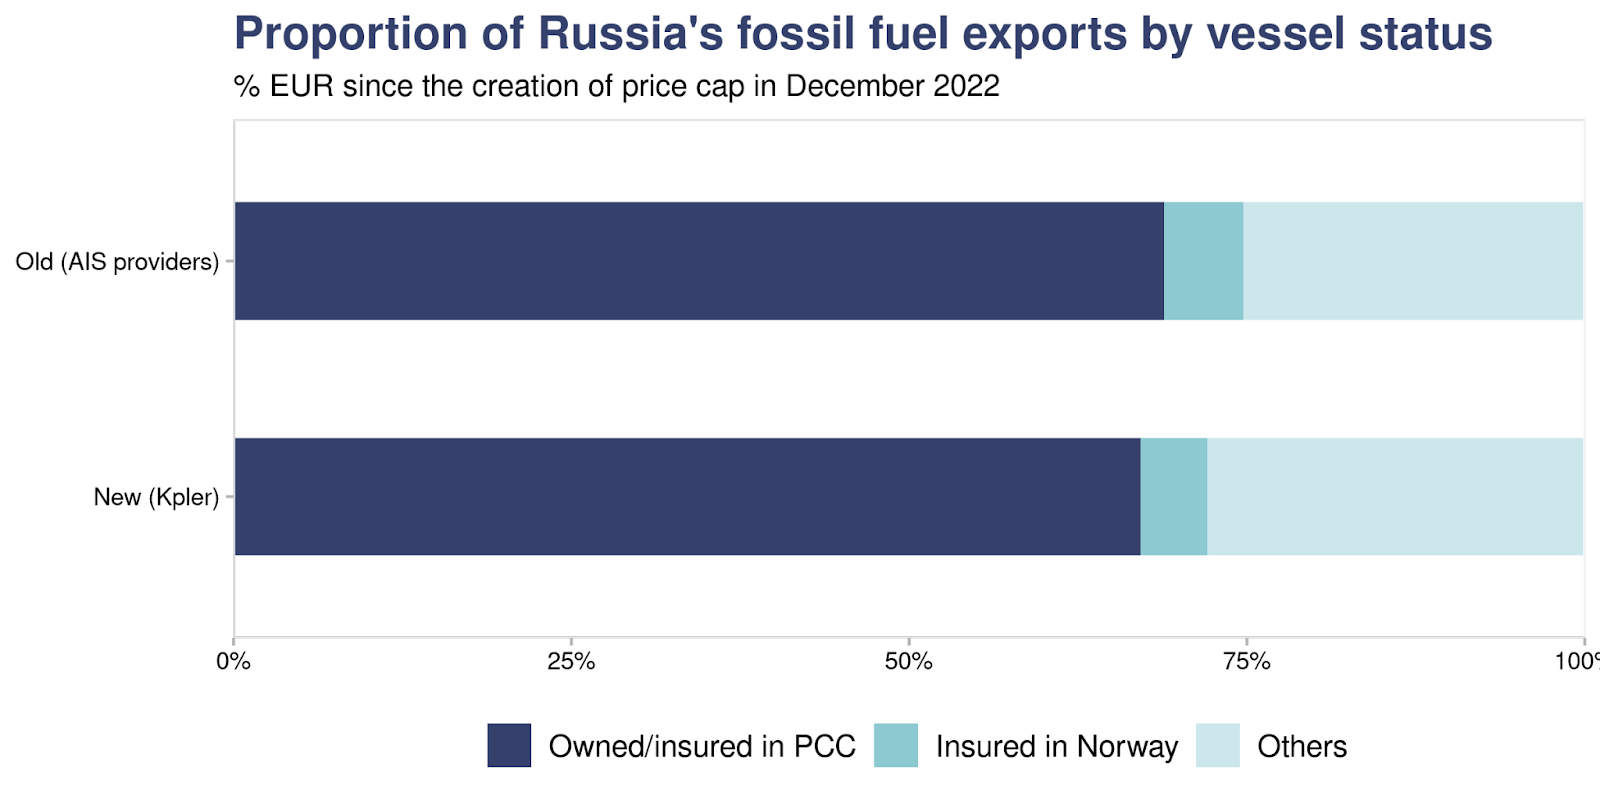
The trends in vessel ownership and insurance are similar between the old and new tracker. The main difference in the new tracker compared to the old tracker is the absolute increase in oil products export volumes.

In both the new and old tracker, the trends of percentage of fossil fuel exports by the ship’s ownership and insurance status are similar. However, the new tracker has a slightly lower percentage of ships owned/insured in the PCC.