Thermal power generation drops for the first time in 14 months
- Thermal power generation fell 1% year-on-year in August, but this was against a whopping 15% increase in August 2022.
- Hydropower generation set a new record for August, with generation up 19% on year, as operators released the water they had been saving for the peak demand season, reversing the collapse in output that had lasted for a year.
- Total power demand grew by 4%
- Industrial demand showed some signs of picking up, at 8% growth but against a baseline of 1% growth and power rationing in some provinces in August 2022.
- Household power demand, which spiked in August 2022 due to an unprecedented heatwave, fell 10% year-on-year.
- Solar power registered a sharp increase in generation and nuclear grew 6%, while wind power had a weak month.

Steel products output jumps, cement continues to slide
- Steel products output grew 11% year-on-year while pig iron output grew 5% and crude steel 3%, indicating a shift to steelmaking from scrap.
- The government aims to limit full-year crude steel output below 2022 level, requiring a 6% reduction in Sep–Dec.
- The strong steel output growth appears at odds with the contraction in real estate and weak growth in autos. Railways and industrial machinery are more likely sources of increased demand. However, output cuts are likely to be needed also to maintain supply balance.
- Chemical and non-ferrous metals output accelerated.
- Cement output has been declining since 2020, leaving the industry with overcapacity and testifying to declining construction volumes.
The steel and cement industries are the largest CO2 emitters in China, when emissions from their electricity use are included. They are also bellwethers of real estate, infrastructure and other fixed asset investment which play an outsize role in China’s emissions and economy.

Electric arc steelmaking gains share
- Pig iron and crude steel output have perked up in early September.
- The operating rate of blast furnaces in Tangshan, China’s “steel capital” and an important source of air pollution in Beijing, reached the highest rate for August–September since at least 2015.
- Hebei industrial output is a bellwether of national priorities: when air quality and emissions are the priority, it is the most tightly regulated area due to its impact on Beijing’s pollution levels.

Coal mining boom runs out of steam, oil & gas imports jump
- Domestic coal output continued to fall short of demand, at 2% growth, showing that the domestic coal mining push has hit limits. Furthermore, domestic coal quality has declined, resulting in further demand for imports which jumped 50% in August.
- Crude oil imports and oil products output continued to grow in August, driven by an increase in oil products demand (re-opening of economy).
- Fossil gas imports increased by 23%, raising year-to-date imports growth to 10%.

Diesel leads rebound in oil demand
- The strong growth in EVs is making a dent in gasoline demand for the first time. The share of EVs of all vehicles on the road increased from 4.5% a year ago to 7.5% now, shaving approximately 3%-points off gasoline demand growth.
- The increase in output of oil products has been mostly driven by diesel, which is used for freight and heavy vehicles.
- Gasoline and kerosene have shown a modest rebound due to the re-opening of the economy.

Record solar & wind — and coal — additions
- Strong wind and solar installations continue, with a whopping 97 GW of solar and 26 GW of wind installed in January–June.
- Commissioning of thermal (coal and gas) power plants made a new record for the first seven months of the year, since at least 2009. This is due to coal power projects being started or restarted in 2020 entering operation, showing the urgent pace of construction.

Distributed solar and centralised wind boom
- Solar power installations are led by Henan, Shandong and Hubei, which have ambitious rooftop solar policies (known as “whole-county distributed solar”), striving to meet rooftop solar installation targets by the end of 2023.
- Inner Mongolia leads in wind development, aiming for full operation of its large-scale clean energy bases by year-end.
- Thermal (coal) power additions accelerated in Shaanxi, Inner Mongolia and Xinjiang, which are aiming to export power to eastern demand centres. However, Guangdong, Zhejiang and other eastern provinces have started a large wave of new coal power projects, leading to redundancy once plants are completed in a few years.

Record solar cell and electric vehicle output
- Solar cell production in the past 12 months reached 522 gigawatts, doubling in the past two years and predicting rapid growth in global solar power installations. One more doubling will take solar cell output to the level needed to cut global emissions in line with Paris agreement.
- EV production continues to grow rapidly, with over 8 million vehicles produced in the past 12 months, representing more than 30% of all vehicles produced
- China’s export volume of EV continues to soar, securing its position as global leader


Beijing PM2.5 pollution has stagnated at 2021 levels while ozone pollution keeps increasing
- Beijing’s PM2.5 levels increased 27% year-on-year in the first eight months of 2023, putting the city at risk of violating the national air quality standards this year, after meeting them for the first time in 2021. The year-on-year increase took place mainly in the first quarter, but August levels were also higher than in 2022.
- PM2.5 fell strongly in winter 2017–18 as a result of a last-minute push to meet national targets. Another campaign was carried out to clean up the air for the Winter Olympics in early 2022 but those gains were quickly undone. PM2.5 pollution has returned to 2021 levels, indicating little progress at the moment.
- Ozone pollution shows a long-term increasing trend with little sign of success in curbing the growth. Ozone levels averaged across China’s cities increased 13.9% on year in August. China has not set targets for ozone concentration, hoping that policies for controlling precursor pollutants would do the trick.


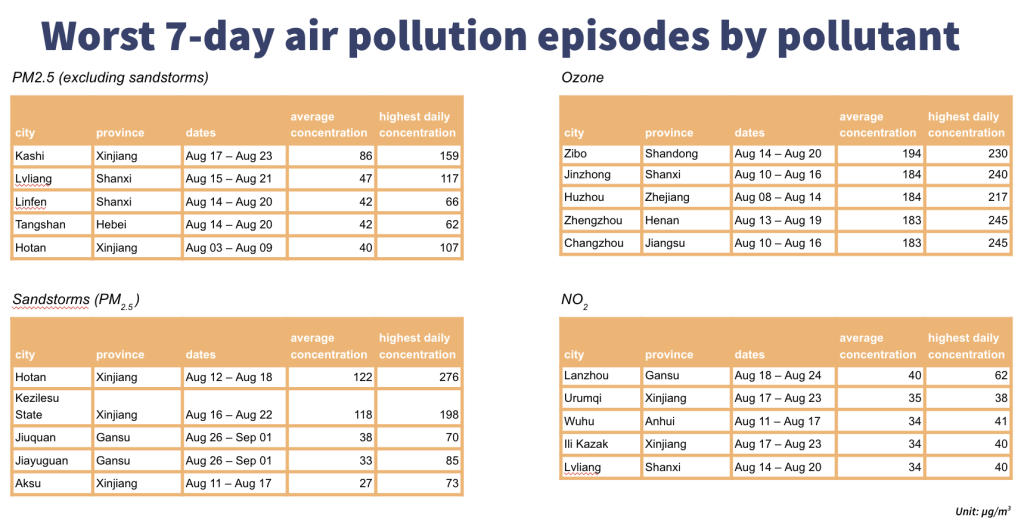
North and Northwest China face worst air pollution in August
- North and Northwest China had the worst PM2.5 levels in August. Taiyuan, capital of Shanxi province that is the industrial base for coal and heavy metals and part of Fenwei plain area rose to the top.
- The worst ozone levels were measured in the capitals of Henan, Hubei, Shandong, Hebei and Ningxia, focusing in the central and northern region of China.
- Lanzhou, capital of Gansu, again ranked worst for NO2 levels, and is followed by Taiyuan. NO2 contributes to PM2.5 and ozone levels, besides being a dangerous pollutant in its own right.

Southern and Western China see rebound in PM2.5 and NO2 while Northern China suffers from ozone pollution
- Emissions of PM2.5-forming pollutants increased spottedly across southern and western China mainly due to overall emission increase.
- Yinchuan, Shijiazhuang, Zhengzhou and many other northern cities saw increases in ozone-forming emissions.
Our analysis projects the influence of weather conditions on air pollution levels using a machine-learning model trained on actual data for each city. The variation that cannot be explained by weather conditions is attributed to changes in emissions.

Data sources
- Industrial output, power generation and power capacity additions, as well as fuel imports and exports are based on Chinese government data, through Wind Financial Terminal. Some of the data is not included in public releases.
- Measured air quality data is compiled from Chinese government air quality monitoring stations. Weather-controlled air quality is derived from CREA’s deweathering algorithm.