
Author: Xiaoli Zhang; Data scientist: Danny Hartono; with contributions from Lauri Myllyvirta, Lead Analyst
As of the end of October 2026, 18 provincial capitals remained above the PM2.5 benchmark, while six exceeded the ozone standard on a rolling 12-month basis. In October, the PM2.5 rebound became less widespread, while the ozone rebound continued to expand. Unfavourable weather conditions offset some emission reduction benefits, contributing to higher PM2.5 and ozone levels in many cities.
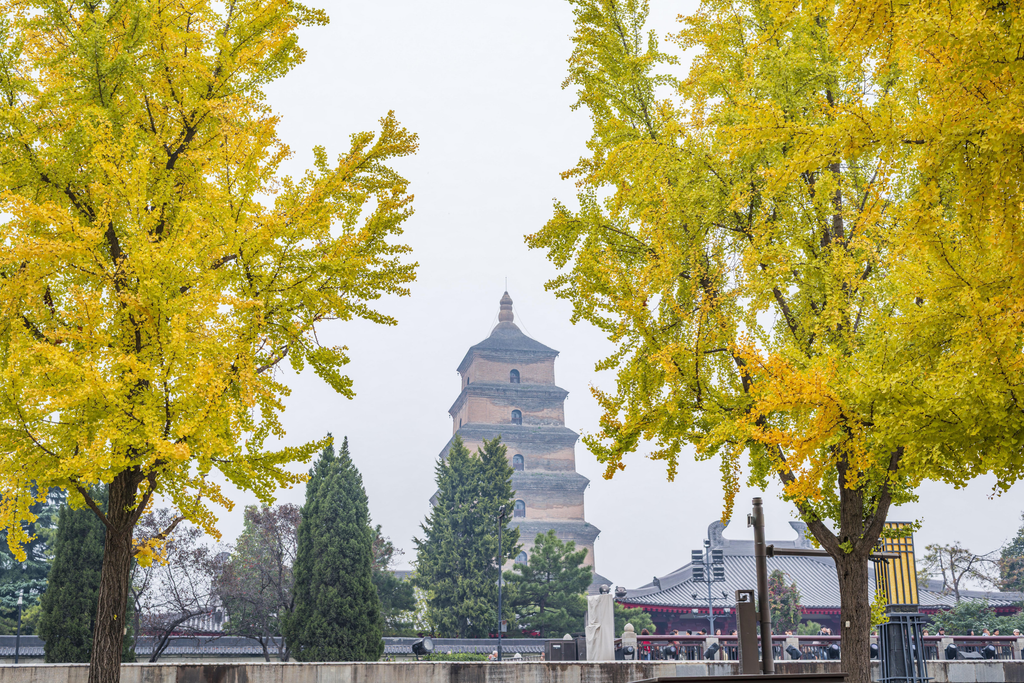
Golden ginkgo leaves frame the Giant Wild Goose Pagoda in Xi’an, Shaanxi province, October 24, 2026. Photo: Imaginechina
Key findings
- China tightened its annual PM2.5 standard from 35 to 30 µg/m³ in March 2026. At the end of October, 18 provincial capitals failed to meet the standard. At the end of October, 18 capitals were above the PM2.5 benchmark and six above the ozone benchmark on a rolling 12-month basis. Both lists were unchanged from September. All six capitals above the ozone benchmark were in northern China.
- PM2.5 rebounds became less widespread, but unfavourable weather offset some emission reductions. PM2.5 rose year-on-year in 16 capitals in October, down from 22 in September. Xi’an, Chengdu, and Guiyang recorded the largest increases. Unfavourable weather pushed concentrations up in all 16 cities and outweighed emission reductions in 10.
- Ozone increases spread for a second consecutive month. The number of capitals with year-on-year increases rose from 15 in August to 22 in September and 25 in October. Jinan, Xi’an, and Taiyuan recorded the largest increases. Southern capitals had the highest October levels, led by Guangzhou, Nanchang, and Nanjing.
- NO₂ concentrations fell year-on-year in most capitals in October. Lower emissions contributed to lower NO2 levels across most provincial capitals, except Lanzhou, Lhasa, Nanning, and Hohhot, although unfavourable weather offset these improvements in some cities.
18 capitals remained above the rolling PM2.5 benchmark
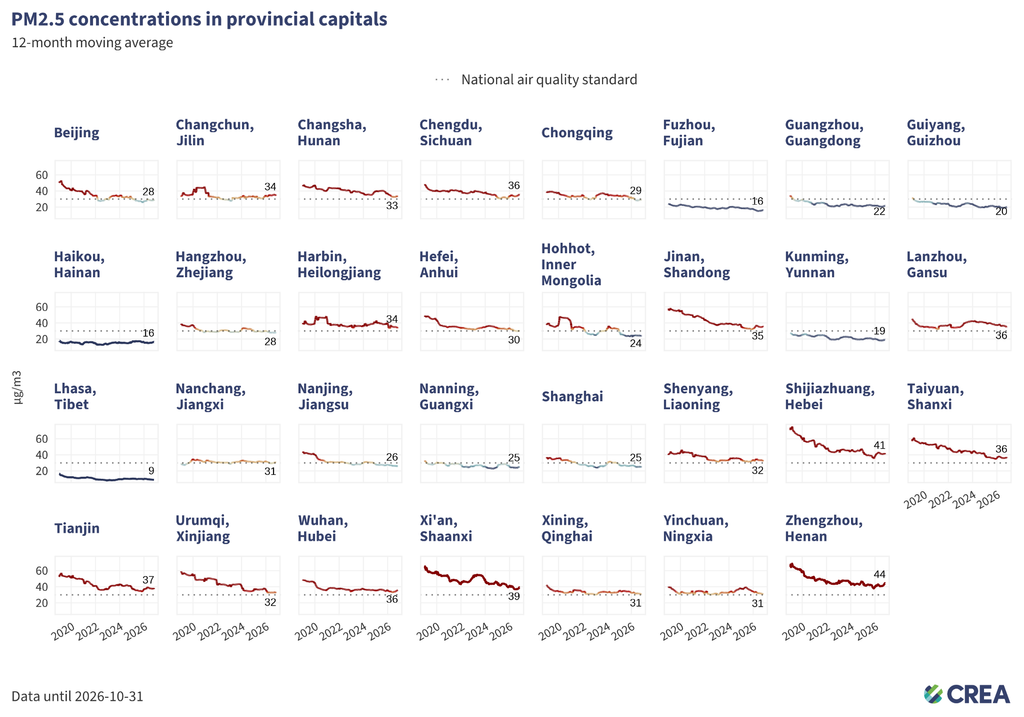
- At the end of October, 18 of China’s 31 provincial capitals had 12-month average PM2.5 concentrations above the national annual standard of 30 µg/m³, meaning they failed to meet the standard. The number and list of capitals were unchanged from September.
- The cities with the highest PM2.5 levels remained concentrated in Beijing–Tianjin–Hebei and surrounding areas. Zhengzhou (Henan) recorded the highest level for the third consecutive month at 44 µg/m³, followed by Shijiazhuang (Hebei) at 41 µg/m³, Xi’an (Shaanxi) at 39 µg/m³, and Tianjin at 37 µg/m³.
- Of the 18 capitals above the national PM2.5 benchmark, seven were in the three priority regions: Beijing–Tianjin–Hebei and surrounding areas, the Fenwei Plain, and the Yangtze River Delta. Five were in regions designated for stronger controls: the middle Yangtze urban cluster, Sichuan–Chongqing, and the Urumqi–Changji–Shihezi area of Xinjiang. These regions are expected to strengthen coordinated controls in line with the priority regions. The remaining six capitals were in northeastern and northwestern China.
PM2.5 rose year-on-year in 16 capitals
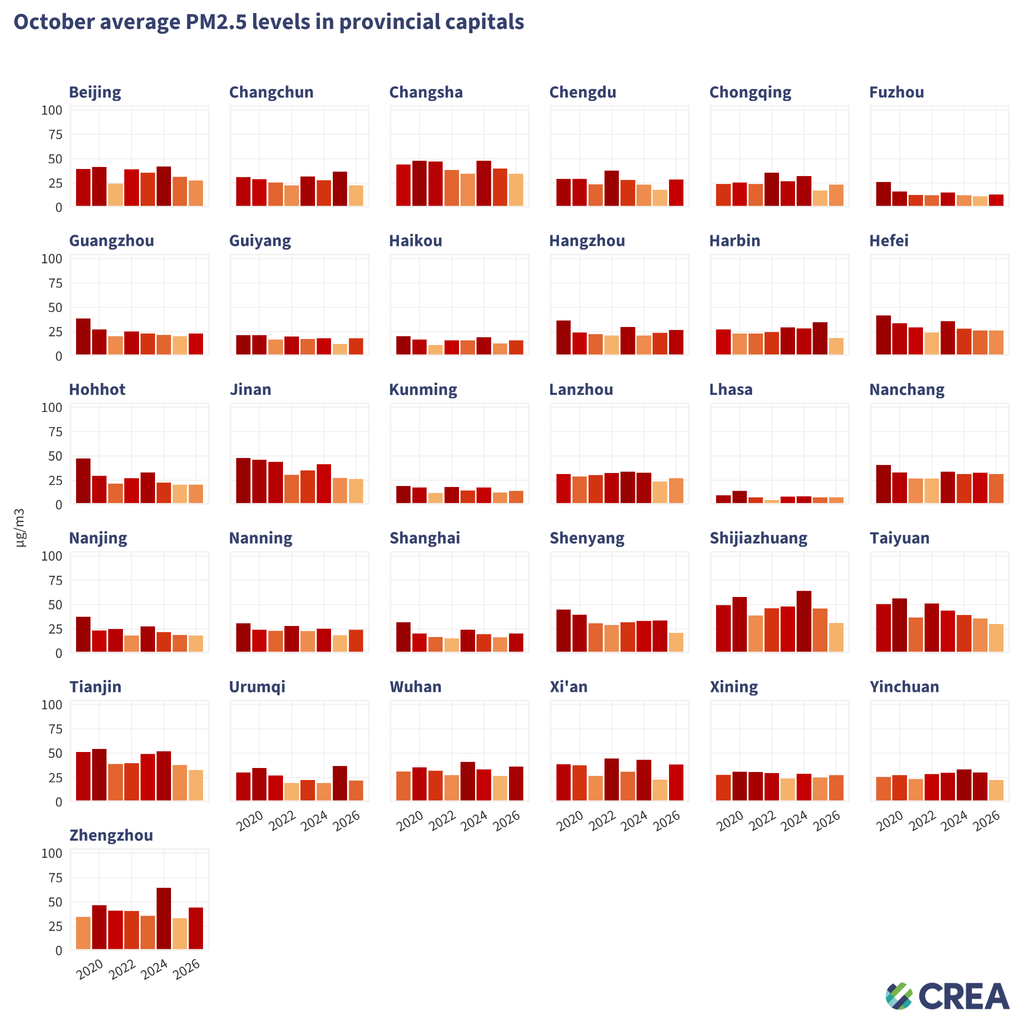
- Xi’an (+67%), Chengdu (+60%), and Guiyang (+49%) recorded the largest year-on-year increases. Wuhan and Chongqing also rose by 36% and 35%, respectively.
- Harbin (−46%), Urumqi (−41%), and Changchun (−39%) recorded the largest year-on-year declines.
Six provincial capitals exceeded the annual ozone limit
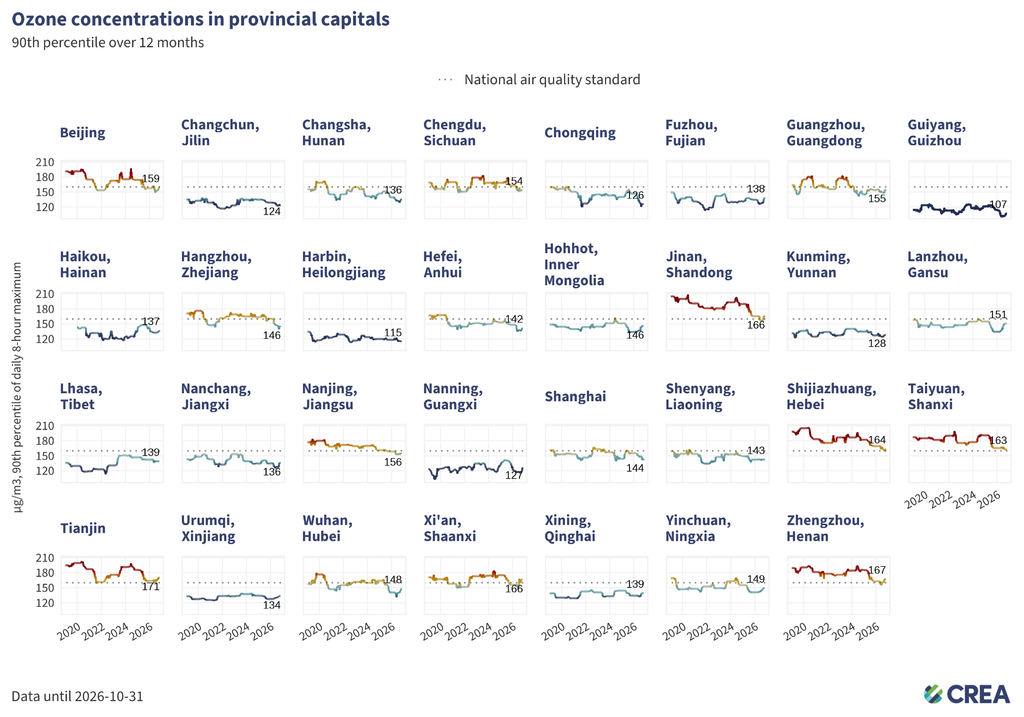
- At the end of October, six capitals recorded 12-month 90th percentile ozone concentrations above the national benchmark of 160 µg/m³.
- Tianjin recorded the highest level at 171 µg/m³, followed by Zhengzhou (Henan) at 167 µg/m³, and Xi’an (Shaanxi) at 166 µg/m³. The top three capitals were unchanged from September.
- Jinan, Shijiazhuang, and Taiyuan were the other capitals that exceeded the annual ozone limit. All six capitals were still in northern China, indicating continued regional ozone pressure.
Ozone rose year-on-year in 25 provincial capitals
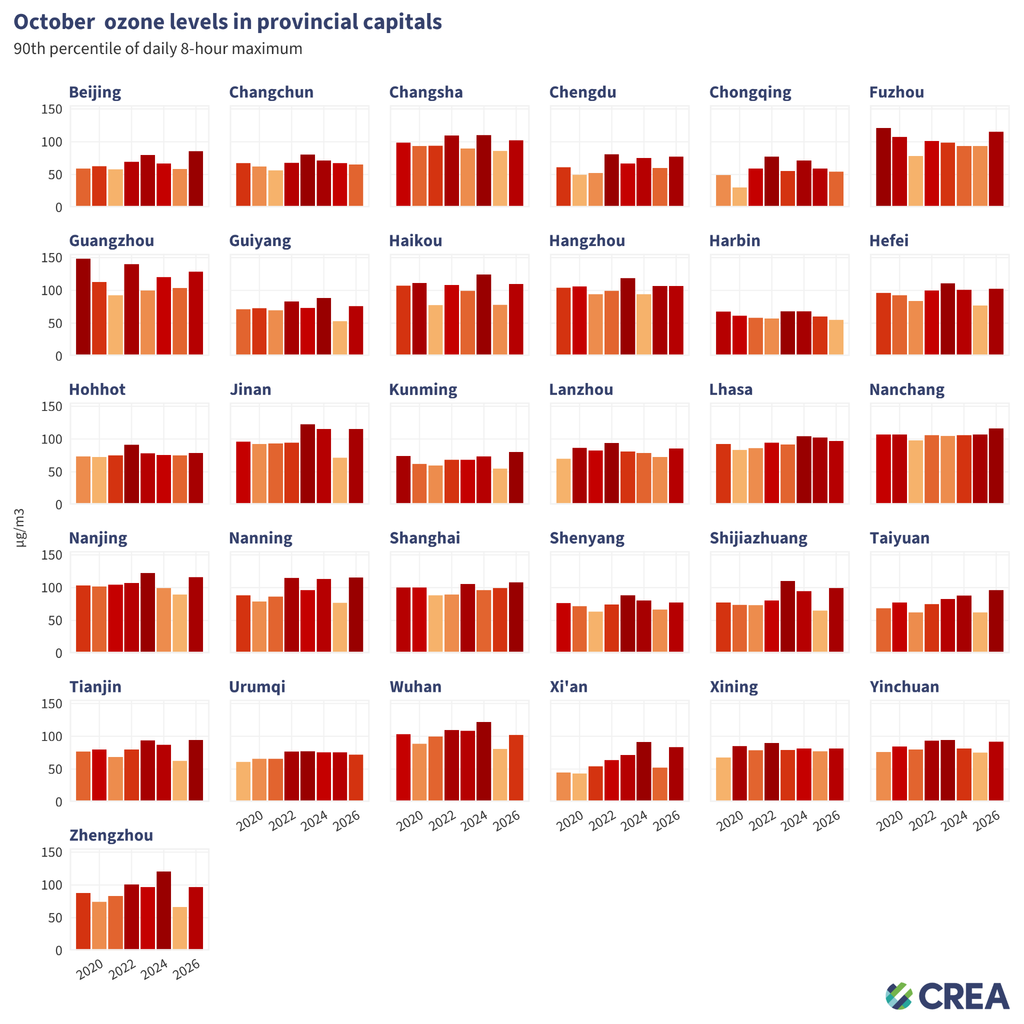
- The number of capitals with year-on-year ozone increases rose from 15 in August to 22 in September and 25 in October. Unfavourable weather contributed to ozone increases in many cities. National average rainfall was lower and sunshine duration higher in October 2026 compared to October 2025.
- Capitals in Beijing–Tianjin–Hebei and surrounding areas, as well as the Fenwei Plain, recorded the largest year-on-year ozone increases, led by Jinan (+61%), Xi’an (+60%), Taiyuan (+55%), Shijiazhuang (+52%), and Tianjin (+51%).
- Harbin (−9%), Chongqing (−8%) and Lhasa (−5%) recorded the largest ozone declines among the 31 capitals.
Northern and southern capitals face different pollution pressures
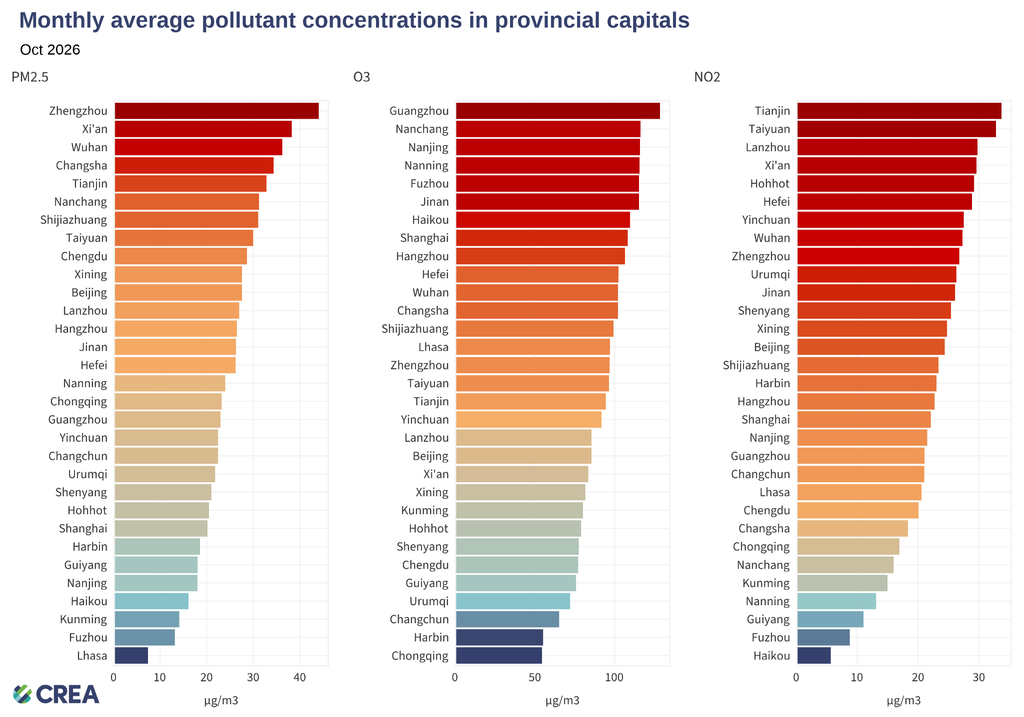
- Both northern and southern capitals faced PM2.5 pollution pressure. Zhengzhou recorded the highest October PM2.5 concentration at 44.1 µg/m³, followed by Xi’an (38.3 µg/m³) and Wuhan (36.3 µg/m³).
- Northern capitals continued to rank highest for NO₂. Tianjin had the highest concentration at 33.7 µg/m³, followed by Taiyuan (32.8 µg/m³), and Lanzhou (29.8 µg/m³).
- The capitals with the highest monthly ozone levels in October were mainly in southern China. Nine of the top ten were in the south, with Jinan being the exception. Guangzhou recorded the highest concentration at 128.5 µg/m³, followed by Nanchang (116.2 µg/m³) and Nanjing (115.8 µg/m³).
- Kunming and Guiyang had relatively low concentrations of all three pollutants in October. Haikou maintained low PM2.5 and NO₂ concentrations, despite its relatively high ozone levels.
Weather drove many PM2.5 and ozone increases
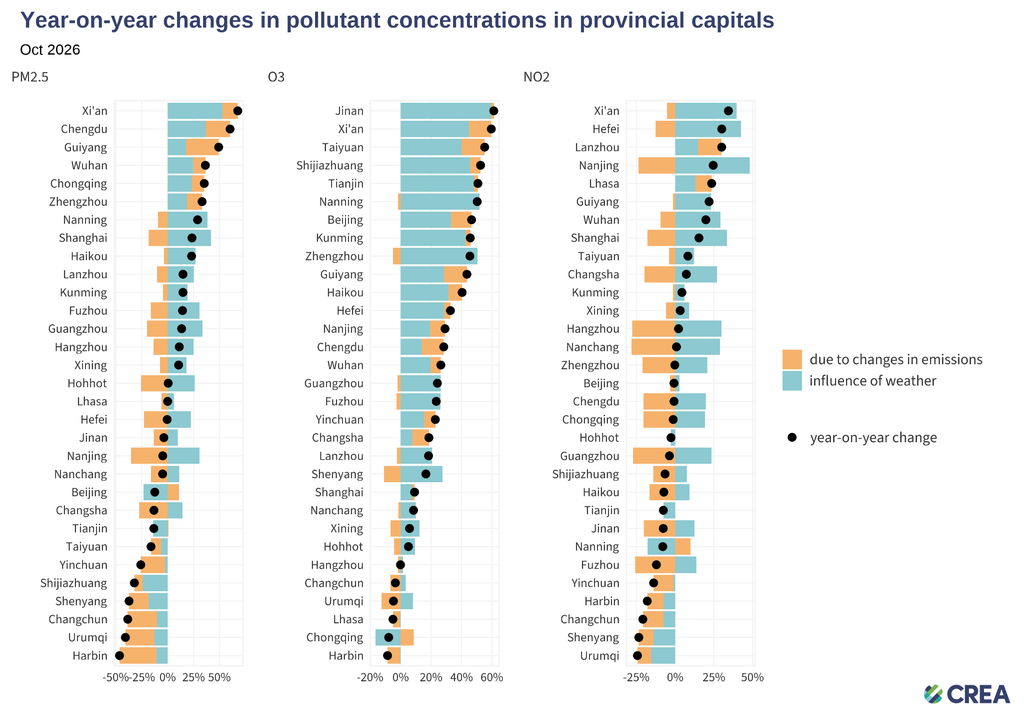
- Unfavourable weather pushed PM2.5 concentrations up in all 16 capitals, where concentrations all rose year-on-year. In 10 of these capitals, including Guangzhou, Fuzhou, and Shanghai, weather outweighed the benefits of emission reductions.
- Unfavourable weather and higher emissions contributed to ozone increases across most capitals in October. In Nanning, Zhengzhou, Guangzhou, and Fuzhou, unfavourable weather outweighed the benefits of emission reductions. Chongqing was an exception, with favourable weather being the main contributor to its ozone decline.
- Of the 14 capitals where NO₂ rose year-on-year, unfavourable weather outweighed the benefits of emission reductions in 12. Emission changes put upward pressure on NO₂ concentrations in only four of the 31 provincial capitals: Lanzhou, Lhasa, Nanning, and Hohhot.
Worst 7-day air pollution episodes by pollutant
PM2.5 (excluding sandstorms)
| City | Province | Dates | Average concentration | Highest daily concentration |
|---|---|---|---|---|
| Suihua | Heilongjiang | Oct 29 – Nov 04 | 117.4502 | 348.8914 |
| Liaoyuan | Jilin | Oct 30 – Nov 05 | 116.2127 | 345.0833 |
| Jiamusi | Heilongjiang | Oct 29 – Nov 04 | 83.7968 | 209.3333 |
| Jingzhou | Hubei | Oct 09 – Oct 15 | 83.1618 | 159.3998 |
| Qitaihe | Heilongjiang | Oct 29 – Nov 04 | 82.6493 | 124.3472 |
Sandstorms (PM2.5)
| City | Province | Dates | Average concentration | Highest daily concentration |
| Jiayuguan | Gansu | Oct 26 – Nov 01 | 34.9103 | 72.9583 |
| Jinchang | Gansu | Oct 25 – Oct 31 | 15.2083 | 59.8750 |
| Jinzhong | Shanxi | Oct 26 – Nov 01 | 13.8929 | 97.2500 |
| Luliang | Shanxi | Oct 26 – Nov 01 | 12.8413 | 89.8889 |
| Qingyang | Gansu | Oct 23 – Oct 29 | 12.5417 | 87.7917 |
Ozone
| City | Province | Dates | Average concentration | Highest daily concentration |
|---|---|---|---|---|
| Suzhou | Anhui | Oct 07 – Oct 13 | 190.8869 | 227.6250 |
| Huaibei | Anhui | Oct 07 – Oct 13 | 185.7321 | 225.3125 |
| Xinyu | Jiangxi | Oct 08 – Oct 14 | 185.2277 | 254.1875 |
| Jiujiang | Jiangxi | Oct 08 – Oct 14 | 184.6000 | 216.9750 |
| Jinan | Shandong | Oct 08 – Oct 14 | 179.1280 | 231.0833 |
NO2
| City | Province | Dates | Average concentration | Highest daily concentration |
|---|---|---|---|---|
| Lanzhou | Gansu | Oct 31 – Nov 06 | 45.7623 | 61.7738 |
| Hefei | Anhui | Oct 07 – Oct 13 | 45.2674 | 61.2593 |
| Yulin | Shaanxi | Oct 30 – Nov 05 | 44.3648 | 55.6938 |
| Wuhan | Hubei | Oct 06 – Oct 12 | 44.2029 | 55.7627 |
| Xi’an | Shaanxi | Oct 30 – Nov 05 | 42.4413 | 54.5721 |
Unit: µg/m3
Relevant analysis by CREA:
- China H1 2026 Air quality review: EV-related oil cuts emerge as a new driver for China’s clean air progress
- China’s air pollution control enters ‘deep water’ phase
- Why is China’s air pollution shifting west?
- China’s coal-to-chemicals growth risks climate goals
- Why China should get tougher on smog
- Carbon-intensive industries are worsening China’s ozone pollution