
Coal power generation rose for the sixth consecutive month as weak wind conditions continued to hold back clean power growth. A deadly coal mine explosion in Shanxi disrupted domestic production, driving coal output down and imports up. NEVs accounted for more than half of vehicle exports for the first time.
By Elizabeth Frost, China Analyst; Qi Qin, China Analyst; Miao Chien, Data Scientist; with contributions from Lauri Myllyvirta, Lead Analyst
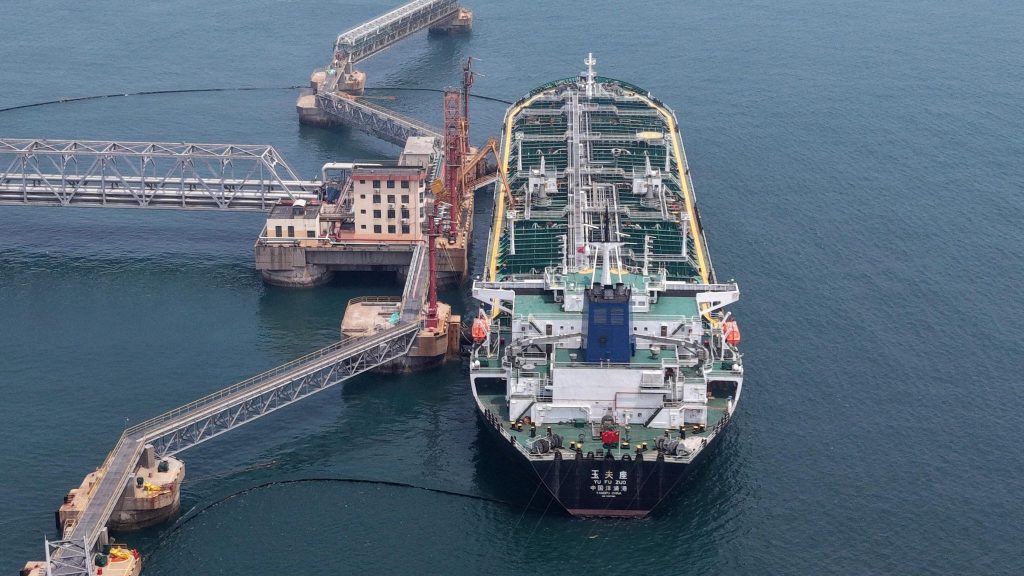
An oil tanker unloads imported crude oil at a port in Qingdao, east China’s Shandong province, June 2026. Photo: Imaginechina/Sipa USA/Alamy
Key findings
- Fossil power generation rose 0.5% year-on-year in June and 2% in Q2, but remained below its 2023 peak. Bad wind conditions and increased wind and solar curtailment left space for coal to inch up despite huge capacity increases. Weak utilisation of wind and solar capacity is storing up output growth for when grid management issues are resolved, but hurting new investment in the meantime.
- Thermal power commissioning reached a record high in the first five months of 2026, growing by 84% year-on-year. Solar and wind power capacity additions fell by 70% and 46% year-on-year, respectively, due to the high base in the same period last year ahead of a new pricing policy taking effect.
- In June, China’s crude oil imports reached a decade low, falling by 41.3% year-on-year, as shipping disruptions in the Strait of Hormuz continued. H1 imports fell by 11.4%. The pressure on oil supply also fed through to the refining sector: average daily throughput in June fell to its lowest level since 2021. Refiners are increasingly drawing on their own inventories to keep operations running.
- Domestic natural gas output and gas imports increased year-on-year in June, by 1.1% and 3.7%, respectively. This was the first month gas imports increased year-on-year since disruptions to Gulf shipments began in March, while H1 imports decreased by 3.4%.
- Coal output fell by almost 10% and imports increased by almost one third as a result of a coal mine explosion in Shanxi province in late May. In H1, coal output declined by 1.7%, matched by import growth of 1.7%.
- Overall industrial output remained weak. While steel output stabilised somewhat in June, as crude steel output grew by 0.4% year-on-year, it fell by 3% over H1, and cement output continued to fall by 5.6% year-on-year and 8% in H1, remaining at its lowest level for the same period since 2020. Chemical fibre output also continued to decline, while non-ferrous metal output remained elevated, up 3.9%.
- Solar cell production fell by 8.4% year-on-year, reflecting weaker domestic installations. Battery output remained strong in June, increasing 59.5% year-on-year, supported by energy storage demand and exports.
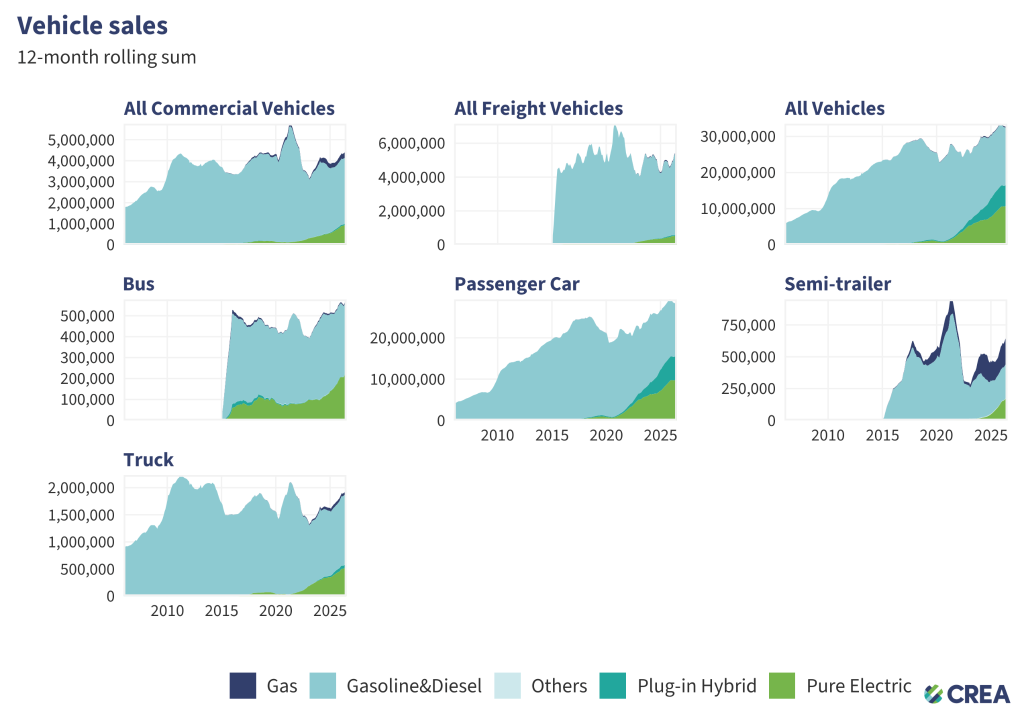
- New energy vehicles (NEVs) accounted for over 50% of monthly vehicle exports for the first time in June, as NEV exports surged 160% year-on-year. Domestic NEV sales also hit a new record, accounting for 58.5% of all sales in June. NEVs also dominated production, accounting for 57.5% of all vehicles produced in June. In H1 2026, NEV exports grew 120% year-on-year, while domestic sales and production were up 7.3% and 6.7%, respectively.
Coal power rose for the sixth consecutive month, as wind continued to underperform
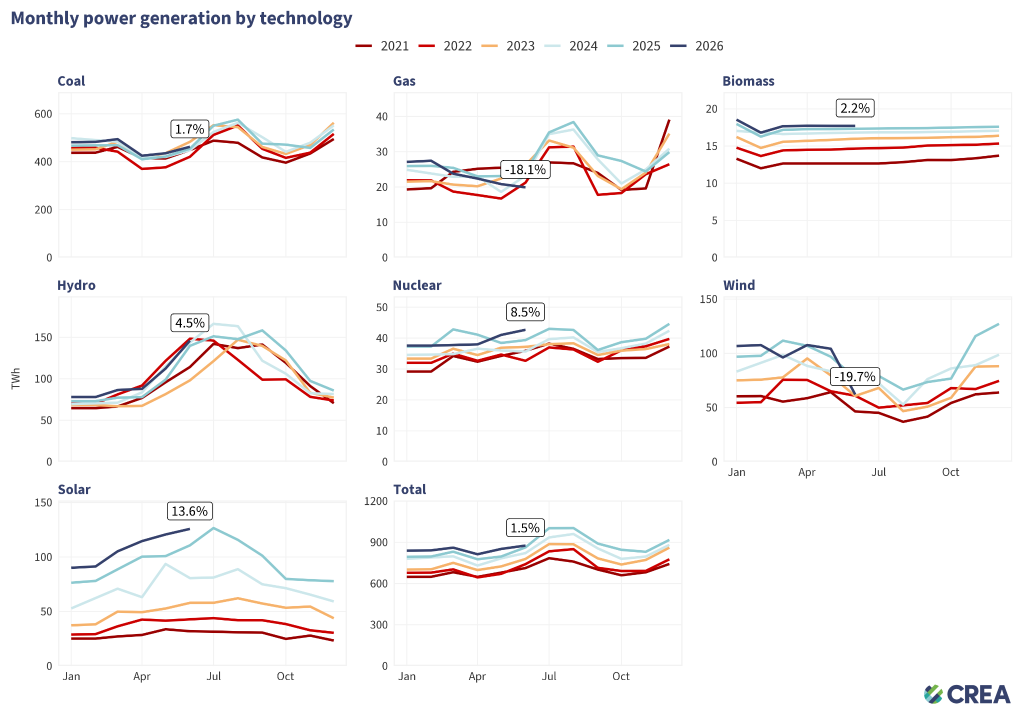
- Power generation by large-scale power producers rose 2% year-on-year in June, while total power generation is estimated to have increased by 1.5%.
- Coal power generation rose 1.7% year-on-year, marking the sixth consecutive month of increase. This came after China’s coal power generation fell in 2025 for the first time in a decade.
- Gas power generation dropped by 18.1% year-on-year, reflecting the ongoing impact of shipping disruptions in the Strait of Hormuz on natural gas supplies.
- Solar generation rose by 13.6% year-on-year.
- Wind generation dropped by 19.7% year-on-year, as June saw an unusually weak nationwide wind event.
- Hydropower and nuclear power generation grew 4.5% and 8.5%, respectively.
*Thermal, nuclear, and hydropower generation are based on National Bureau of Statistics (NBS) data. Solar generation is estimated from installed capacity and projected utilisation rates, adjusted for weather and average curtailment over the preceding three months. Starting this month, wind generation estimates are now calculated using a new wind projection model utilising NASA wind speed data. Figures for the most recent month are preliminary model estimates and may be revised once official generation and capacity data are released. Coal and gas generation are estimated by splitting total thermal generation using last year’s same-month fuel mix, adjusted by the year-on-year change in the fuel mix over the preceding three months.
Coal and natural gas imports rebound as oil imports fall to a decade low
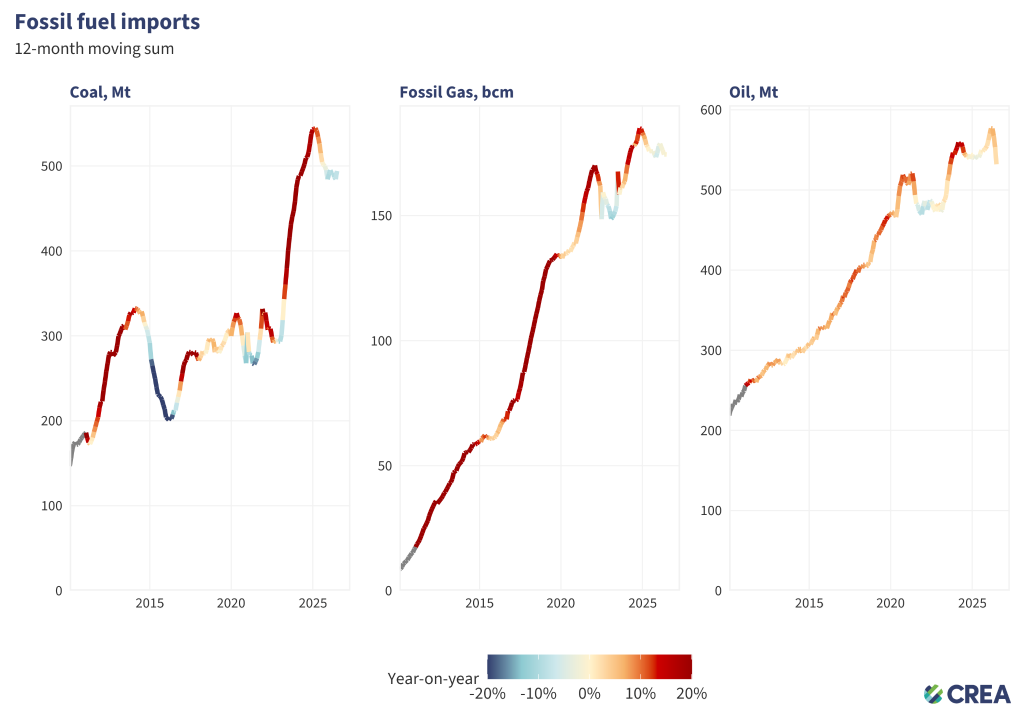
- China’s coal imports increased 29.5% year-on-year in June 2026, with import volumes for the first six months as a whole up 1.7% year-on-year. This increase was largely driven by a reduction in the domestic supply of coking coal caused by a deadly explosion at a coal mine in Shanxi province in May. Following the accident, 155 mines across Shanxi were closed for safety checks.
- China’s crude oil imports fell 41.3% year-on-year in June, reaching a decade low for the second consecutive month, showing the continued impact of disruptions to shipments through the Strait of Hormuz. For the first six months as a whole, oil import volumes declined 11.4% year-on-year.
- Natural gas imports increased by 3.7% year-on-year, marking the first increase since Gulf shipment disruptions began in March. The rebound was driven by various factors including low domestic output and declining storage levels. Cumulative imports so far this year were 3.4% lower than during the same period in 2025.
Coal output declined by almost 10%, while gas production grew slightly
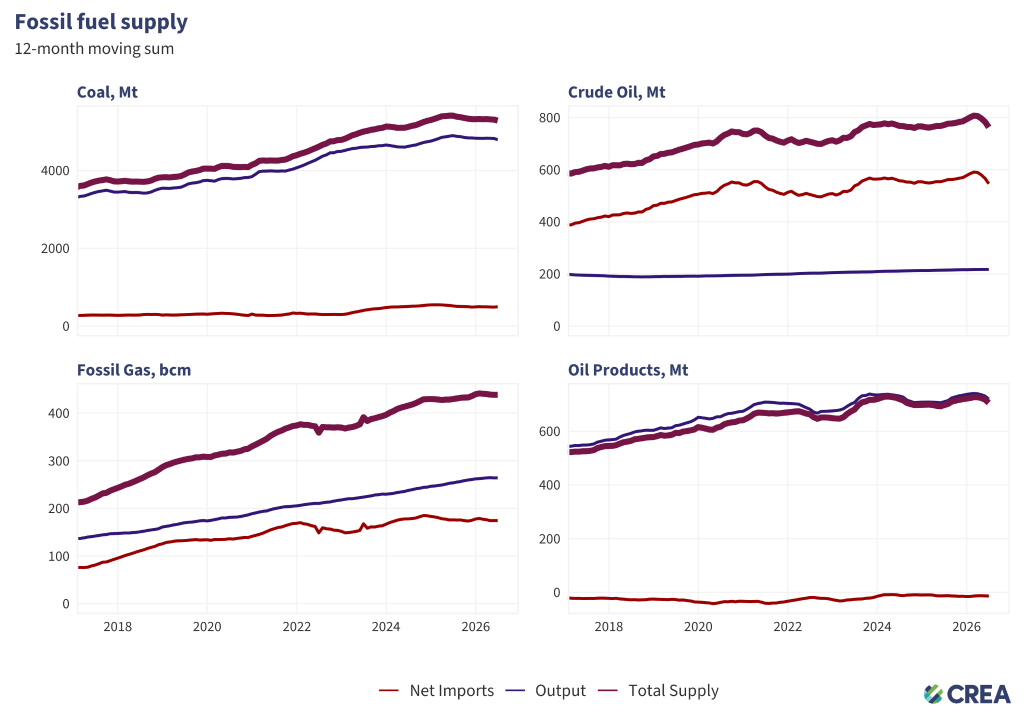
- Coal output fell 9.7% year-on-year in June 2026, bringing production in the first six months of 2026 down by 1.7% compared to the same period a year earlier, linked to the coal mine explosion in Shanxi province. Coal output has now gone eleven consecutive months without year-on-year growth.
- Domestic natural gas output increased 1.1% year-on-year in June, with total output across the first half of 2026 up 1.6%.
- Crude oil production decreased by 0.5%. Output in the first six months increased by 0.9%.
- Crude throughput dropped 17.7% year-on-year in June, nearly double the previous month’s decline, as the fall in crude oil imports continued to feed through to refinery activity in June. Refiners are increasingly drawing on their own inventories to keep operations running.
H1 industrial output growth remained weak
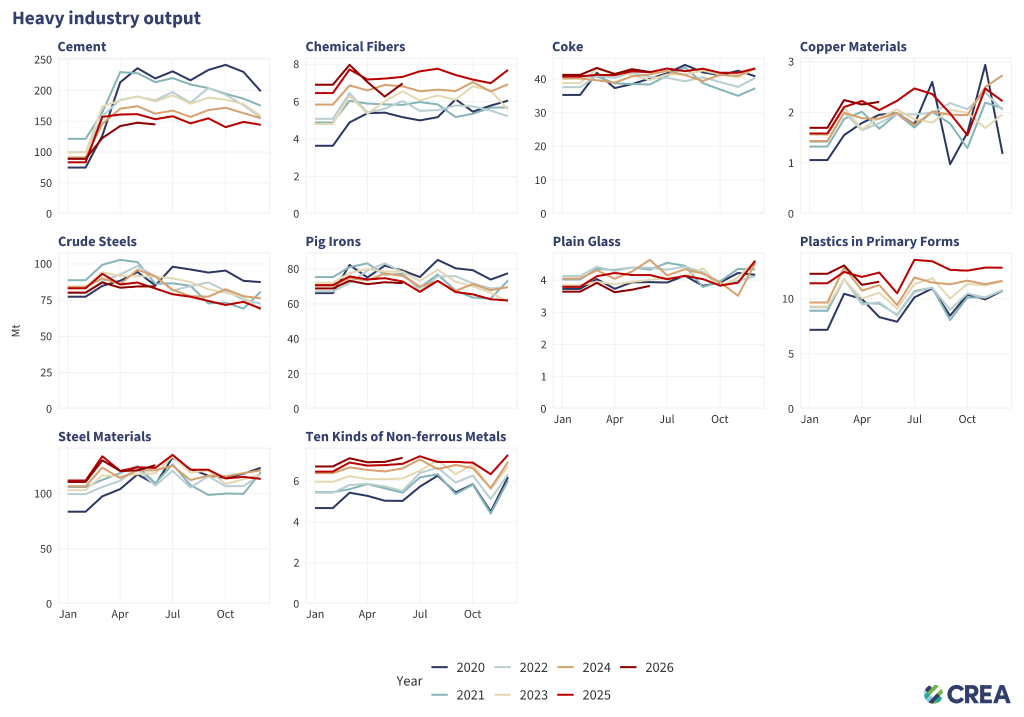
- The steel sector stabilised somewhat in June. Monthly crude steel output grew 0.4% year-on-year due to the base effect of a 9% drop in June 2025, but fell by 3% over H1. Ooutput of steel products remained at the same level as a year earlier. Pig iron production fell 0.9% year-on-year.
- Cement output continued to contract, falling 5.6% year-on-year in June, staying at its lowest level for the same period since 2020. Output in the first half of 2026 was down 8% year-on-year, reflecting the decline in China’s real estate sector.
- Chemical fibre output decreased 3.8% year-on-year, extending a decline that began in April, when output fell for the first time in 22 months. Non-ferrous metal output remained elevated, up 3.9% year-on-year.
- Sulfuric acid output fell by 10% due to shipping disruptions in the Strait of Hormuz, affecting supplies of this key input for phosphate fertiliser production.
The steel and cement industries are the largest CO2 emitters in China, when emissions from their electricity use are included. They are also bellwethers of real estate, infrastructure, and other fixed-asset investments that play an outsized role in China’s emissions and economy.
Tangshan blast furnace activity reached multi-year high, as daily crude steel output reached a five-year low
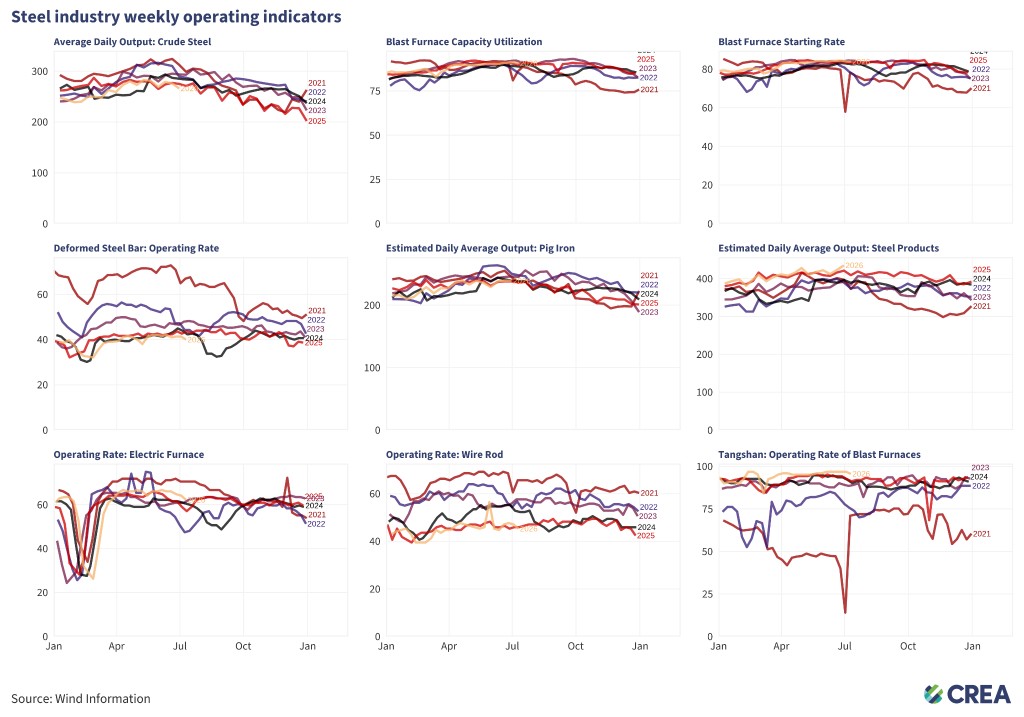
- Blast furnaces for steel production remained active in the second week of July, with a starting rate of 83.8% and utilisation reaching 90.5% — both among the highest levels seen so far this year. Electric furnace operating rates also rose to 62.2%, slightly above the same period last year.
- Daily pig iron output in late June 2026 was slightly above the level of the same period last year, while daily crude steel output reached a five-year low for the period.
- The operating rate of blast furnaces in Tangshan, China’s ‘steel capital’ and a significant source of air pollution in Beijing, reached 95.6% in early July, marking the third consecutive month where operating rates have reached a multiyear high.
Hebei Province industrial output is a bellwether of national priorities: when air quality and emissions are the priority, it is the most tightly regulated area due to its impact on Beijing’s pollution levels.
Thermal commissioning reached a record high
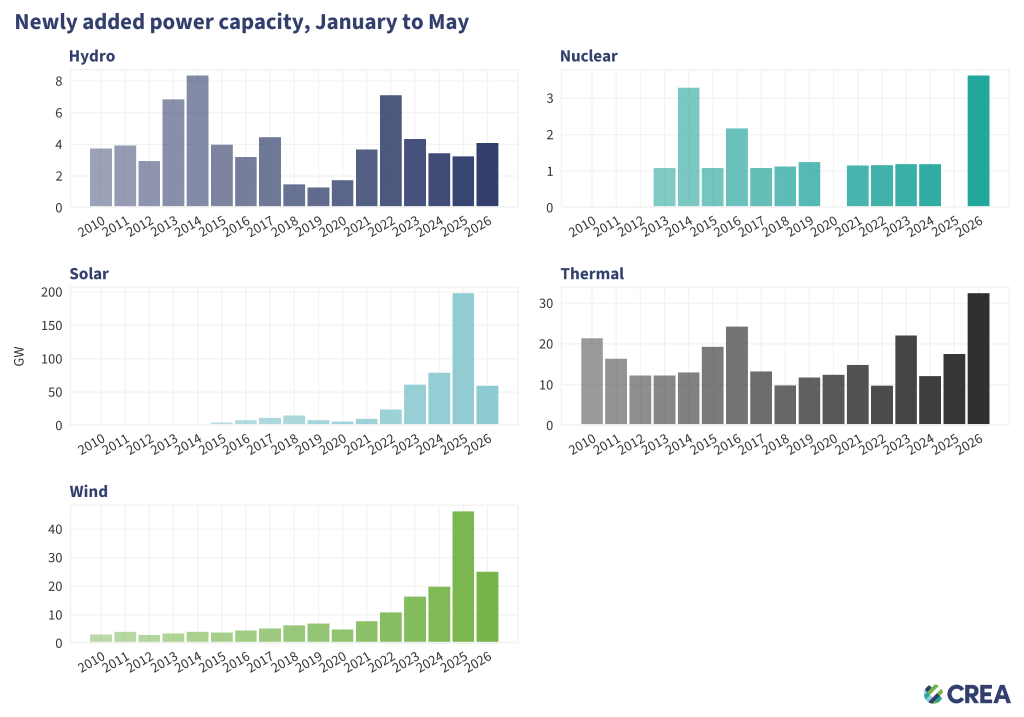
In the first five months of 2026, China added:
- 59.6 gigawatts (GW) of solar power capacity, down 70% from a very high baseline in May 2025, as developers rushed to meet a policy deadline to ensure their projects would be covered by the existing price-support framework;
- 25 GW of wind power capacity, down 46% from a similarly high baseline last year, but a lower drop than in solar as wind projects often have longer lead times;
- 32.4 GW of thermal power capacity, up 84% from last year, significantly outgrowing the growth in generation, leading to lower utilisation and higher curtailment of other power sources;
- 4.1 GW of hydro power capacity, up 24% from last year;
- 3.6 GW of nuclear power capacity, up from 0 GW in the same period last year.
In May 2026 alone, China added:
- 8.7 GW of solar power capacity, down 91% from last year;
- 3.8 GW of wind power capacity, down 85% from last year
- 4.4 GW of thermal power capacity, down 4% from last year;
- 1.6 GW of hydro power capacity;
- No new nuclear power capacity.
Large-scale clean energy bases took the lead in wind and solar installations
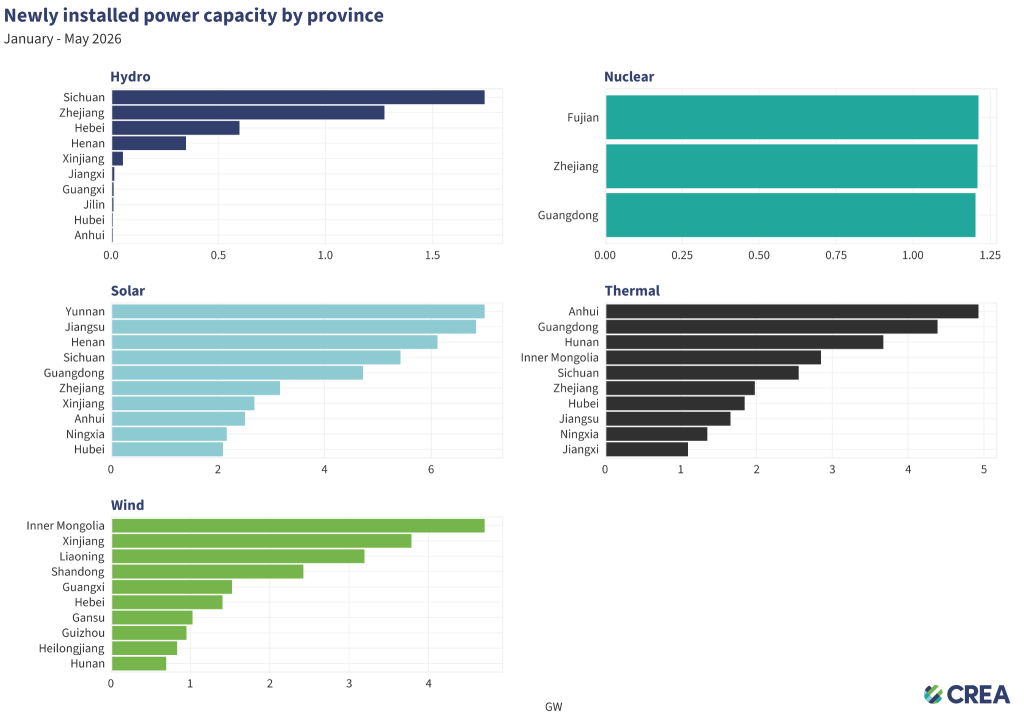
- Solar power installations are led by Yunnan, Jiangsu, Henan, and Sichuan. The strong showing of Yunnan and Sichuan is notable, as both are already major hydropower provinces and are set to host new hydro-wind-solar bases under the 15th Five-Year Plan (FYP).
- Inner Mongolia, Xinjiang, and Liaoning lead in wind development. These provinces are also part of the large-scale clean energy bases initiative under the 15th FYP.
- Thermal (coal) power additions accelerated in Guangdong, Anhui, Hunan, and Inner Mongolia. Guangdong has led the country in new thermal power capacity additions in recent years, and its coal-fired generation continued to rise in 2025. By contrast, coal generation declined in Anhui, Hunan, and Inner Mongolia despite the increase in new capacity.
Battery production surpassed 200 GWh, while solar production decline continued
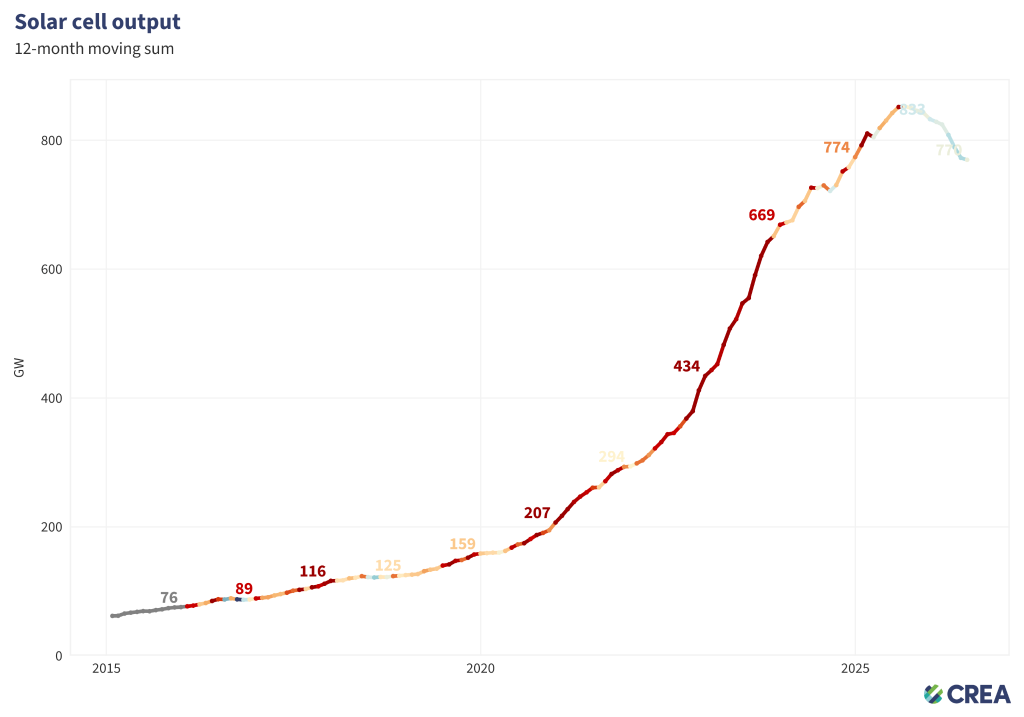
Solar cell production fell by 8.4% year-on-year in June, reflecting weaker domestic installations. While the decline has slowed compared to the previous two months, this likely reflects the higher output base in April and May 2025 ahead of the price-support mechanism policy deadline. However, output remained more than 50% higher than 2024 levels, highlighting that the overall development of the sector remains strong.
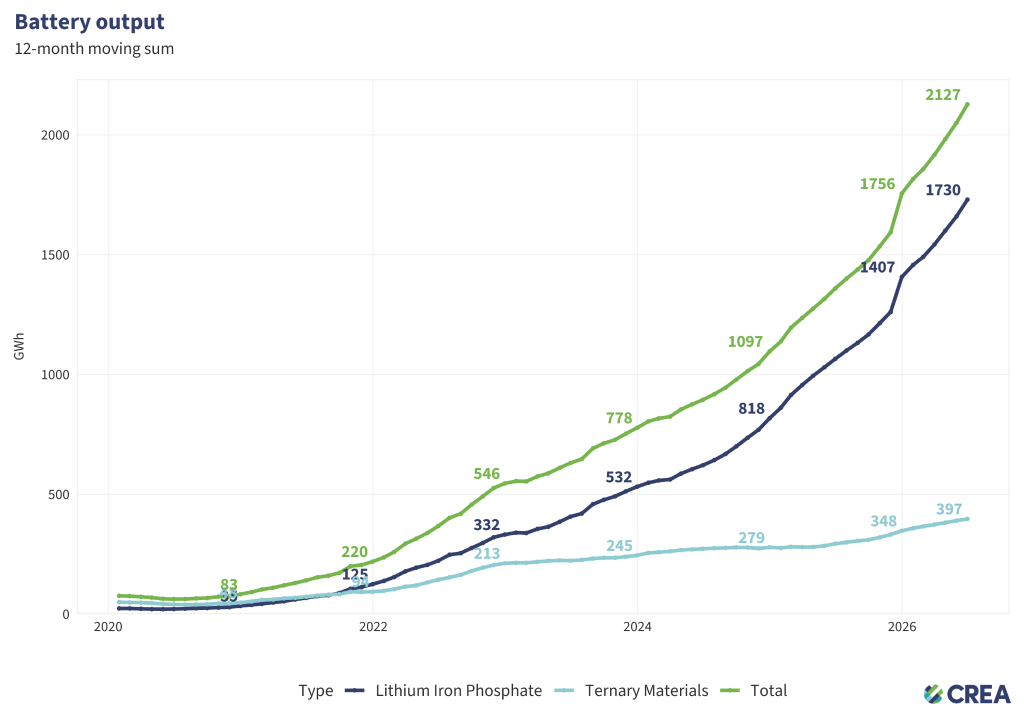
Battery production remained on a strong growth trajectory in June, reaching 206 GWh, a 59.5% increase from a year earlier, driven by robust demand from energy storage and export markets.
NEVs accounted for more than 50% of total monthly vehicle exports for the first time
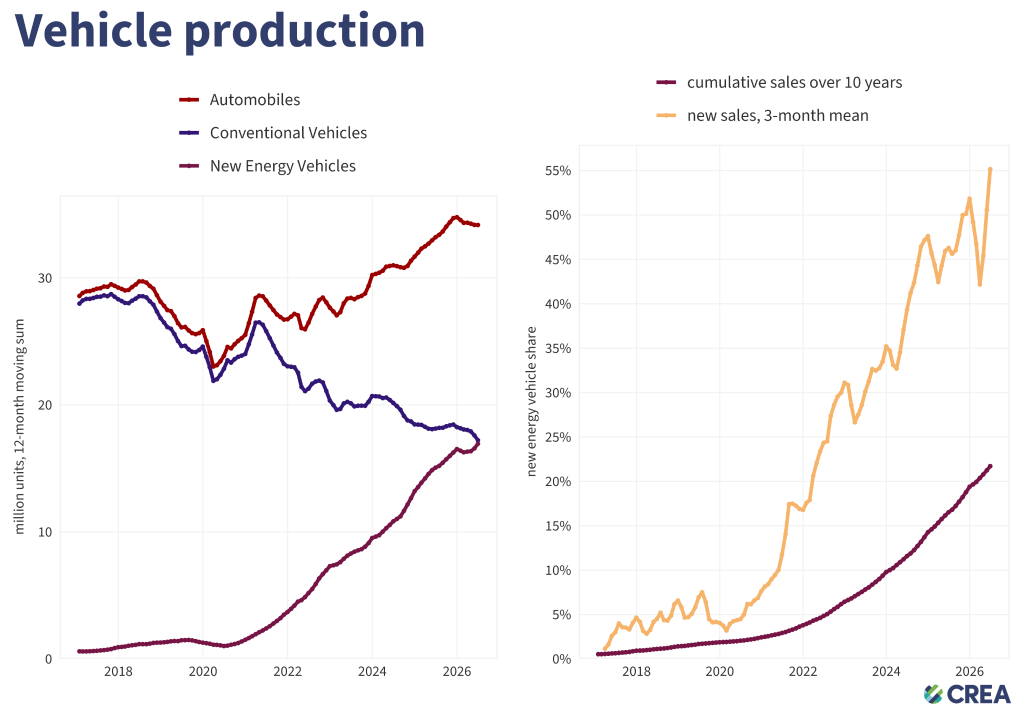
- NEV production continued to grow in June, rising 29.4% year-on-year. Production in the first half of 2026 was up 6%. Overall vehicle production declined 0.2% in June, bringing the share of NEVs to 57.5% of all vehicles produced, up from 44% in June last year.
- Exports of Chinese new energy vehicles surged by more than 160% year-on-year in June 2026, with monthly exports exceeding 500,000 vehicles for the first time. In June, NEVs accounted for over 50% of total monthly exports — another first.
- Domestic sales also set a new record in June, with over 1.6 million NEVs sold. This represents a 23.6% year-on-year increase. NEVs accounted for 58.5% of all sales.
Relevant analysis by CREA:
China’s new energy plan leaves emissions loose
China’s CO2 climbs 2% in early 2026 due to ‘wasted’ wind and solar
What drove China’s historic drop in power-sector emissions?
China’s new carbon metric leaves Germany-sized gap in its emissions
Reclaiming credibility in China’s steel industry: Climate ambition, financial resilience, and market trust
China’s 15th Five-Year Plan — Implications for climate and energy transition
Analysis: Clean energy drove more than a third of China’s GDP growth in 2025
Analysis: China’s CO2 emissions have now been ‘flat or falling’ for 21 months
Analysis: Coal power drops in China and India for first time in 52 years after clean-energy records
Built to peak: Coal power expansion runs out of room in China
China’s Climate Transition: Outlook 2025