What we do
CREA is focused on providing scientifically accurate and reliable data around air pollution with the aim of tracking trends, causes, and health impacts, as well as the solutions to air pollution.
We do this by providing research, modeling and data analysis on air pollution to support and enable the work of partners based on strategic priorities. Types of data we produce include:
- air quality and health impact assessments
- assessment on energy trends, electricity sector growth and Industrial output
- analysis of trends in air quality and sources of air pollution
- critical analysis of fossil fuel EIAs and legal evidence
- air quality monitoring using low-cost monitors
- emission inventories & source apportionment models
We have also developed the use of remote sensing data to support campaigns for clean air and clean energy, including pollution monitoring and visualization, identifying regulatory violations, and tracking energy sector and emissions trends.
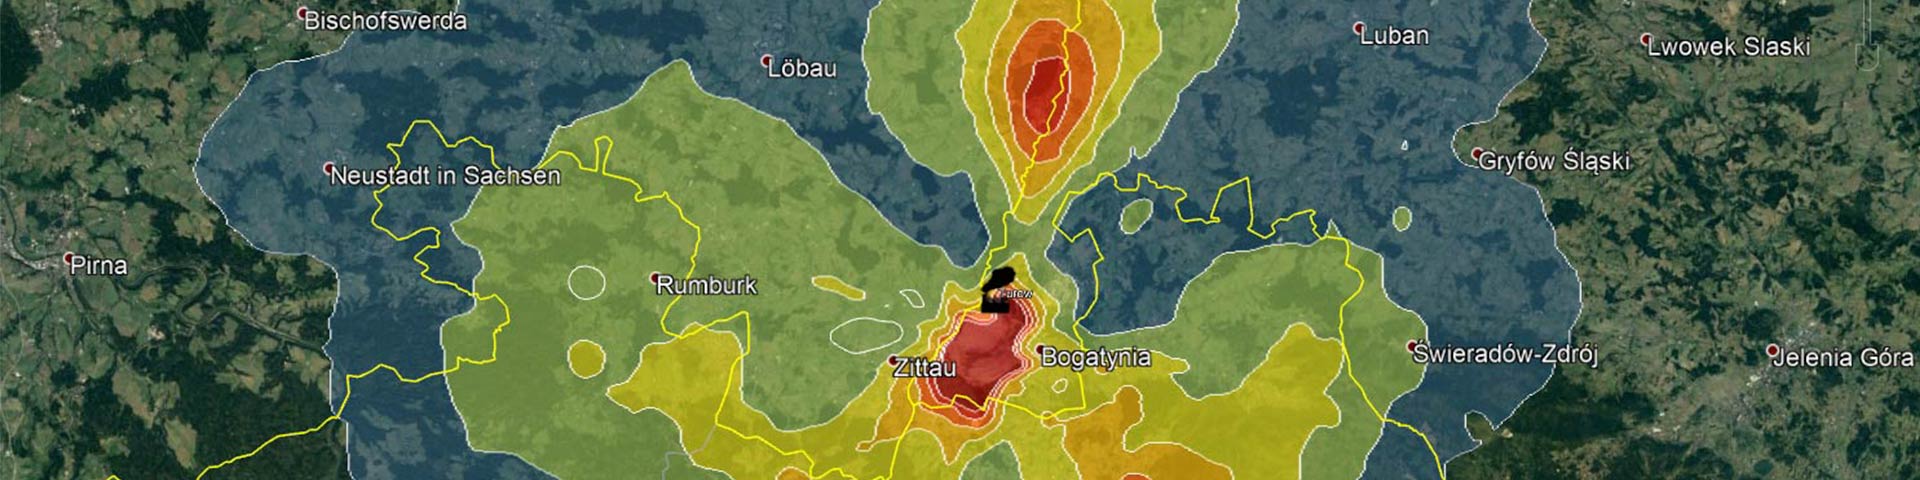
Pollutant dispersion modeling
We use state-of-the-art atmospheric models to figure out the sources of air pollution, and the impact of specific sources of pollution on air quality. How much would air quality improve if a coal power plant retired, or new vehicle emission standards were introduced?

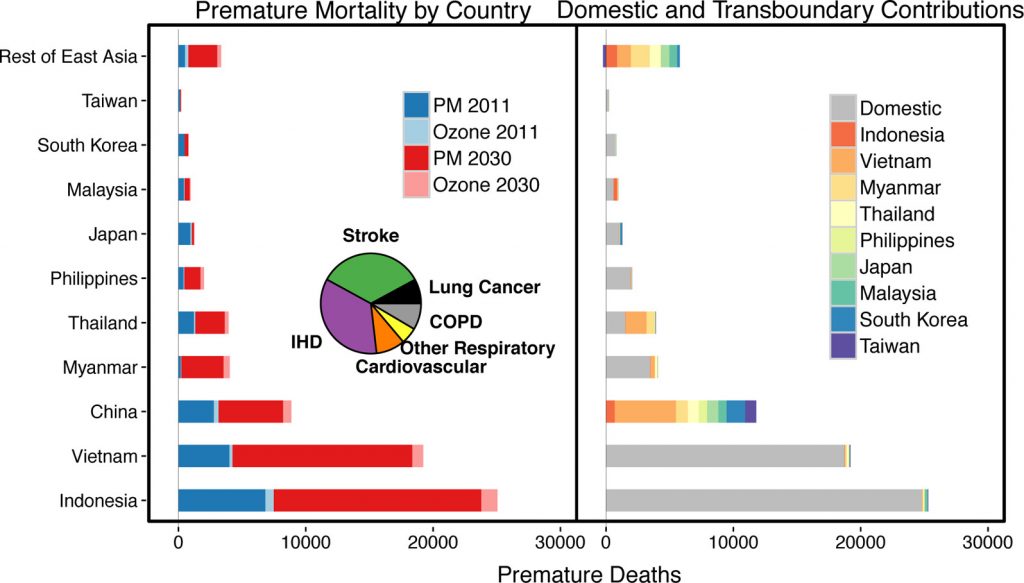
Health impact assessments
How many asthma attacks, deaths and hospital visits can be linked to air pollution in different places? What are the economic costs? Global health and population databases combined with air quality data and health risk models enable us to answer these questions. Combined with atmospheric modeling, we can assess the health impacts of specific sources of emissions, and the health costs or benefits of policies and investment projects.
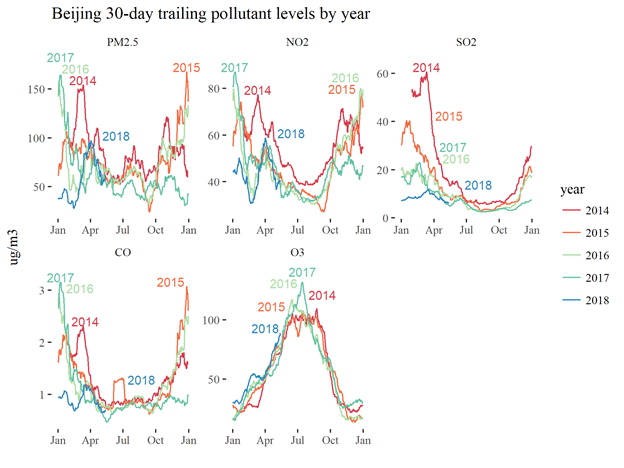
Tracking air quality trends
We track progress towards air quality targets using data from air pollution monitoring stations, low cost monitors and satellites to determine whether air quality is getting better or worse. Combining air quality time series with weather data enables us to disentangle the effect of changing weather conditions and the effect of changes in emissions and policies.
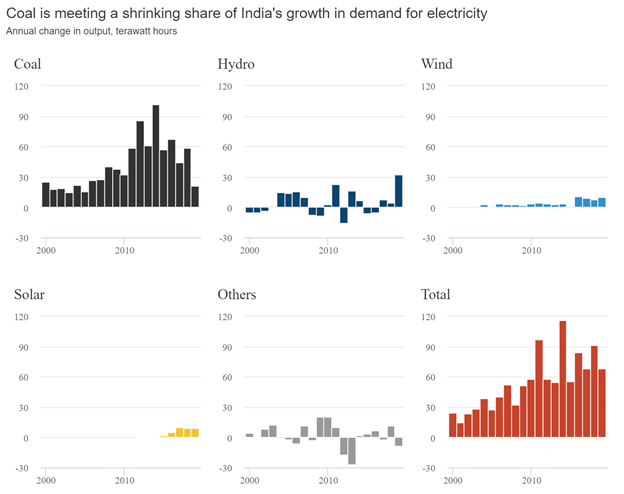
Analysis of air pollutant emissions trends
Air quality improvements depend on reducing pollutant emissions from different sources, ranging from power generation and industry to transport, households and agriculture. We track power and industrial sector trends to understand pressures on air quality.
Air pollution episodes
Where did an air pollution episode come from? We use back-trajectory modeling to make sense of the pollution sources contributing to smog episodes, in real time.

Satellite data analysis
Eye-in-the-sky technology enables us to pinpoint emissions sources and track air quality and emissions trends in areas where reliable emissions statistics and air quality monitoring are not available – that’s pretty much the whole world.

Our research has already been widely published, and we will continue to develop policy-relevant health impact assessment methods as well as our tracking around emission inventories. Our previously published work can be read here.
Some of our previously published work around health impacts includes the following reports:
Europe’s dark cloud: How coal-burning countries make their neighbours sick
Coal pollution and its health impacts travel far beyond borders, and a full coal phase-out in the EU would bring enormous benefits for all citizens across the continent, shows a report from the WWF European Policy Office, Health and Environment Alliance (HEAL), Climate Action Network (CAN) Europe and Sandbag.
Projecting the air quality, toxic and health impacts of the Rampal coal-fired power plant
This report analyses the impacts of the proposed 1,320MW Maitree coal-fired power plant at Rampa, that would be among the largest point sources of air pollution in all of Bangladesh. Avoiding emissions from large industrial sources such as coal-fired power plants will prevent unnecessary public health impacts in Bangladesh and neighboring countries.
Health impacts and social costs of Eskom’s proposed non-compliance withSouth Africa’s air emission standards
This paper applies available modeling tools implementable inGIS software to provide an estimate of the health damages and economic costs that would be avoided by requiring Eskom to comply fully with the national air emission standards.
Examples of the tracking fossil fuels in China and India can be read here:
Why China’s CO2 emissions grew 4% during the first half of 2019
This article based on an assessment of various sources of Chinese government and financial sector data, I explore the drivers of these trends and the outlook for the next year or two.
India’s CO2 emissions growth poised to slow sharply in 2019
This analysis based on data from various ministries responsible for electricity, coal, oil, gas and foreign trade, shows that emissions in India increased by 2% in the first eight months of the year, a lower rate than any annual increase since 2001.
We are always looking for new partners and new ways to make a difference.