Authors: Vaibhav Raghunandan and Luke Wickenden; Data scientist: Panda Rushwood
Russian fossil fuel export earnings rose by 7% in February, with easing sanctions projected to narrow the discount on Russian oil.
CORRIGENDUM, 16 March 2026 – The initial March 2026 monthly analysis stated that, ‘Twenty-three vessels delivered EUR 800 bn of Russian crude oil and oil products while flying a false flag‘, and it should read, ‘Twenty-three vessels delivered EUR 800 mn of Russian crude oil and oil products while flying a false flag.‘ This has been updated in the analysis. We apologise for the inconvenience.
Key findings
- In February 2026, Russia’s monthly fossil fuel export revenues saw a 7% month-on-month increase to EUR 492 mn per day. There was a marginal 1% month-on-month increase in volumes in February.
- In February 2026, approximately 6.9 mn tonnes (EUR 2.3 bn) of Russian crude was out at sea without a known buyer. Waivers that allow this oil to be sold to global markets will not merely add revenues to Russian coffers but also narrow the discount on Russian crude, therefore generating more tax revenue for the Kremlin.
- Since the EU’s ban on imports of oil products made from Russian crude came into effect on 21 January 2026, 17 shipments of oil products refined from refineries using Russian crude — and identified as high risk according to EU guidance — have entered the bloc, unloading before the end of February.
- China’s total seaborne crude imports, which typically see reductions in February due to the Lunar New Year, registered a 17% rise. Russian volumes saw the biggest gain, with imports doubling year-on-year.
- India’s Russian crude imports recorded a 19% drop in February, while total imports saw a more modest 9% reduction. Russia was still India’s largest supplier in February, with imports constituting 20% of the total share.
- G7+ tankers transported 33% of Russian crude oil exports in February, while non-sanctioned ‘shadow’ tankers accounted for 11% of the total. The largest share, 56%, was carried by sanctioned ‘shadow’ tankers.
- In February 2026, 63 ‘shadow’ vessels were operating under false flags at the end of the month. Twenty-three vessels delivered EUR 800 mn of Russian crude oil and oil products while flying a false flag.
- Just under a quarter of the volume of Russian oil (24%) transported by tankers flying false flags (473 thousand tonnes, valued at EUR 176 mn) transited the Danish Straits in February, carried by nine vessels.
- Following the sanctioning of Rosneft and Lukoil, seaborne crude export volumes sold by the two companies from December 2025 to February 2026 witnessed an 83% year-on-year drop totalling 3.5 mn tonnes.
- Disruptions in the Strait of Hormuz have led to an estimated 60 mn tonnes of crude oil and 7 mn tonnes of LNG flows per month being threatened. An estimated 89% of crude oil and 66% of the total LNG shipped through that choke point is destined for East and South Asian countries.
- The current energy crisis provides the EU with an opportunity to invest more in renewable energy rather than pivoting towards filling the gap in LNG supply from other sources. Redirecting spot market purchases of Qatar LNG in 2025 toward solar installations would have added 1.75 GWh of solar power each month.
Trends in total export revenue

- In February 2026, Russia’s monthly fossil fuel export revenues saw a 7% month-on-month increase to EUR 492 mn per day. There was a marginal 1% month-on-month increase in export volumes in February.
- There was a 13% month-on-month increase in crude oil export revenues to EUR 232 mn per day. This was largely led by a significant 14% increase in revenues from seaborne crude, which totalled EUR 173 mn per day. The revenue growth from seaborne crude was also led by a 4% increase in export volumes in February.
- Pipeline crude export revenues saw a 9% month-on-month increase to EUR 58 mn per day.
- Liquefied natural gas (LNG) revenues increased by 7% to EUR 45 mn per day, despite a 1% decrease in exported volumes.
- Pipeline gas revenues saw a 5% increase to EUR 63 mn per day.
- Revenues from exports of seaborne oil products saw a 14% month-on-month increase, earning Russia EUR 173 mn per day.
- Coal export revenues reduced by 16% month-on-month to EUR 38 mn per day.
| Sanctioned Russian oil major’s exports crash but new companies step in and keep trade flowing |
 In October 2025, Rosneft and Lukoil were sanctioned by the U.S. Office of Foreign Assets Control (OFAC) and the UK, while the EU introduced a full transaction ban on major companies, which included Rosneft, in its 19th sanctions package. Sanctioning specific companies rather than all Russian oil has enabled a circumvention of the sanctions by routing Russian oil sales through newly created or rebranded intermediary trading companies or by selling to non-sanctioned Russian companies. Several of the new companies emerged in 2025. RusExport and Redwood Global Supply Group specifically went on to export 5.5 and 11.5 mn tonnes of Russian crude, respectively, between December 2025 and February 2026. The sanctioned entities Rosneft and Lukoil previously accounted for about half of Russia’s total oil production. The wind-down period for the US sanctions on Rosneft and Lukoil ended on 21 November 2025. As a result of the sanctions, the total seaborne volume of crude sold by the two companies from December 2025 to February 2026 totalled 3.5 mn tonnes, an 83% drop from the same period the prior year. Initially, sanctions on Russian oil giants Rosneft and Lukoil widened the export price discount between Urals crude and Brent. This discount widening significantly reduced Russia’s oil export earnings; meanwhile, the volume of exported Russian crude remained stable. However, with the US granting a waiver to allow India to buy Russian oil from sanctioned companies amid the recently erupted Iranian war, this will likely mitigate the impact of designating Russian oil giants and increase shipments to destinations that had started to reduce supply from Moscow. |
Who is buying Russia’s fossil fuels?
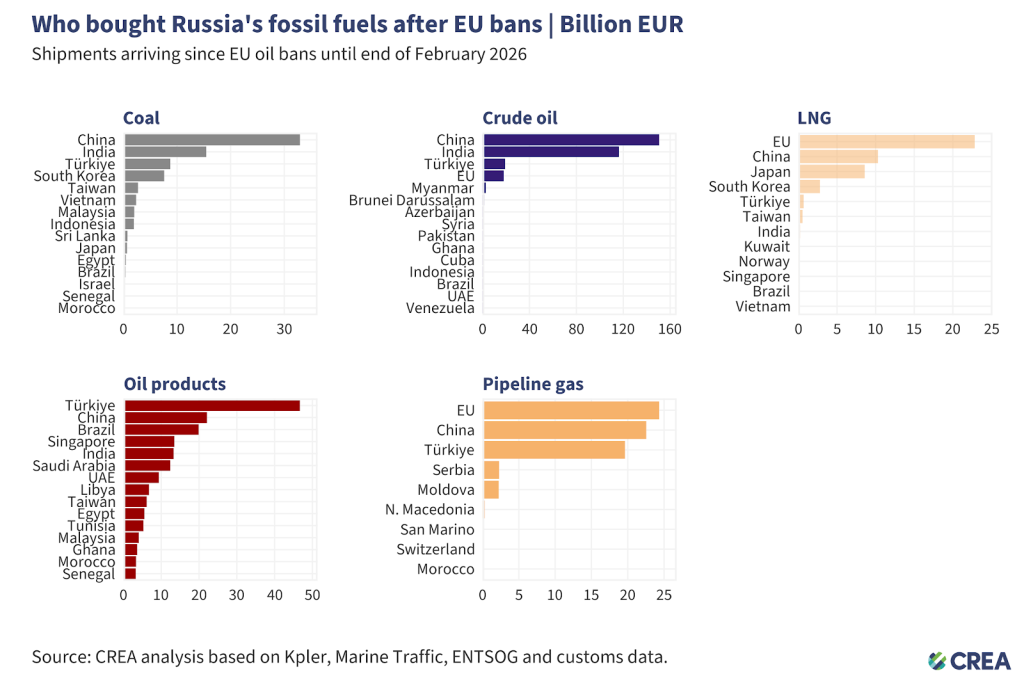
- Russia’s fossil fuel exports remain highly concentrated, with China dominating purchases of coal and crude oil, Turkiye dominating purchases of oil products, and the EU remaining the largest buyer of LNG and pipeline gas — showing Moscow’s dependence on a narrow set of key customers.
- Coal: From 5 December 2022 until the end of February 2026, China purchased 43% of all Russian coal exports. India (20%), Turkiye (11%), South Korea (10%), and Taiwan (4%) round out the top five buyers’ list.
- Crude oil: China has bought 48% of Russia’s crude exports, followed by India (37%), Turkiye (6%), and the EU (6%).
- Oil products: Turkiye, the largest buyer, has purchased 27% of Russia’s oil product exports, followed by China (13%), Brazil (11%), and Singapore (8%).
- LNG: The EU remains the largest buyer of Russian LNG, accounting for almost half (49%) of Russia’s total LNG exports, followed by China (22%) and Japan (19%).
- Pipeline gas: The EU is the largest buyer, purchasing 34% of Russia’s pipeline gas exports, followed by China (32%) and Turkiye (27%).
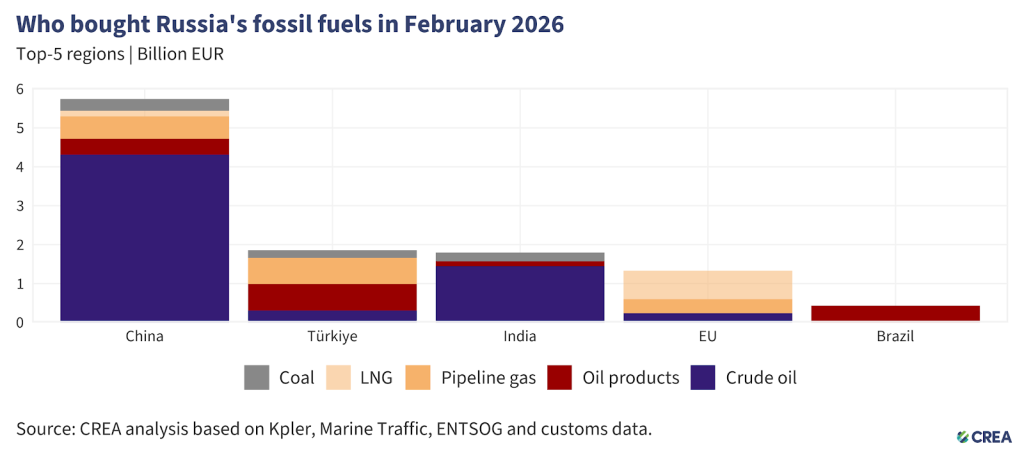
- In February 2026, China remained the largest global buyer of Russian fossil fuels, accounting for 52% (EUR 5.7 bn) of Russia’s export revenues from the top five importers. Crude oil made up 75% (EUR 4.3 bn) of China’s purchases, followed by pipeline gas (EUR 568 mn) and oil products (EUR 410 mn). Coal (EUR 308 mn) and LNG (EUR 146 mn) constituted the remainder of their imports.
- China’s total seaborne crude imports saw a 5% month-on-month decrease in February, while imports from Russia reduced by 3%, constituting 16% of their total imports. Typically, Chinese imports see mild reductions in February linked to the Lunar New Year, but in a sharp change, imports from Russia almost doubled year-on-year in February 2026, while total imports saw a much lower 17% gain.
- A significant reason for the increase in China’s purchases from Russia is a rise in their imports of Eastern Siberia–Pacific Ocean (ESPO) grade crude oil, which rose by 4% month-on-month to the highest volumes since July 2025. Urals imports, meanwhile, saw a 13% reduction — but still remained at their second-highest volumes ever.
- Turkiye was the second-highest buyer of Russian fossil fuels in February 2026, importing a total of EUR 1.8 bn of Russian hydrocarbons, overtaking India, which was the second-largest importer of Russian fossil fuels in January 2026. Oil products constituted 37% of Turkiye’s purchases, totalling EUR 681 mn. Pipeline gas imports accounted for 36% (EUR 674 mn), while coal (EUR 192 mn) and crude oil (EUR 304 mn) constituted the remainder of their monthly imports.
- Turkiye’s imports of Russian crude increased by 15% in February, significantly more than the country’s mere 2% month-on-month increase in total imports.
- The total crude imports of the STAR refinery — owned by Azerbaijan’s state energy company SOCAR — saw a 4% month-on-month increase, with Russian volumes accounting for almost the entire increase and rising 6% month-on-month.
- Turkiye’s imports of oil products saw an 11% month-on-month reduction in February, with Russian volumes dropping by a much deeper 20%.
- India was the third largest importer, purchasing EUR 1.8 bn of Russian hydrocarbons in February. Crude oil constituted the largest share at 81% (EUR 1.4 bn), followed by coal (EUR 223 mn). Oil products (EUR 121 mn) constituted the remainder of India’s imports from Russia.
- While India’s Russian crude imports recorded a 19% reduction in February, total imports saw a more modest 9% reduction. Russia was still India’s biggest crude oil supplier in February, with imports constituting 20% of the total share.
- In February, the Jamnagar refinery received six shipments of Russian crude. Two of these shipments were Rosneft cargoes shipped before the OFAC sanctions came into effect. The others were sold by new companies set up by Russia to facilitate the sale of its oil despite sanctions. This was Jamnagar’s first shipment of Russian oil after a pause in January.
- The EU-sanctioned Vadinar refinery, which is exclusively reliant on Russian crude, saw a 28% month-on-month reduction in its imports in February. The refinery pushed its planned maintenance from February to April this year.
- The EU was the fourth-largest buyer of Russian fossil fuels, accounting for 12% (EUR 1.3 bn) of Russia’s export revenues from the top five importers. Fifty-five percent of these imports (EUR 734 mn) consisted of LNG. Pipeline gas (EUR 355 mn) and crude oil (EUR 240 mn) constituted the remainder of EU imports.
- Brazil was the fifth-largest importer in February, with purchases totalling EUR 433 mn, all of which consisted of Russian oil products.
| Russia looks to benefit from Strait of Hormuz closure |
| The US-Israel strikes on Iran have resulted in a sudden reshaping of energy flows globally. Disruptions in the Strait of Hormuz have led to an estimated 60 mn tonnes of crude oil and 7 mn tonnes of LNG flows per month being threatened. East and South Asia in particular will be the most affected due to their extreme dependence on oil and gas flows through the strait — an estimated 89% of crude oil and 66% of the total LNG shipped through that choke point is destined for Asian countries. Countries like India, whose dependence on crude oil through the strait rose to as high as 55% in January 2026, will be keen to secure supplies from other sources to mitigate domestic supply and price shocks.  This contraction in Gulf countries’ oil flows to Asia provides a strategic advantage to Russia, which had witnessed a significant slowdown in purchases from key buyers after OFAC sanctions on oil majors in November 2025. At the end of February 2026, approximately 6.9 mn tonnes of Russian crude — valued at EUR 2.3 bn — was out at sea without a known buyer. The US waiver to India for purchases of Russian crude could result in these volumes at sea — half the deficit expected to be generated by the loss of volumes from Iraq, Saudi Arabia, UAE, Kuwait, Qatar, and Bahrain — being taken in by India. A week after Israeli-US airstrikes on Iran (starting 28th February), Russia’s average daily fossil fuel export earnings have totalled an estimated EUR 510 million per day, 14% more than February’s daily average. The key reason for any Russian revenue growth will not centre around merely the sales of these cargoes but also the spillover effect on a narrowing of the discount on Russian oil. Any rise in the price of Russian oil will result in a similar rise in the taxes Russia can apply to it, thereby providing a much-needed boost to its actual revenues. EU gas price shock provides opportunity to invest in solar Despite the Qatar shutdown, the EU remains relatively sheltered from energy supply shocks — even though gas prices have spiked, mainly due to the market pricing uncertainty, rather than a real tightening of supply. LNG shipments are bought in advance, and the assumption is that as Qatari LNG outflows dry up, Asian buyers will turn to the spot market to make up for the shortfall. Qatar, which has shut down LNG production and applied force majeure to contracts, is responsible for 20% of the global supply of the commodity. The country supplied an estimated 10% of the EU’s LNG imports in 2025.  The current crisis provides the EU with an opportunity to invest more in renewable energy rather than pivoting towards filling the gap in LNG supply from other sources. In 2025, the bloc’s reduced reliance on gas for power generation has already resulted in savings of an estimated EUR 20.2 mn on average each month. Solar power has been key to reducing the EU’s dependence on gas. The additional power generation from solar led to savings of approximately 2 bcm of gas (0.8 bcm LNG and 1.2 bcm natural gas) on average every month in 2025. Solar’s gains resulted in an estimated 240 TWh in reduced gas power generation. In 2025, the EU imported EUR 49.1 bn of LNG, of which an estimated 30% was purchased on the spot market. Eliminating these purchases and instead redirecting the investment to solar deployment could result in the addition of 21 GWh of solar power every month. Merely redirecting spot market purchases of Qatar LNG in 2025 towards solar installation would have resulted in the addition of 1.75 GWh of solar power every month. |
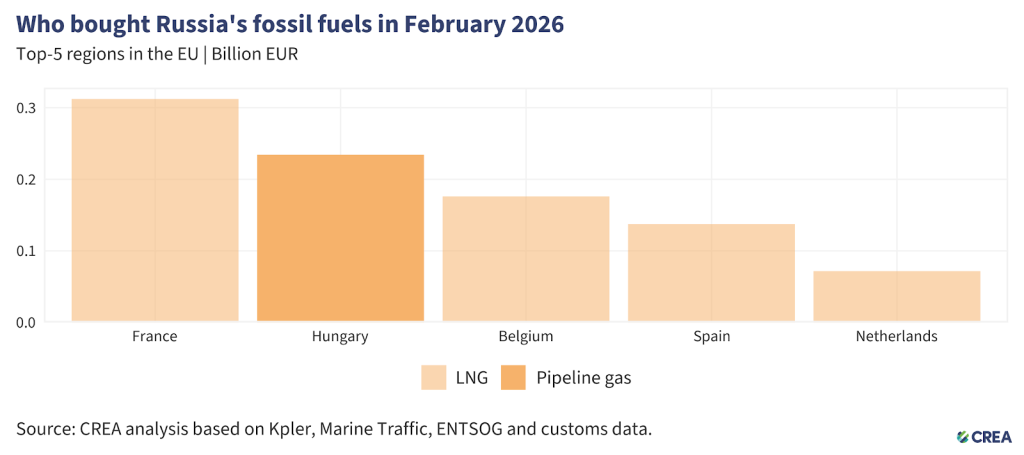
- In February 2026, the five largest EU importers of Russian fossil fuels paid Russia a combined EUR 932 mn. Natural gas — unsanctioned by the EU — accounted for all of these imports, delivered mainly by pipeline or as LNG.
- Hungary and Slovakia have been unable to receive Russian crude via the Druzhba pipeline since Russian air attacks halted supplies on 27 January. Both countries have access to alternative supply routes through the Adria pipeline starting at the Croatian port of Omišalj. Hungarian Prime Minister Viktor Orbán vetoed the EU’s 20th sanctions package against Russia, withdrawing his support unless oil deliveries through the pipeline resumed.
- France was the EU’s largest importer, purchasing EUR 312 mn worth of Russian LNG in February. While France’s total LNG imports remained unchanged month-on-month, Russian imports saw a 19% reduction.
- Hungary was the second largest buyer, importing EUR 234 mn of Russian fossil fuels. Hungary’s imports of Russian fossil fuels in February consisted entirely of pipeline gas.
- Belgium was the third-biggest importer, importing EUR 176 mn of Russian LNG in February. Belgium’s imports of Russian LNG decreased by 16% month-on-month, despite total LNG imports registering a 15% increase.
- Spain was the fourth-highest importer, with imports totalling EUR 137 mn.
- The Netherlands, the fifth-highest importer, purchased EUR 72 mn of Russian LNG in February.
- The EU’s ban on imports of oil products made from Russian crude came into effect on 21 January 2026. Since then, 17 shipments of oil products refined from refineries using Russian crude — and identified as high risk according to EU guidance — have entered the bloc, unloading before the end of February.
- Fourteen of these shipments departed from Turkiye’s refineries, two from India and one from Georgia. Cyprus was the largest recipient of shipments from these refineries running on Russian crude, receiving six shipments, followed by Spain (four shipments) and France (two shipments).
- Since the implementation of the EU’s ban on oil products made from Russian crude, Belgium, Italy, Romania, Greece, and Lithuania have also received one shipment each from refineries that imported Russian crude. Enforcement agencies in Member States must investigate shipments of oil products from these refineries that run on Russian crude to stop molecules of Russian oil entering the bloc, which would violate the EU’s recently implemented ban.
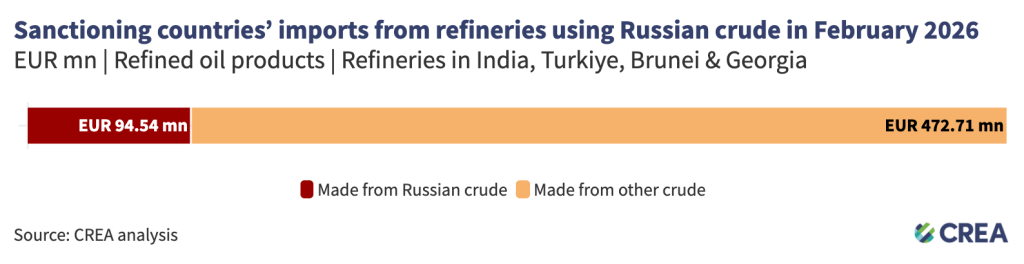
- Refineries in India, Turkiye, Brunei, and Georgia that use Russian crude exported EUR 567 mn of oil products to sanctioning countries in February 2026. The importers included the EU (EUR 221 mn), Australia (EUR 193 mn), and the US (EUR 153 mn). An estimated EUR 94.5 mn of these products were refined from Russian crude.
- There was a 20% month-on-month reduction in these refineries’ exports to sanctioning countries. While the UK and Canada did not receive any shipments from these refineries, even the EU and Australia recorded reductions of 26% and 42%, respectively. In sharp contrast, US imports from refineries using Russian crude almost doubled in February.
- The US’s imports came from the Jamnagar refinery in India and the Tupras-owned refineries in Turkiye. In February, as much as 80% of the Tupras Izmit refinery’s crude feedstocks in February came from Russia.
How are oil prices changing?
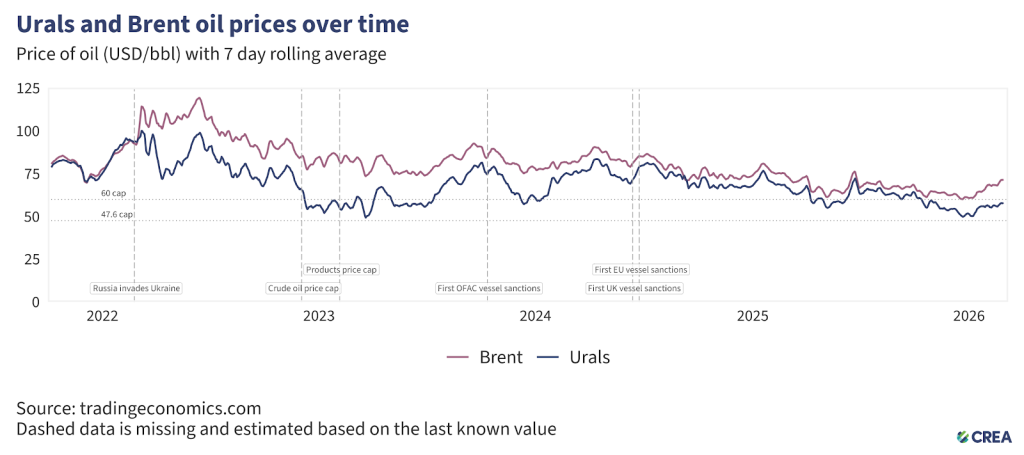
- In February 2026, the average price of Russia’s Urals crude rose for the second straight month, up by 4% to USD 56.6 per barrel, remaining above the new EU and UK price cap of USD 44.1 per barrel, which took effect on 1 February 2026.
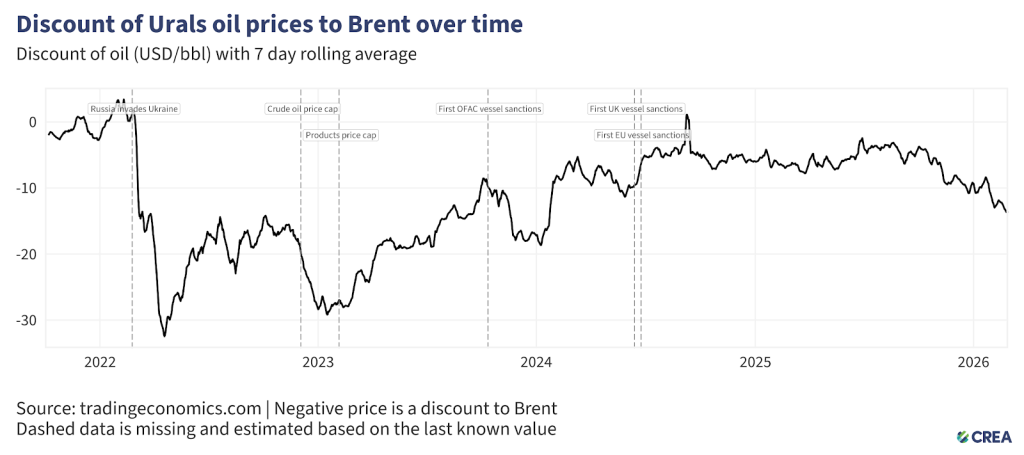
- In February, the discount on Urals crude increased by a massive 29% month-on-month, averaging USD 12.6 per barrel below Brent.
Sanctioned tankers carry the majority of Russian crude despite G7+ sanctions
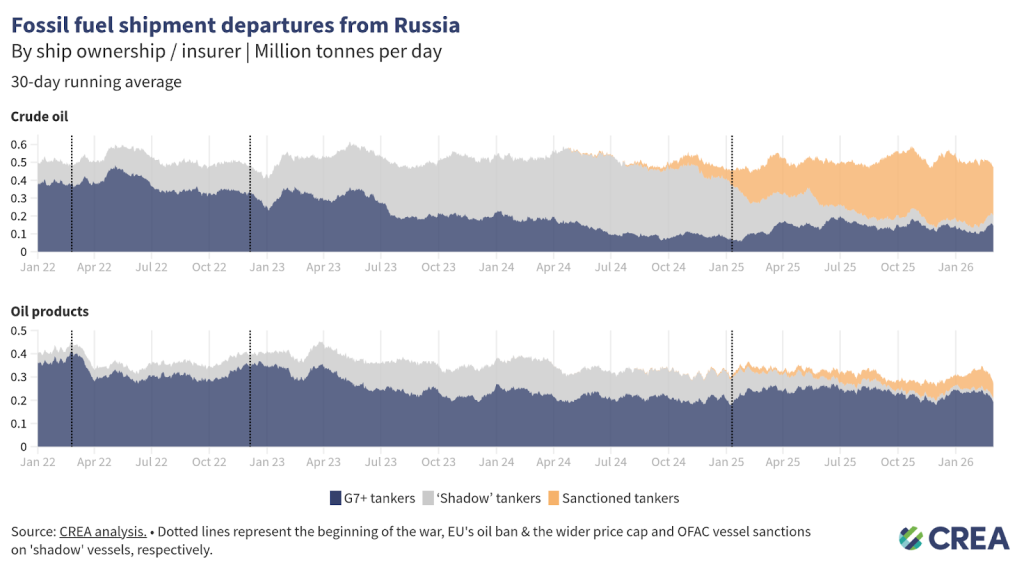
- In February 2026, Russian oil exports by sea dropped by 8%, with exactly half the total transported by ‘shadow’ tankers under sanctions. Around 43% of the volume was transported by G7+ tankers.
- G7+ tankers transported 33% of Russian crude oil exports in February, while non-sanctioned ‘shadow’ tankers accounted for 11% of the total. The largest share, 56%, was carried by sanctioned ‘shadow’ tankers.
- For oil products, Russia’s dependence on G7+ tankers is higher; these tankers transported 70% of Russian oil products in February. Sanctioned ‘shadow’ tankers carried 25% of total Russian oil product volumes, while non-sanctioned ‘shadow’ tankers accounted for 5% of the volume.
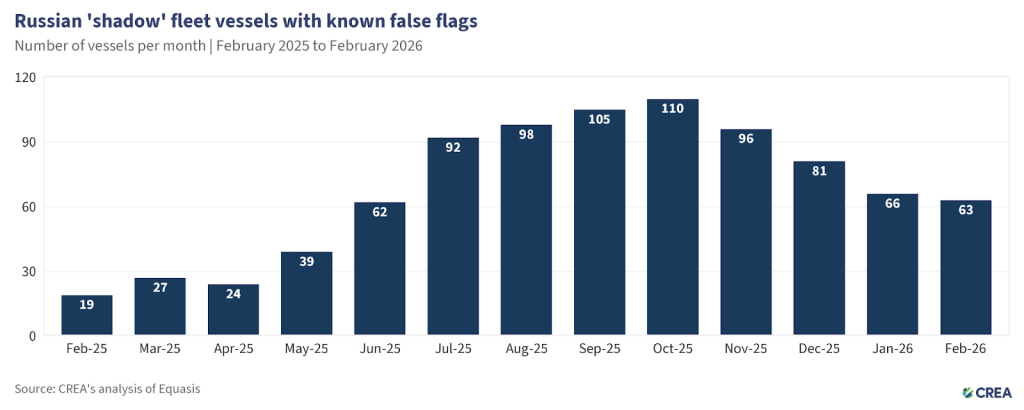
- In February 2026, 63 ‘shadow’ vessels were operating under false flags at the end of the month. Twenty-three vessels delivered EUR 800 mn of Russian crude oil and oil products while flying a false flag.
- Just under a quarter of the volume of Russian oil (24%) transported by tankers flying false flags (473 thousand tonnes, valued at EUR 176 mn) transited the Danish Straits in February, carried by just nine vessels.
‘Shadow’ tankers pose significant risks to ecology and impact of sanctions
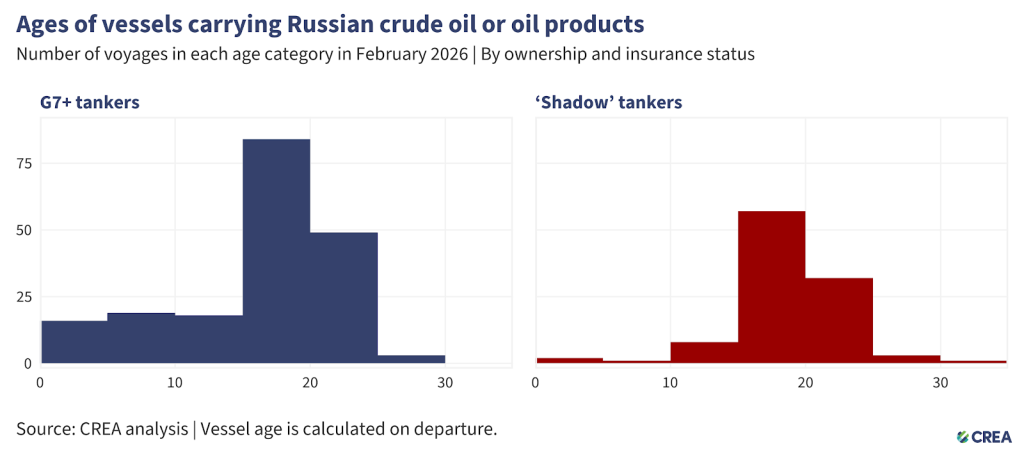
- In February 2026, 293 vessels exported Russian crude oil and oil products. Among them, 189 were G7+ tankers, and the remaining 104 were ‘shadow’ tankers. Additionally, 36 of these ‘shadow’ tankers were at least 20 years old or older.
- The oldest vessel transporting Russian oil in February was constructed 35 years ago.
- Older ‘shadow’ tankers transporting Russian oil through EU waters pose environmental and financial risks due to their age, poor maintenance, and inadequate protection and indemnity (P&I) insurance. In the event of an oil spill or accident, coastal states may face significant cleanup costs and damage to their marine ecosystems.
- The cost of cleanup and compensation from an oil spill by tankers with dubious insurance could amount to over EUR 1 bn for taxpayers in coastal countries.
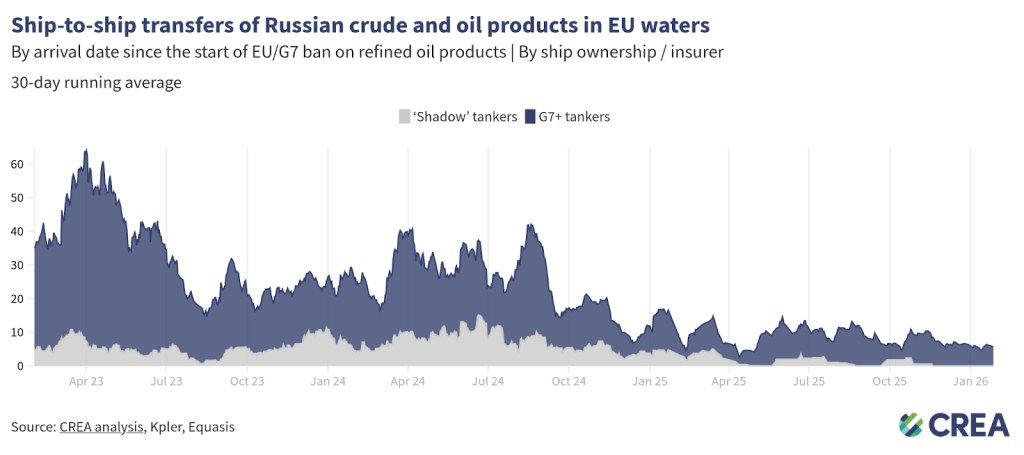
- In February 2026, an estimated EUR 75 mn worth of Russian oil was transferred via ship-to-ship (STS) transfers in EU waters.
- All STS transfers of Russian oil in EU waters were conducted in either Cyprus (87%) or Spain (13%).
- Daily transfers averaged EUR 2.7 mn — a 51% decrease compared to last month. G7+ tankers conducted 100% of these transfers.
How can Ukraine’s allies tighten the screws?
Russia’s fossil fuel export revenues have fallen since the sanctions were implemented, subsequently constricting Putin’s ability to fund his full-scale invasion of Ukraine. However, much more should be done to limit Russia’s export earnings and constrain the funding of the Kremlin’s war chest.
Implement a G7+ Maritime services ban for Russian oil
The oil price cap has failed to impose a durable constraint on Russian crude exports, working only briefly and selectively for Urals while leaving other grades and export channels largely unaffected. Urals prices dipped below the USD 60 cap only in late 2022 and early 2023 before rebounding, while ESPO crude consistently traded well above the cap due to its structural orientation toward China and Pacific markets.
At the same time, Russia has built a large ‘shadow’ fleet that now carries the majority of crude exports, reducing reliance on Western services. In February 2026, only 33% of Russian crude oil exports were transported by G7+ tankers, while 56% were carried by sanctioned ‘shadow’ vessels. This shift demonstrates that the price cap has neither constrained export volumes nor prevented Russia from selling crude above the cap through alternative logistics and buyers.
For oil products, the situation further exposes the cap’s ineffectiveness. Russia remains heavily dependent on G7+ tankers for refined product exports, which transported 70% of oil product volumes in February, yet the product price caps were set so high — up to USD 100 per barrel for premium products — that they rarely bound market prices and therefore failed to limit revenues.
Combined with the widespread use of intermediaries and special purpose vehicles (SPVs), which legally separate sanctioned producers such as Rosneft and Lukoil from export transactions, Russia can continue exporting both crude and oil products while formally complying with sanctions.
These dynamics show that entity-based sanctions and price caps have been easily circumvented through SPVs and ‘shadow’ fleet growth. Considering this, CREA now proposes a full maritime services ban that targets the physical infrastructure of exports, closing these loopholes and imposing uniform, volume-based constraints on Russian oil revenues.
Restrict the growth of ‘shadow’ tankers & tighten regulations targeting the refining loophole
- Frequent sanctioning of Russian ‘shadow’ vessels has shifted Russian oil back to tankers owned or insured in G7+ countries. Nonetheless, Russian ‘shadow’ tankers still hold sway on the transport of Russian crude oil. In addition, many sanctioned vessels continue to deliver oil to ports globally, with EU and UK sanctions in particular frequently violated. Sanctioning countries must align their vessel lists and enforcement paradigms for a magnified effect on their operations.
- Maritime coastal states should intensify efforts to monitor, inspect, and detain ‘shadow’ fleet vessels that lack legal passage rights, such as unflagged, unlawfully idle, or security-risk vessels. Authorities must enforce and improve environmental and navigation laws within their territorial waters, investigating and boarding suspicious vessels when justified. Crews involved in criminal activity should face prosecution, and noncompliant ships and personnel should be subject to international arrest warrants.
- In its 18th sanctions package, the EU banned the imports of ‘oil refined from Russian crude’. The regulation bans imports from countries that are ‘net importers’ of crude oil. Net export status does not preclude the import and refining of Russian-origin crude, especially in jurisdictions with flexible or opaque crude sourcing practices. To close this enforcement gap, the exemption should be applied at the refinery level rather than the national level. Refined petroleum products should be subject to import restrictions if produced at facilities that have processed Russian crude within the past six months, regardless of the final product’s declared origin or the host country’s net export position.
- The exemptions for countries including the UK, the US, Canada, Norway, and Switzerland create an opportunity for oil products refined from Russian crude to be re-exported to the EU. This gap should be closed to ensure the sanctions are comprehensive and watertight. The EU should work with its partners to encourage them to also ban the importation of oil products from refineries running on Russian crude.
- Imports of oil products or petrochemicals from storage terminals or re-export hubs in non-sanctioning countries that have received a shipment of Russian oil in the previous six months should be prohibited from exporting to sanctioning jurisdictions. This aims to prevent re-export hubs from obfuscating the origin of imported Russian oil products that are then sent to sanctioning countries, such as the suspicious cases observed in Turkiye and Georgia.
Stronger sanctions enforcement and monitoring of violations
- Despite clear evidence of violations, there is a need for stronger enforcement of penalties by agencies against shippers, insurers, and vessel owners. This information must be shared widely in the public domain. Penalties against violating entities increase the perceived risk of being caught and serve as a deterrent.
- Penalties for violating the price cap must be significantly harsher. Current penalties include a 90-day ban on vessels from securing maritime services after violating the price cap, a relatively minor sanction. If found guilty of violating sanctions, vessels should be fined and banned in perpetuity.
- The G7+ countries should ban STS transfers of Russian oil in G7+ waters. STS transfers undertaken by old ‘shadow’ tankers with questionable maintenance records and insurance pose environmental and financial risks to coastal states and support Russia logistically in exporting high volumes of crude oil. Coastal states should require oil tankers suspected of being ‘shadow’ tankers transporting Russian oil through their territorial waters to provide documentation showing adequate maritime insurance. Upon failing to do so, having been identified as a ‘shadow’ tanker, they should be added to the OFAC, UK, and European sanctions lists. This policy could limit Russia’s ability to transport its oil on ‘shadow’ tankers, which are not required to comply with the oil price cap policy.
- To strengthen the integrity of maritime operations, the International Maritime Organization (IMO) must revise its guidelines to enhance transparency regarding maritime insurance. The IMO should mandate that flag states require shipowners and insurers to publicly disclose key financial information, including insurer solvency data, credit ratings from recognised agencies, and audited financial statements. Maritime authorities of coastal states should be legally able and encouraged to detain tankers that fly false flags and therefore pose environmental and security threats.
Relevant reports:
- Fourth year of full-scale invasion: Russian fossil fuel revenues tank to 27% below pre-invasion levels
- Suspected Russian ‘shadow fleet’ tanker seized in North Sea
- Podcast: EU Sanctions on Russia: Four Years After the Invasion
- Are loopholes undermining Australia’s support for Ukraine?
- Is the UK heading for a military confrontation with Russia?
| Note on methodology: This monthly report uses CREA’s fossil shipment tracker methodology. The data used for this monthly report is taken as a snapshot at the end of each month. The data provider revises and verifies data on trades and oil shipments throughout the month. We subsequently update this verified data each month to ensure accuracy. This might mean that figures for the previous month change in our updated subsequent monthly reports. For consistency, we do not amend the previous month’s report; instead, we treat the latest one as the most accurate data for revenues and volumes. Russia’s daily revenues for commodities used in this report are derived as an average, using CREA’s pricing methodology. The number of vessels with false flags per month is calculated using an end-of-month snapshot. In other words, for each month, vessels were counted if their most recent flag change at the end of the month was to a false flag. This does not account for the vessels with multiple false flag periods (switches between false flags and verified flags, or between different false flags), only the most recent flag status at the end of the month. To calculate the volume and value carried by false flags transiting the Danish Straits, we assume that vessels loading from Russia’s northern and western ports (Ust-Luga, Primorsk, Vysotsk, St Petersburg, Murmansk, Arkhangelsk, Kaliningrad) must transit the Danish Straits. CREA’s estimates of the impact of a revised and lowered price cap have been updated since February 2025. These numbers are a more accurate representation of the revenue losses Russia would incur. Our earlier numbers significantly underestimated the impact of a lower price cap due to a bug that we identified that mislabeled commodities in our model. EU gas savings due to solar installations Quantifying the natural gas volumes and economic value displaced by EU solar expansion between 2017 and 2025 is done by estimating how additional solar generation reduced fossil fuel–based electricity generation and associated gas demand. New solar generation was measured relative to a 2016 baseline — the first year with comprehensive Ember EU electricity data — by calculating the difference between actual generation and the 2016 average. The methodology assumes that new solar displaces fossil thermal generation (coal, gas, and other fossil fuels) on a 1:1 basis. We allocated this displacement across fuels using rolling shares of the thermal generation mix calculated over a 36-month window (minimum 12 months), allowing the estimates to reflect changes in Europe’s fossil power fleet over time. We converted avoided gas generation into physical gas volumes assuming a power plant efficiency of 50%, a gas gross calorific value of 11.259 kWh/m³, and a density of 1,380 m³ per tonne for pricing purposes. We then allocated gas savings between LNG and pipeline gas using monthly import shares derived from ENTSOG cross-border flow data, assuming reductions in demand affect both sources proportionally. The value of the avoided gas is derived from commodity-specific prices — CREA fossil shipment tracking data for 2020 onward and IMF/FRED data for 2016–2019 — applied separately to LNG and pipeline volumes and aggregated monthly. To remove seasonal effects and isolate underlying trends, we applied 12-month moving averages to solar generation, gas import shares, and gas prices before combining them in the final estimates. Data sources: Ember EU Monthly Electricity Data for power generation; CREA Russia Fossil Tracker for gas flows and supply mix (using ENTSOG), and pricing (from market data and Eurostat); and IMF/FRED EU natural gas price series as a pre-2020 fallback. |