By Qi Qin, China Analyst; Miao Chien, Data Scientist; with contributions from Lauri Myllyvirta, Lead Analyst
After China tightened its PM2.5 standard, 16 provincial capitals still failed to meet the new limit by the end of May, with northern and northwestern cities facing elevated PM2.5 and multi-pollutant pressure. Yet, most capitals saw PM2.5 and NO₂ fall year-on-year in May, mainly due to lower emissions.
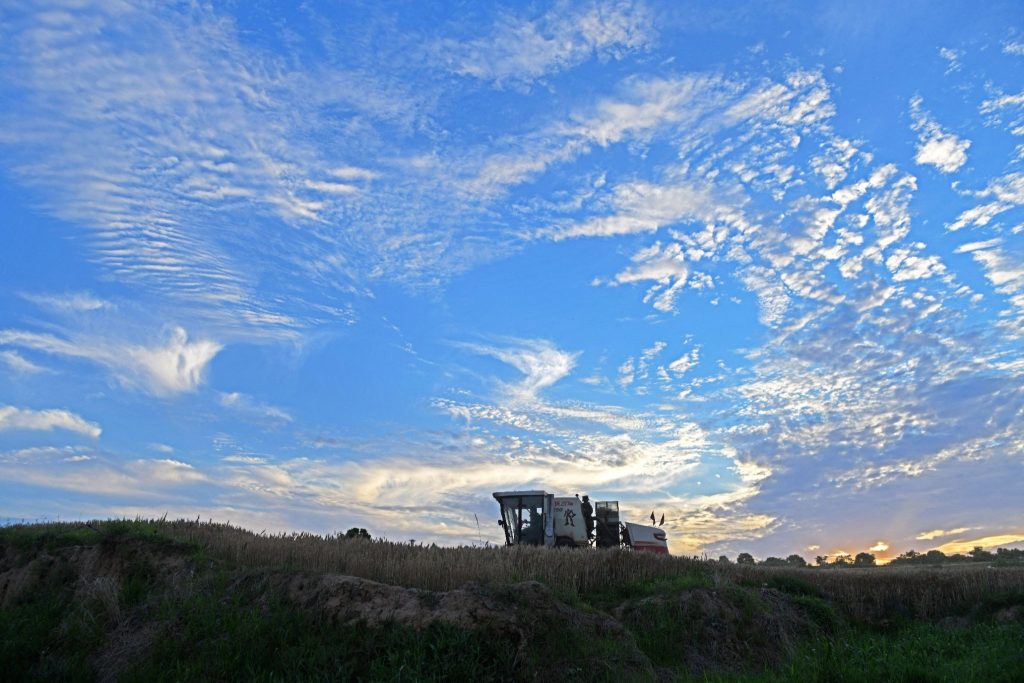
An agricultural machine harvests wheat in Dongyao Village, Jiaozuo City of central China’s Henan Province, on 31 May 2026. Photo: Xinhua/Alamy.
Key findings
- Following the tightening of China’s annual PM2.5 standard from 35 to 30 µg/m³ in March 2026, the number of provincial capitals failing to meet the standard rose sharply from six at the end of February to 18 by the end of March, and remained high at 16 by the end of May. Non-compliant cities were concentrated not only in the Beijing-Tianjin-Hebei region but also across parts of the Northeast and Northwest.
- PM2.5 levels rose year-on-year in only two provincial capitals in May, down sharply from 18 in March. Meanwhile, Zhengzhou and Shijiazhuang saw notable improvements, despite still ranking among the ten provincial capitals with the highest PM2.5 levels. The decline in PM2.5 was driven by a combination of weather conditions and lower emissions, with emission reductions playing the larger role.
- Haikou, a southern provincial capital that typically enjoys relatively good air quality, saw notable year-on-year increases in both PM2.5 and ozone concentrations, mainly driven by higher emissions.
- Several provincial capitals faced multi-pollutant pressure in May, with Lanzhou, Taiyuan, Tianjin, and Beijing ranking relatively high across more than one pollutant. Lanzhou stood out for having both the highest PM2.5 level and one of the highest NO₂levels, while Taiyuan ranked among the top cities for both ozone and NO₂.
- Lower emissions were the main driver of PM2.5 and NO₂ reductions. For PM2.5, emissions-related changes contributed to declines in almost all provincial capitals except Kunming and Guiyang, while NO₂ reductions were driven by lower emissions across all cities, even where weather conditions were less favourable.
16 provincial capitals failed to meet the new annual PM2.5 standards
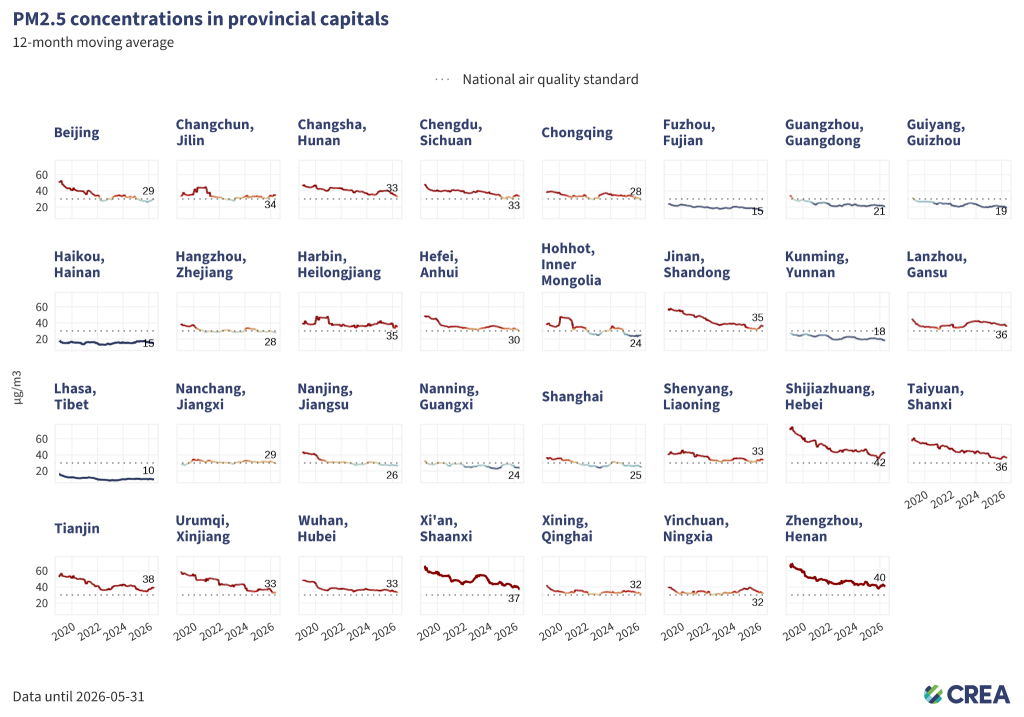
- As of the end of May, 16 of China’s 31 provincial capitals had 12-month average PM2.5 concentrations above the national annual standard of 30 µg/m³, meaning they failed to meet the standard. Starting this March, the new national standard for PM2.5 has been tightened from 35µg/m³ to 30 µg/m³.
- The cities with the highest PM2.5 levels were still concentrated in the Beijing-Tianjin-Hebei surrounding area. Shijiazhuang (Hebei) recorded the highest levels at 42 µg/m³, followed closely by Zhengzhou (Henan) at 40µg/m³. Tianjin came next at 38 µg/m³.
- Provincial capitals that failed to meet the national PM2.5 standard were also clustered in the Northeast and Northwest, including Shenyang, Changchun, Harbin, Urumqi, Xining, Yinchuan, and Lanzhou. Other cities on the list included Jinan, Wuhan, Chengdu, and Changsha, while Hefei, which exceeded the standard last month, returned to compliance.
PM2.5 levels rose year-on-year in two provincial capitals in May
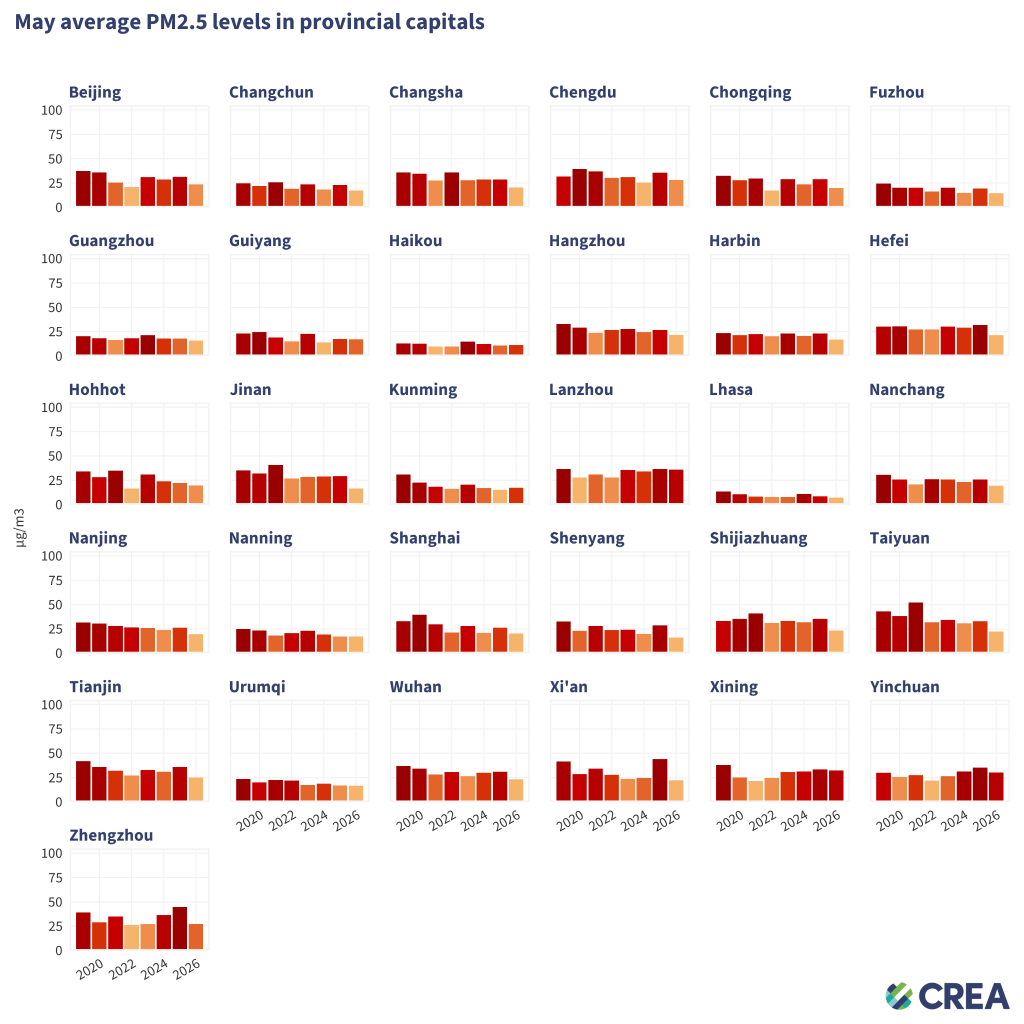
- Notable year-on-year increases were recorded in two capitals, namely Kunming (+15%) and Haikou (+2%), although both cities typically have relatively low PM2.5 levels.
- The biggest year-on-year declines were recorded in Xi’an (-49%), Shenyang(-44%), and Jinan (-43%).
- Other notable declines included Zhengzhou (-39%), Shijiazhuang (-34%), and Hefei (-33%).
Three provincial capitals exceeded the annual ozone limit
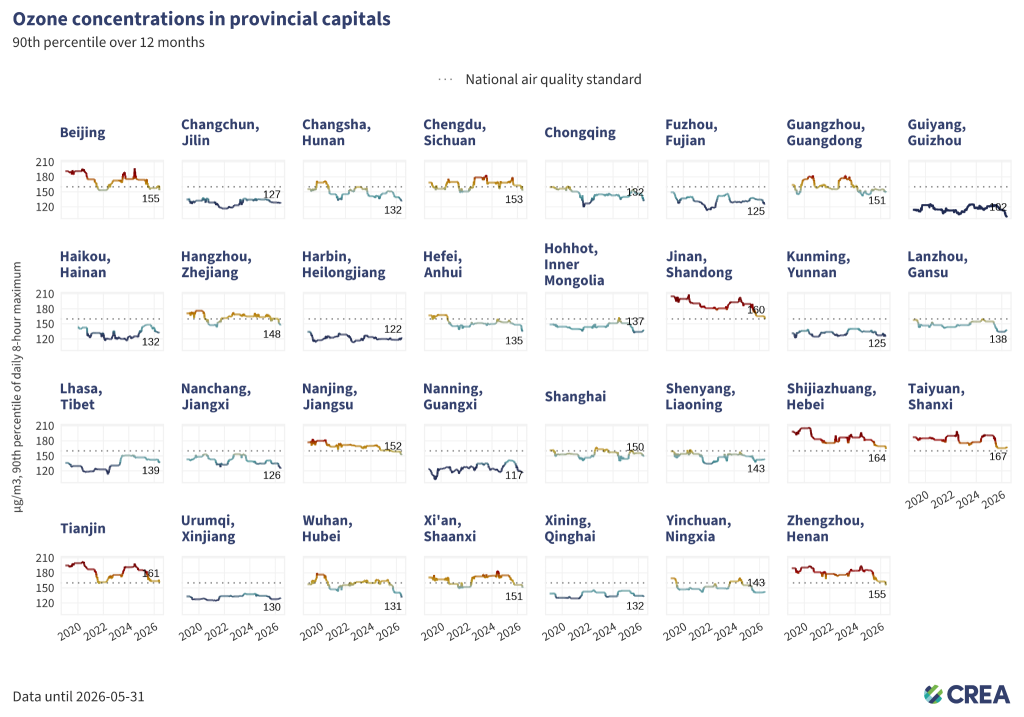
- As of the end of May 2026, three out of 31 provincial capitals recorded 12-month 90th percentile ozone concentrations above the national standard of 160 µg/m³.
- Cities with the highest ozone levels were still mainly located in the Beijing-Tianjin-Hebei surrounding area. Taiyuan (Shanxi) recorded the highest level at 167 µg/m³, followed by Shijiazhuang (Hebei) at 164 µg/m³, and Tianjin at 161 µg/m³.
- Compared with the previous month, six capitals, namely Hohhot (Inner Mongolia), Lanzhou (Gansu), Harbin (Heilongjiang), Yinchuan (Ningxia), Urumqi (Xinjiang), and Taiyuan (Shanxi), saw slight increases in their annual ozone assessment values.
Ozone levels rose year-on-year in nine provincial capitals in April
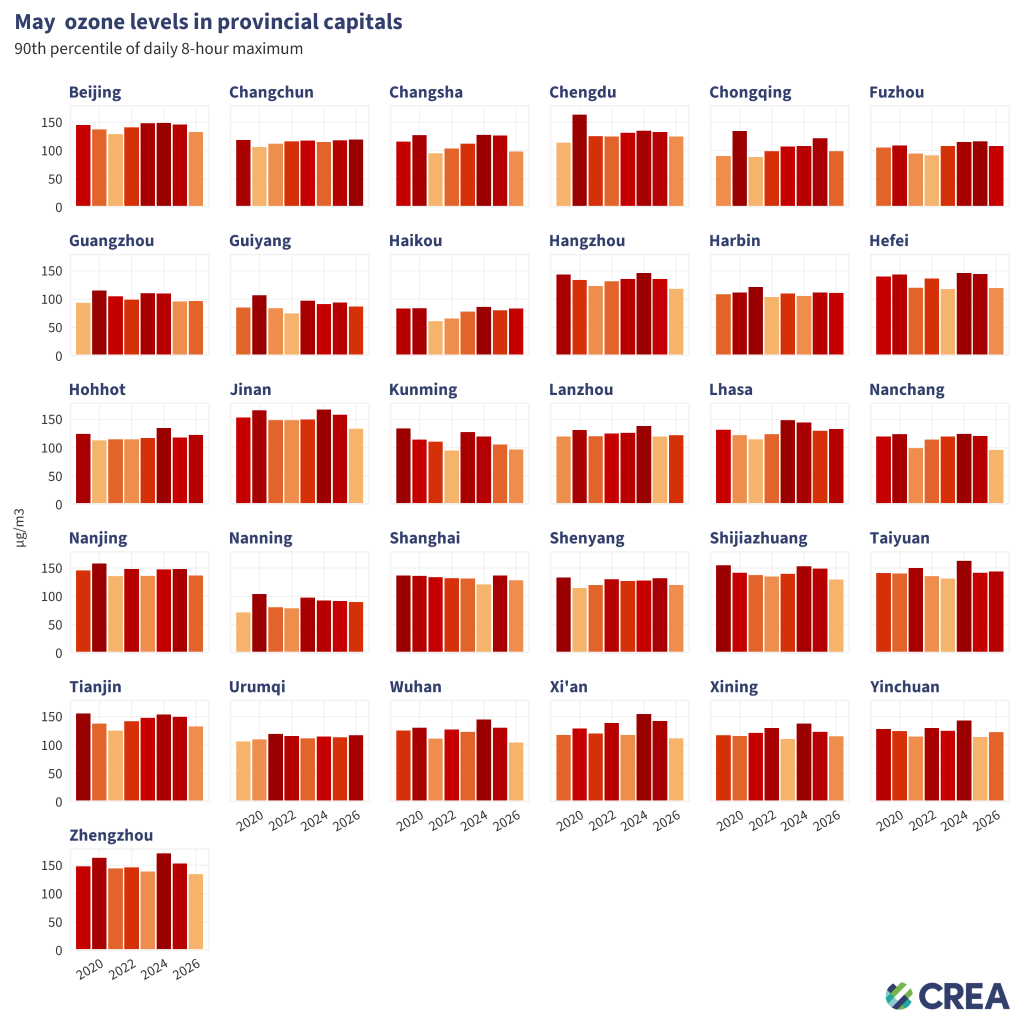
- Northwestern capital cities saw the largest year-on-year increase in ozone levels: Yinchuan (+7%) and Hohhot (+4%). Urumqi (+3%), Lhasa(+2%), and Lanzhou (+2%) also saw notable increases.
- Haikou (Hainan) saw increases in both PM2.5 (+2%) and ozone (+4%) levels.
- Many capital cities saw notable declines in ozone and PM2.5 simultaneously, including Xi’an, Hefei, Jinan, Shijiazhuang, Chongqing, and Zhengzhou.
Multi-pollutant pressure concentrated in northern capitals
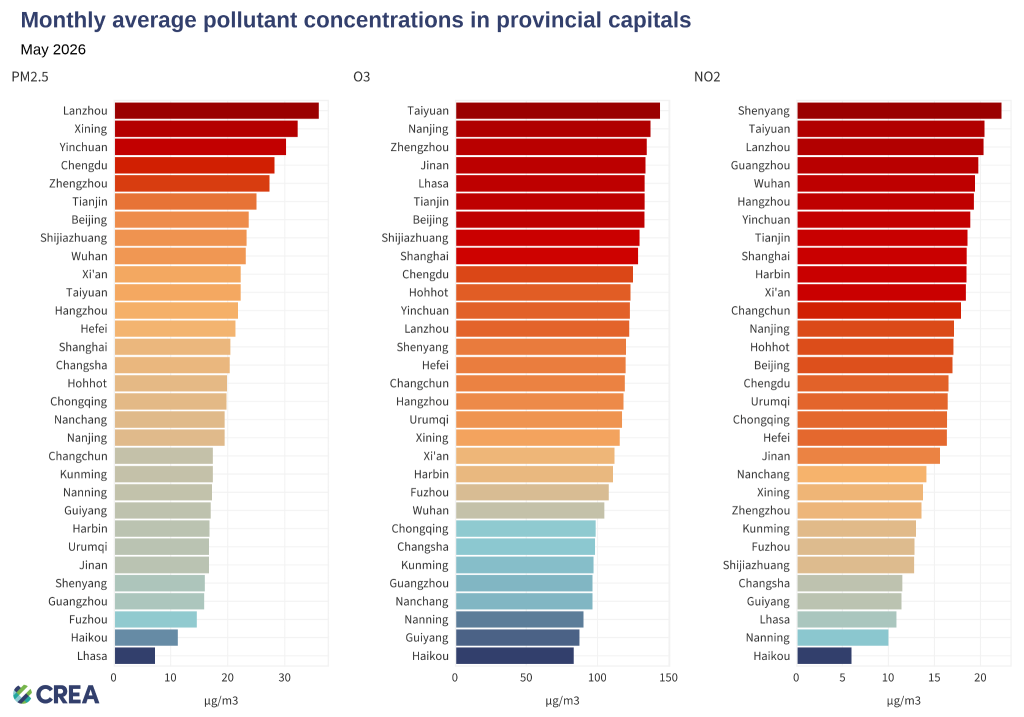
- Several provincial capitals faced multi-pollutant pressure in May, with Lanzhou, Taiyuan, Tianjin, and Beijing ranking relatively high across more than one pollutant. Lanzhou stood out for having both the highest PM2.5 level and one of the highest NO₂ levels, while Taiyuan ranked among the top cities for both ozone and NO₂.
- Low-pollution cities tended to be southern, coastal, high-altitude, or less industrialised provincial capitals. Haikou, Lhasa, and Guiyang ranked among the lower end for at least two pollutants, especially PM2.5 and NO₂.
Emission changes drove most PM2.5 and NO₂ reductions
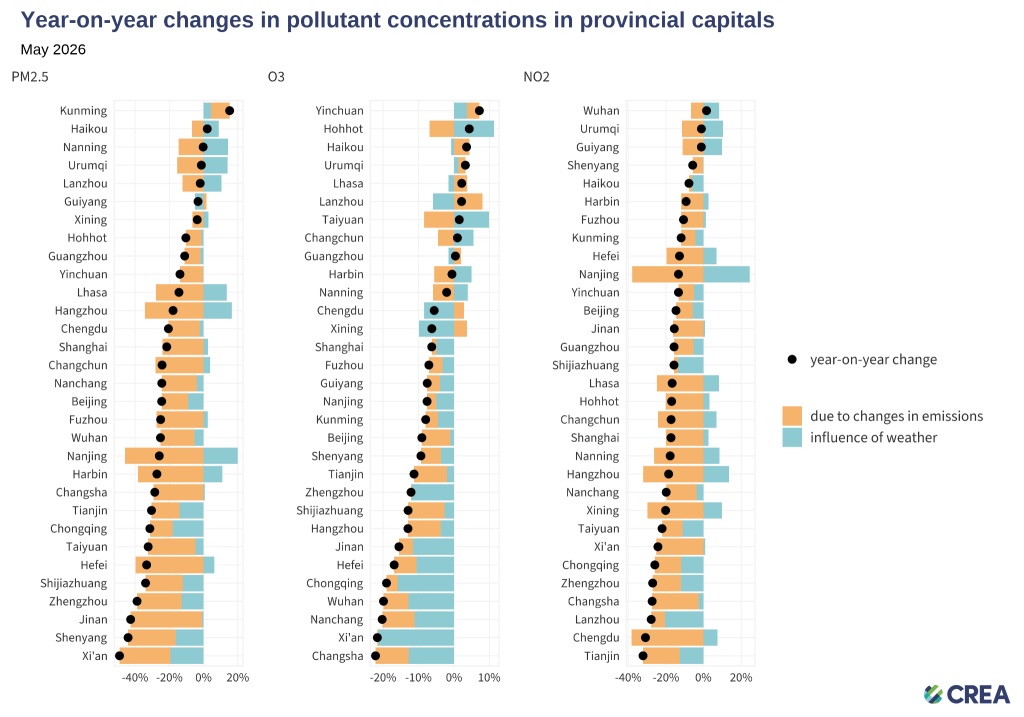
- Lower emissions were the main driver of PM2.5 and NO₂ reductions. For PM2.5, emissions-related changes contributed to declines in almost all provincial capitals except Kunming and Guiyang, while NO₂ reductions were driven by lower emissions across all cities, even where weather conditions were less favourable.
- For ozone, the emissions contribution was more uneven. Emissions-related increases were seen in cities such as Lanzhou, Haikou, and Yinchuan.
Worst 7-day air pollution episodes by pollutant
PM2.5 (excluding sandstorms)
| City | Province | Dates | Average concentration | Highest daily concentration |
| Deyang | Sichuan | May 09 – May 15 | 53.8917 | 86.1373 |
| Hebi | Henan | May 11 – May 17 | 52.7349 | 67.175 |
| Langfang | Hebei | May 09 – May 15 | 48.4359 | 57.3258 |
| Nanyang | Henan | May 28 – Jun 03 | 46.2692 | 110.038 |
| Zizhong | Sichuan | Apr 25 – May 01 | 45.7446 | 103.8472 |
Sandstorms (PM2.5 )
| City | Province | Dates | Average concentration | Highest daily concentration |
| Pingliang | Gansu | May 20 – May 26 | 31.0366 | 104.497 |
| Wuzhong | Ningxia | May 09 – May 15 | 28.0965 | 115.4807 |
| Lanzhou | Gansu | May 16 – May 22 | 28.0302 | 125.6141 |
| Shizuishan | Ningxia | May 09 – May 15 | 27.5652 | 120.4825 |
| Baiyin | Gansu | May 16 – May 22 | 24.5506 | 109.2292 |
Ozone
| City | Province | Dates | Average concentration | Highest daily concentration |
| Handan | Hebei | May 28 – Jun 03 | 194.0223 | 240.2813 |
| Zaozhuang | Shandong | May 28 – Jun 03 | 193.6821 | 227.5 |
| Binzhou | Shandong | May 28 – Jun 03 | 193.5286 | 253.575 |
| Suzhou | Anhui | May 28 – Jun 03 | 192.8571 | 221.2083 |
| Hengshui | Hebei | May 28 – Jun 03 | 192.5536 | 246.5 |
NO2
| City | Province | Dates | Average concentration | Highest daily concentration |
| Yangquan | Shanxi | Apr 25 – May 01 | 35.3205 | 41.9507 |
| Tieling | Liaoning | May 25 – May 31 | 34.6861 | 50.7292 |
| Siping | Jilin | May 25 – May 31 | 33.2888 | 45.9187 |
| Dazhou | Sichuan | May 06 – May 12 | 32.9413 | 38.4091 |
| Rizhao | Shandong | Apr 25 – May 01 | 32.7025 | 37.0565 |
Unit: µg/m3
Relevant analysis by CREA:
- China’s air pollution control enters ‘deep water’ phase
- Why is China’s air pollution shifting west?
- China’s coal-to-chemicals growth risks climate goals
- Why China should get tougher on smog
- Carbon-intensive industries are worsening China’s ozone pollution