By Qi Qin, China Analyst; Danny Hartono, Data Scientist; with contributions from Lauri Myllyvirta, Lead Analyst
Air quality worsened across many of China’s provincial capitals in March 2026, with more cities failing the tightened annual PM2.5 standard, and monthly PM2.5 and ozone levels rising year-on-year in more than half of all provincial capitals.
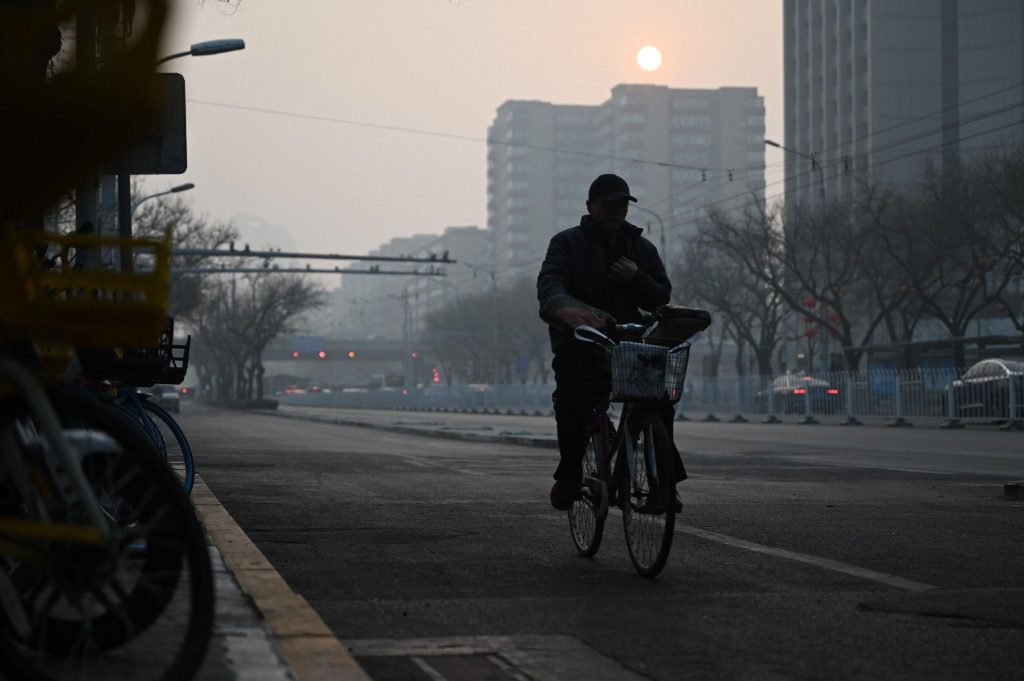
Heavy smog blankets Beijing on 9 March 2025, with PM2.5 levels reaching unhealthy levels. Photo: Johannes Neudecker/dpa/Alamy Live News.
Key findings
- Following the tightening of China’s annual PM2.5 standard from 35 to 30 µg/m³ in March 2026, the number of provincial capitals failing to meet the standard rose sharply from 6 in February to 18 by the end of March, with non-compliant cities concentrated not only in the Beijing-Tianjin-Hebei region but also across parts of the Northeast and Northwest.
- PM2.5 levels rose year-on-year in 18 provincial capitals in March, with the largest increases concentrated in northeastern cities and further marked rises in the Beijing-Tianjin-Hebei region and several other major inland capitals.
- Jinan, Changchun, and Wuhan saw the most significant year-on-year increases in PM2.5 concentrations attributable to emissions, while Harbin’s sharp increase was driven primarily by unfavourable weather conditions rather than higher emissions. The increase in PM2.5 levels in the Beijing-Tianjin-Hebei region was driven by both unfavourable weather conditions and higher emissions.
- Ozone pollution remained concentrated in and around the Beijing-Tianjin-Hebei region, with seven provincial capitals exceeding the annual standard by the end of March. Meanwhile, year-on-year increases in March were recorded in 15 capitals, including several cities that also saw marked rises in PM2.5.
- In March, the highest monthly average PM2.5 and nitrogen dioxide (NO2) concentrations were recorded in northern provincial capitals, especially in the Northeast, while the highest monthly ozone concentrations were led by Kunming and Lhasa.
18 provincial capitals failed to meet the new annual PM2.5 standards
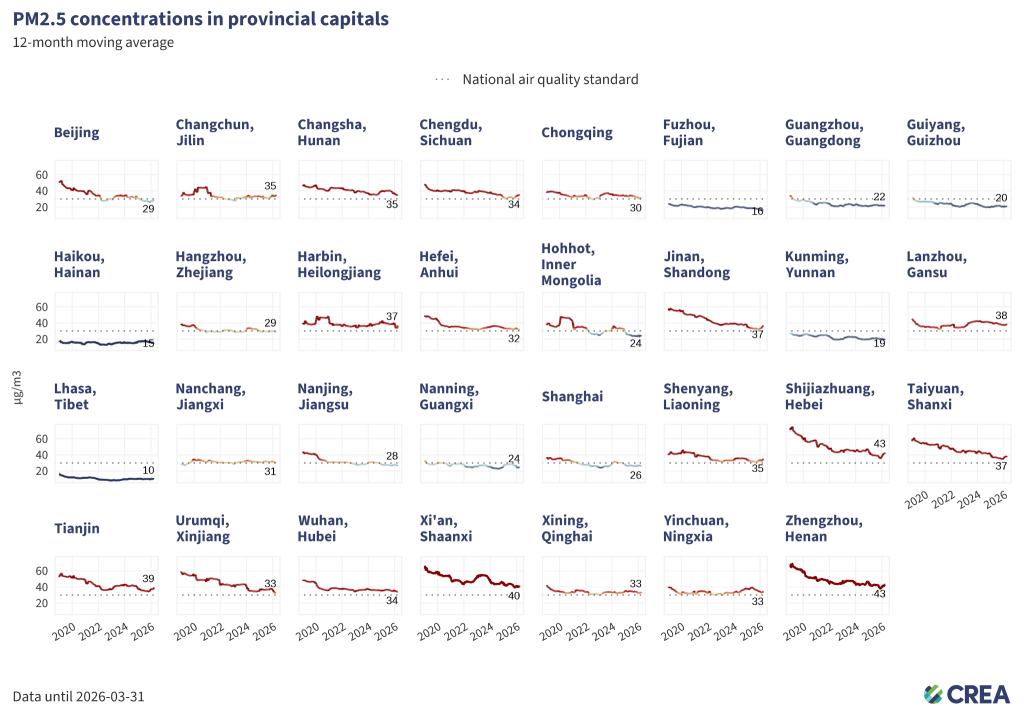
- As of the end of March, 18 of China’s 31 provincial capitals had 12-month average PM2.5 concentrations above the national annual standard of 35 µg/m³, meaning they failed to meet the standard. Starting in March, the new national standard for PM2.5 has been tightened from 35µg/m³ to 30 µg/m³.
- The cities with the highest PM2.5 levels were concentrated in the Beijing-Tianjin-Hebei surrounding area. Zhengzhou (Henan) and Shijiazhuang (Hebei) recorded the highest levels, both at 43 µg/m³, followed closely by Xi’an (Shaanxi) at 40 µg/m³ and Tianjin at 39 µg/m³.
- Provincial capitals that failed to meet the national PM2.5 standard were also clustered in the Northeast and Northwest, including Shenyang, Harbin, Urumqi, Xining, Yinchuan and Lanzhou. Other cities on the list included Jinan, Wuhan, Chengdu, and Changsha.
PM2.5 levels rose year-on-year in 18 provincial capitals in March
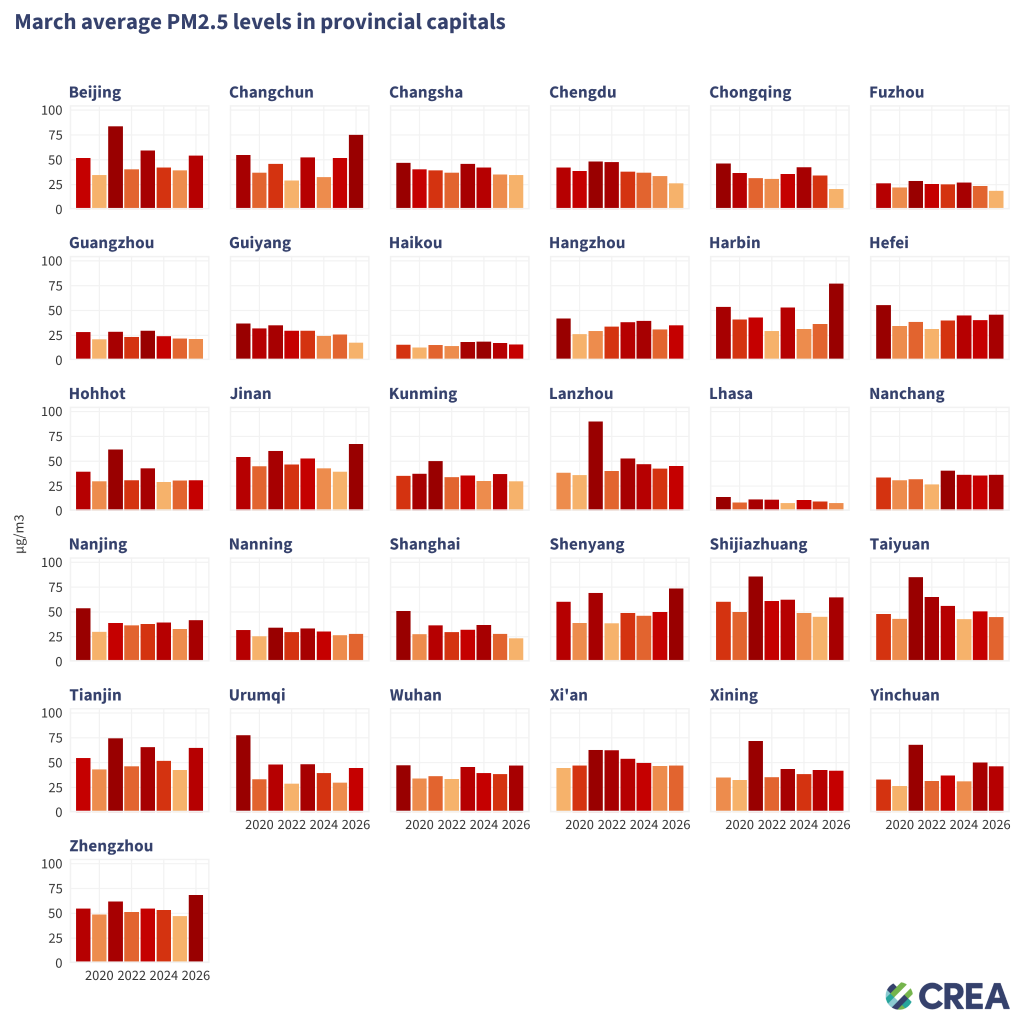
- Notable year-on-year increases were recorded in the northeastern capitals, including Harbin (+112%), Shenyang (+47%), and Changchun (+45%).
- Marked increases were also recorded in the Beijing-Tianjin-Hebei region, including Tianjin (+52%), Shijiazhuang (+44%), and Beijing (+37%).
- Other notable increases included Jinan (+70%), Urumqi (+51%), and Zhengzhou (+45%).
7 provincial capitals exceeded the annual ozone limit
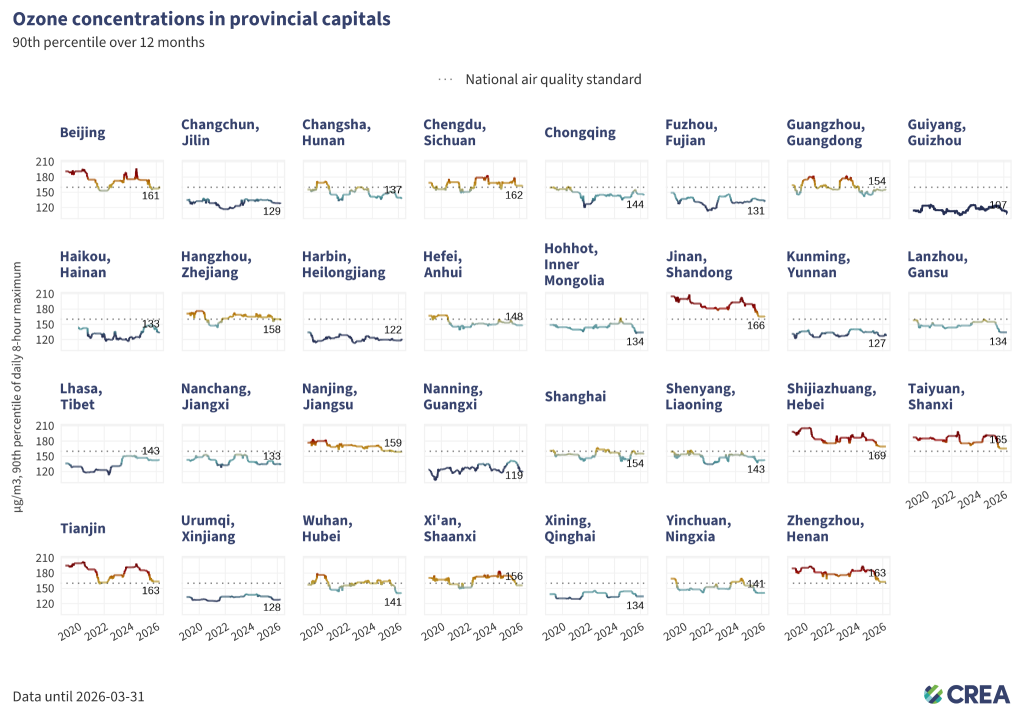
- As of the end of March 2026, seven out of 31 provincial capitals recorded 12-month 90th percentile ozone concentrations above the national standard of 160 µg/m³.
- Cities with the highest ozone levels were still mainly located in the Beijing-Tianjin-Hebei surrounding area. Shijiazhuang (Hebei) recorded the highest level at 169 µg/m³, followed by Jinan (Shandong) at 166 µg/m³, Taiyuan (Shanxi) at 165 µg/m³, and Tianjin and Zhengzhou (Henan) at 163 µg/m³.
- Compared with the previous month, Beijing, Changchun (Jilin), Harbin (Heilongjiang), Shenyang (Liaoning), and Jinan (Shandong) saw an increase in their annual ozone assessment values.
Ozone levels rose year-on-year in 15 provincial capitals in March
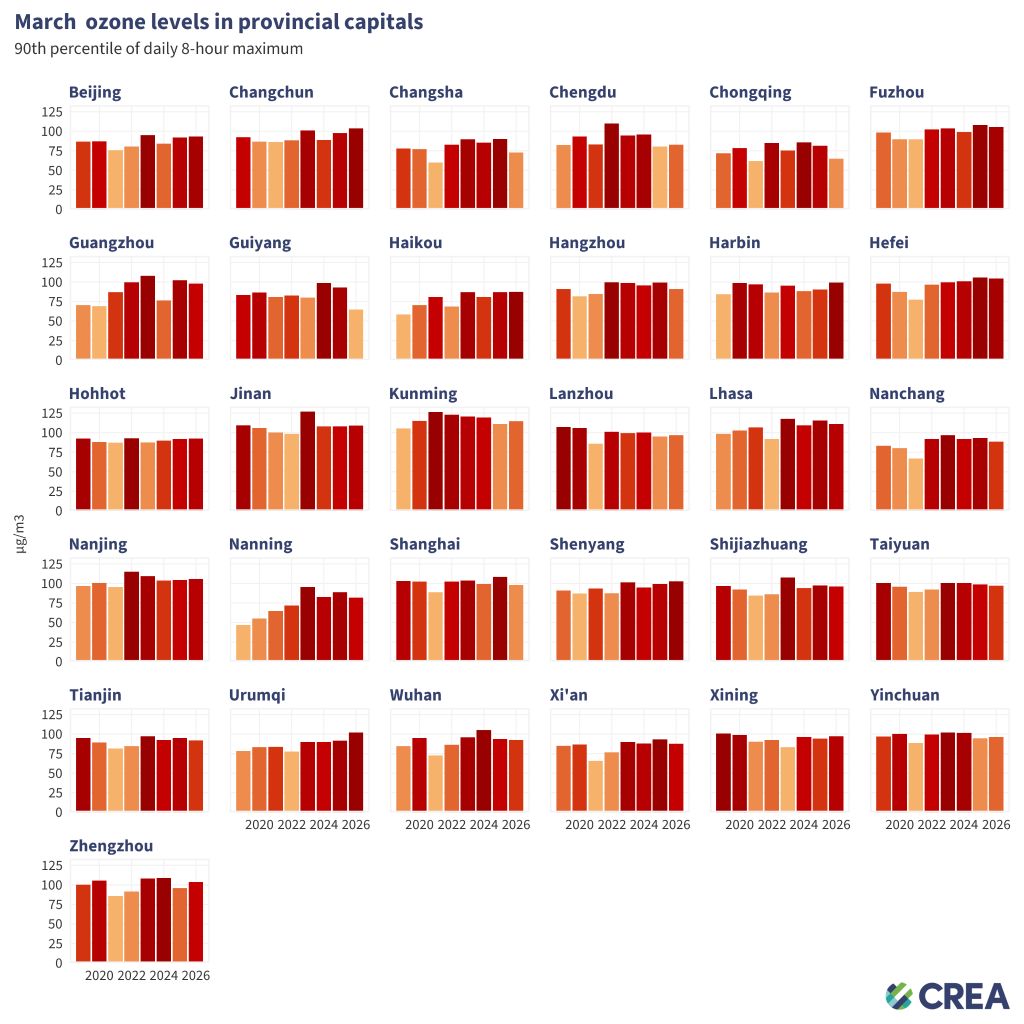
- Urumqi recorded the largest year-on-year increase in ozone levels in March (+11%), followed by Harbin (+9%), and Zhengzhou (+8%).
- Several cities with notable ozone increases also recorded marked rises in PM2.5, including Harbin (+9%), Zhengzhou (+8%), Jinan (+7%), and Changchun (+6%).
- More moderate ozone increases were also recorded in Kunming and Shenyang (+3%), and in Chengdu, Beijing, Lanzhou, and Yinchuan (+2%).
Northeastern capitals led in monthly average PM2.5 and NO2, while western cities saw the highest ozone
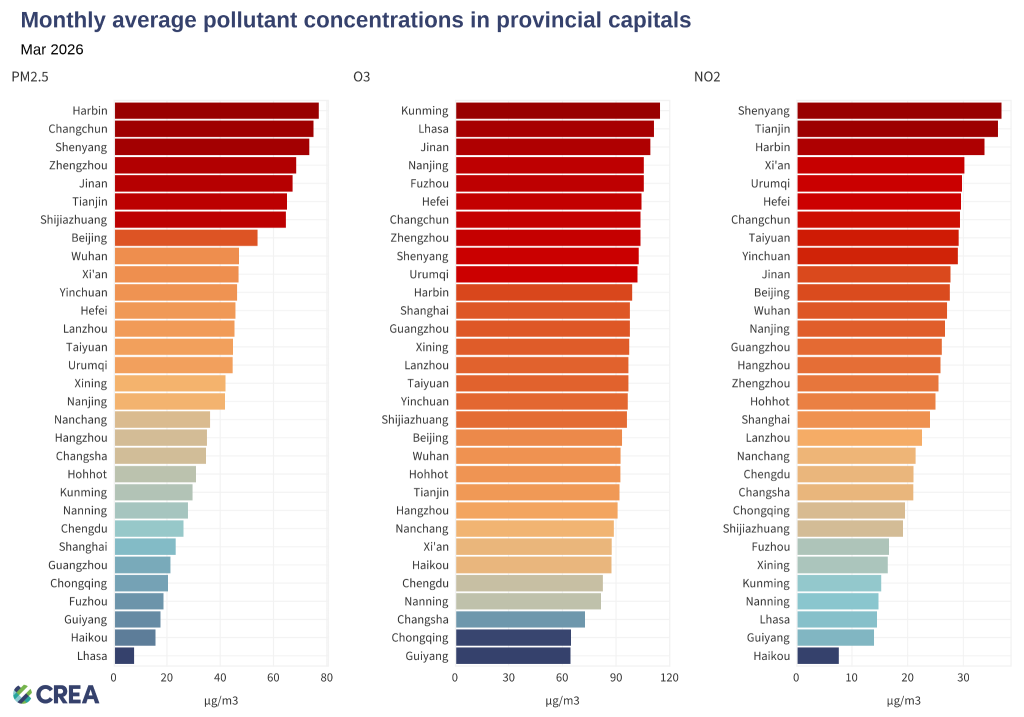
- The highest monthly average PM2.5 concentrations among China’s provincial capitals were recorded in the three northeastern capitals, with Harbin at 77 µg/m³, Changchun at 75 µg/m³, and Shenyang at 74 µg/m³.
- The highest monthly ozone levels were recorded in western China, led by Kunming (Yunnan) at 115 µg/m³ and Lhasa (Tibet) at 111 µg/m³, followed by Jinan (Shandong) at 109 µg/m³.
- The highest NO2 concentrations in March were recorded in Shenyang at 37 µg/m³, followed by Tianjin at 36 µg/m³ and Harbin at 34 µg/m³. Nitrogen dioxide not only poses direct health risks, but also contributes to the formation of PM2.5 and ozone.
Both emission and weather conditions contributed to the PM2.5 increase in the Beijing-Tianjin-Hebei region
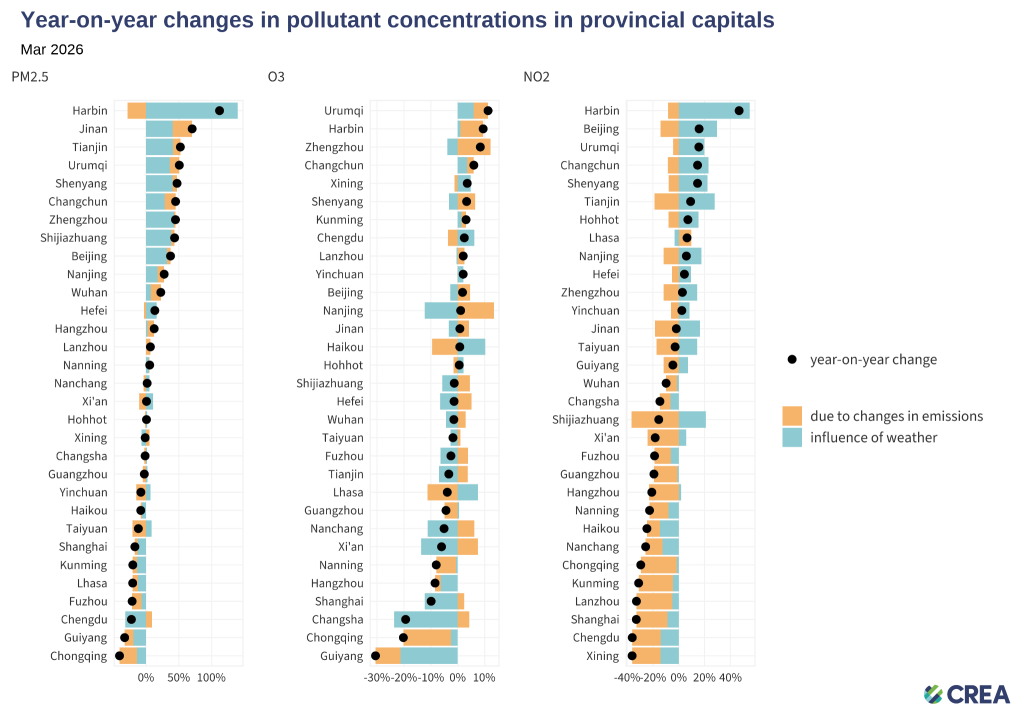
- Jinan, Changchun, and Wuhan saw the most significant year-on-year increases in PM2.5 concentrations attributable to emissions, while Harbin’s sharp increase was driven primarily by unfavourable weather conditions rather than higher emissions. The increase in PM2.5 levels in the Beijing-Tianjin-Hebei region was driven by both unfavourable weather conditions and higher emissions.
- Nanjing, Zhengzhou, and Harbin saw the largest year-on-year increases in ozone attributable to emissions among provincial-level capitals.
- NO2 concentrations rose most noticeably in Harbin, Beijing, and Urumqi, mainly due to unfavourable weather conditions.
Worst 7-day air pollution episodes by pollutant
PM2.5 (excluding sandstorms)
| City | Province | Dates | Average concentration | Highest daily concentration |
| Harbin | Heilongjiang | Mar 23 – Mar 29 | 157.7929 | 260.4488 |
| Anshan | Liaoning | Feb 26 – Mar 04 | 138.4387 | 299.288 |
| Liaoyang | Liaoning | Feb 26 – Mar 04 | 135.5379 | 266.9255 |
| Siping | Jilin | Mar 15 – Mar 21 | 122.1554 | 242.3472 |
| Suihua | Heilongjiang | Mar 24 – Mar 30 | 120.8128 | 175.7083 |
Sandstorms (PM2.5 )
| City | Province | Dates | Average concentration | Highest daily concentration |
| Wuzhong | Ningxia | Mar 07 – Mar 13 | 52.13742 | 190.0036 |
| Wuwei | Gansu | Mar 09 – Mar 15 | 51.20963 | 201.5833 |
| Zhangye | Gansu | Feb 26 – Mar 04 | 49.60904 | 82.375 |
| Shizuishan | Ningxia | Mar 07 – Mar 13 | 43.72588 | 207.8953 |
| Jinchang | Gansu | Mar 07 – Mar 13 | 41.53757 | 149.619 |
Ozone
| City | Province | Dates | Average concentration | Highest daily concentration |
| Zaozhuang | Shandong | Mar 23 – Mar 29 | 159.4929 | 185.225 |
| Dongying | Shandong | Mar 23 – Mar 29 | 158.0387 | 184.1458 |
| Zibo | Shandong | Mar 23 – Mar 29 | 157.3393 | 175.7083 |
| Linyi | Shandong | Mar 23 – Mar 29 | 155.3495 | 191.1071 |
| Jining | Shandong | Mar 23 – Mar 29 | 153.0357 | 186.2813 |
NO2
| City | Province | Dates | Average concentration | Highest daily concentration |
| Harbin | Heilongjiang | Mar 23 – Mar 29 | 49.43256 | 66.84392 |
| Shenyang | Liaoning | Mar 11 – Mar 17 | 44.89576 | 58.32966 |
| Tianjin | Tianjin | Mar 23 – Mar 29 | 44.06864 | 59.79383 |
| Yangzhou | Jiangsu | Mar 25 – Mar 31 | 43.85266 | 62.96008 |
| Huludao | Liaoning | Mar 11 – Mar 17 | 42.41506 | 48.46875 |
Unit: µg/m3
Relevant analysis by CREA:
Carbon-intensive industries are worsening China’s ozone pollution
Why is China’s air pollution shifting west?
China’s coal-to-chemicals growth risks climate goals
Why China should get tougher on smog