
By Manoj Kumar N, Medha Mathew, and Nandikesh Sivalingam
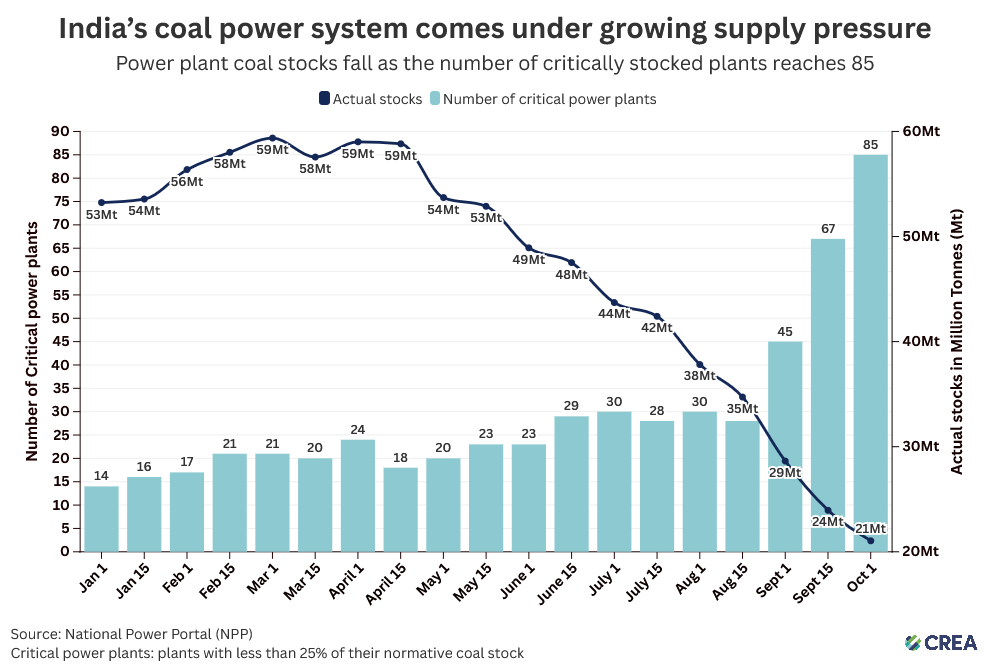
In Q2 FY2026–27, electricity generation increased 11% year-on-year, with renewable generation showing strong growth. Coal generation remained high, keeping coal consumption elevated even as power-plant stocks declined through the quarter. By 1 October, 85 plants had coal stocks below 25% of their normative requirement, highlighting growing pressure on the coal supply chain.
Key highlights
Demand
- Peak electricity demand reached 270 GW on 16 July 2026, 18% higher than the peak recorded during Q2 FY2025-26 (230 GW).
- During 62 of the 92 days in Q2 FY2026-27, the daily peak occurred during solar generation hours.
- Uttar Pradesh and Maharashtra recorded the highest state-level peak demand at 27 GW, followed by Gujarat (23 GW) and Tamil Nadu(20 GW).
Generation
- India’s electricity generation increased by 11% year-on-year during Q2 FY2026-27, reaching 536 billion units (BU).
- Solar remained the fastest-growing major source of electricity generation in Q2, increasing by 39% year-on-year, compared with 29% for wind and 26% for nuclear. Hydropower generation declined by 20% over the same period.
- Solar output again reached a new daily record, with 705 MU generated on 30 September, surpassing the previous record in Q1 FY2026-27.
- Renewable electricity generation (excluding large hydro) crossed 100 BU for the first time, reaching 101 BU, while combined non-fossil generation reached a record 177 BU, up from 163 BU in Q2 FY2025-26.
- Coal and lignite contributed 351 BU (around 66% of total generation), compared to 65% (312 BU) in Q2 FY2025-26, up 12.5% year-on-year.
- Combined non-fossil generation (renewables, hydropower and nuclear) reached a record 177 BU, up from 163 BU in the previous year.
Coal consumption, dispatch, stock and critical power plants
- Coal consumption in power plants remained around 79 million tonnes (Mt) per month from June through September.
- Coal supply did not keep pace with this high level of consumption. Coal dispatch to power plants declined from 74 Mt in May to 66 Mt in August, while average freight train coal rake loading fell from around 290 rakes per day in June to 280 in August.
- Coal stocks continued to fall, reaching 21 Mt by 30 September, just 36% of the normative requirement.
- Plants with coal stocks below 25% of their normative requirement increased from 32 on 22 August to 84 by 30 September and 85 by 1 October.
Energy storage
- About 9.1 GWh of India’s battery energy storage systems (BESS) are currently operational; around 3 GWh is expected to be commissioned by December 2026.
- As of August 2026, tenders for approximately 290 GWh of storage capacity have been issued, including 142 GWh of pumped storage projects (PSP) and 151 GWh of BESS.
- During nighttime peak demand, storage contributed up to 5.5 GW, up from 4.1 GW in the previous quarter (Q1 FY2026-27), meeting around 1-2% of national electricity demand.
Plant load factor
- For Q2 2026-27, India’s Plant Load Factor (PLF) for coal stands at 68%, lignite at 51%, gas at 18%, nuclear at 82%, large hydro at 50%, solar at 18.3%, wind at 37%, and small hydro at 44%.
Installed capacity
- As of August 2026, India’s total installed capacity stood at 555 GW. Coal remained the largest contributor at 224 GW, followed by solar (168 GW), wind (59 GW), and large hydro (52 GW).
- Non-fossil fuel sources (solar, wind, large hydro, other renewable energy, and nuclear) now account for approximately 55% of total installed capacity.
Capacity additions and retirements
- Renewables led capacity additions in Q2 2026-27, with 7 GW added, compared with 0.8 GW of thermal.
- About 648 MW of thermal power capacity (440 MW coal-based and 208 MW gas-based) were retired in Q2 2026-27.
Renewable energy curtailment
- Despite record renewable generation, significant volumes of renewable electricity continued to be curtailed because of grid and operational constraints.
- During July and August of Q2 FY2026, approximately 1835 million units (MU) of renewable energy generation was curtailed (1462 MU solar and 373 MU wind).
Source-wise installed electricity generation capacity in India
- India’s installed power capacity reached 555 GW at the end of August 2026, up 12% from August 2025, 23% from August 2024, and 31% from August 2023.
- Coal and lignite remained the largest installed sources at 231 GW (42%), though their share has steadily declined from 56% in 2019 and 45% in 2025.
- Renewable energy (excluding large hydro) grew the fastest, rising to 243 GW (44%) in August 2026 from 193 GW (39%) in August 2025, 153 GW (34%) in August 2024, and just 81 GW (23%) in August 2019.
- Solar drove much of this expansion, reaching 168 GW (30%) of total installed capacity.
- Large hydro capacity stood at 52 GW (9%), while gas declined to 19 GW (3%). Nuclear remained at 8.8 GW (2%).
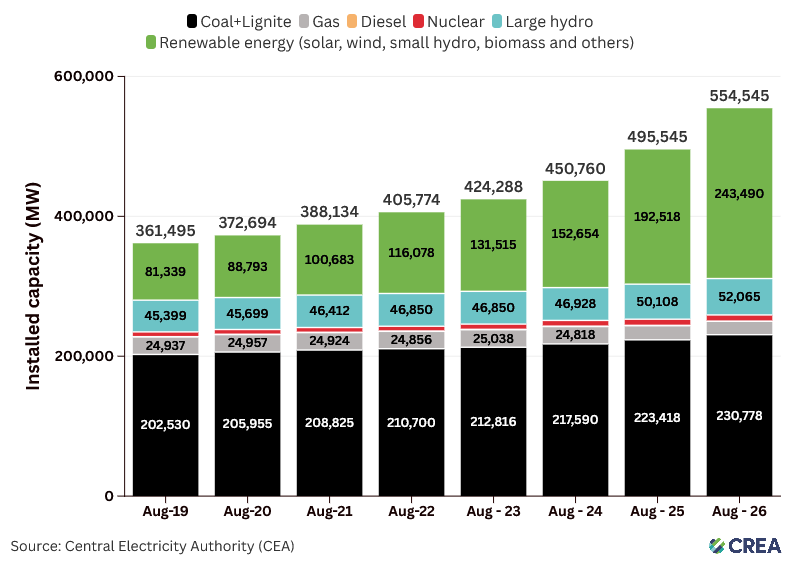
Figure 1 — Source-wise installed capacity in India
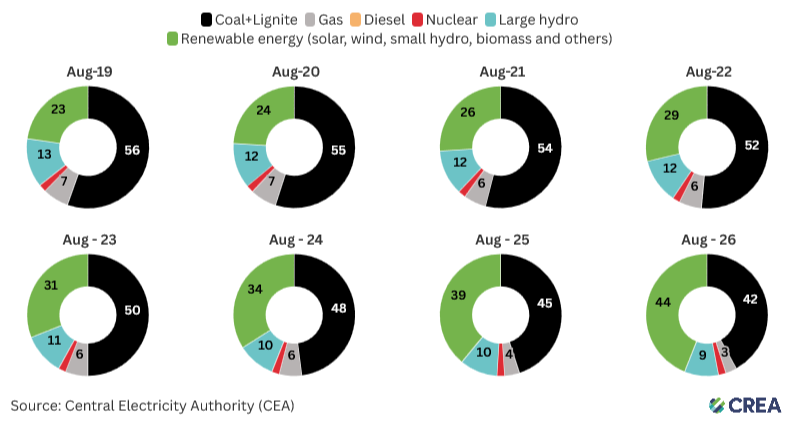
Figure 2 — Contribution of each source to total installed capacity
Commissioned, retired, and under construction thermal electricity generation capacity in India
- India commissioned 0.8 GW of new thermal power capacity in Q2 2026-27, entirely coal-based.
- About 648 MW of thermal capacity — 440 MW coal-based thermal power station (Tanda TPS-Unit 1) and 208 MW gas capacity (Godavari CCPP) — was retired in Q2 2026-27.
- As of August 2026, 44 GW of coal-based capacity is under construction.
- The central sector accounts for the largest share at 21 GW (47%), followed by the state sector at 9.8 GW (22%), and the private sector at 13.6 GW (31%).
- Much of the pipeline remains at an early stage of development, with nearly 40 GW (90%) of under-construction coal capacity below 50% completion.
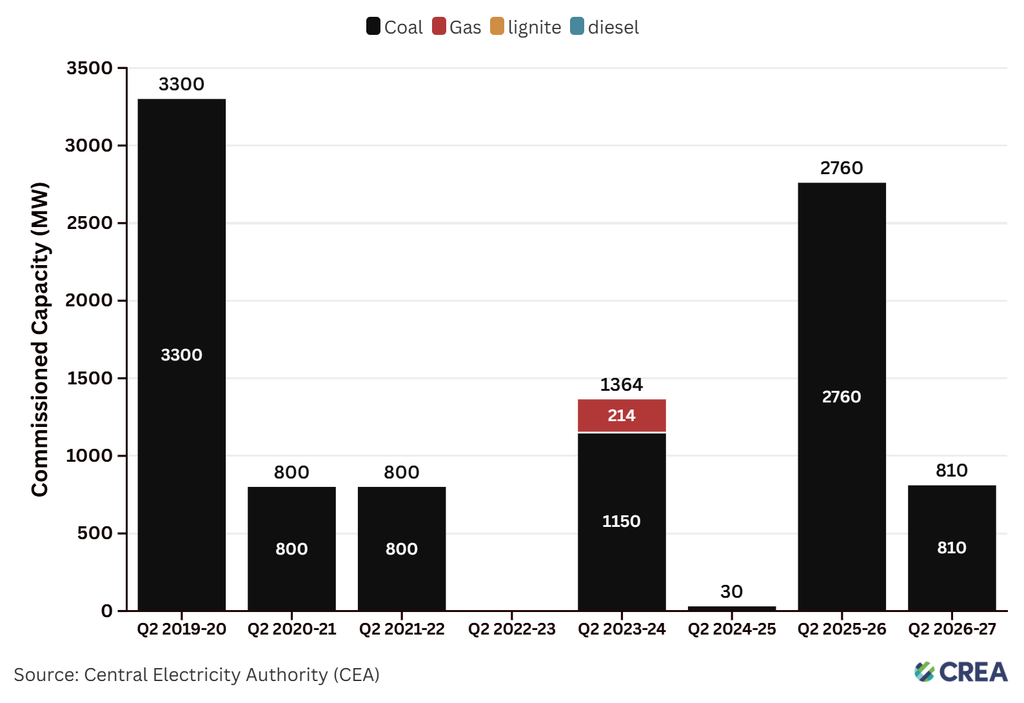
Figure 3 — Thermal capacity commissioned in Q2
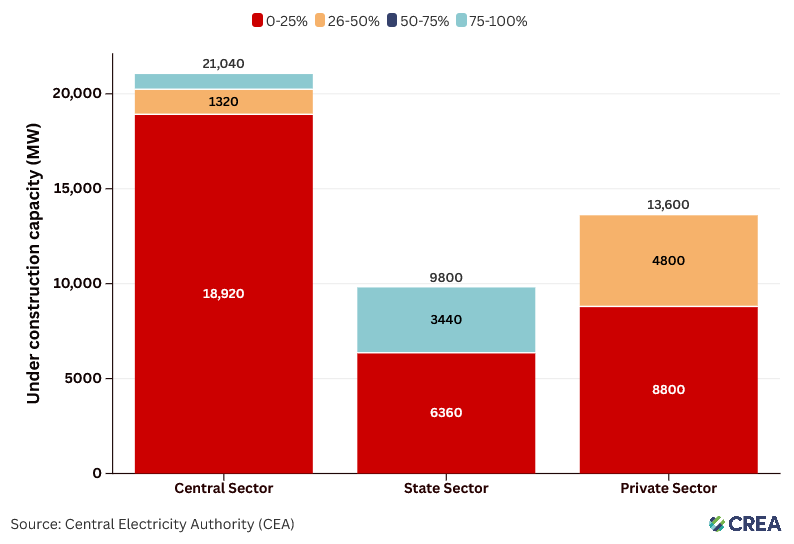
Figure 4 — Coal-based electricity generation capacity under construction in India by sector as of August 2026
Peak demand
- National peak demand reached 270 GW in Q2 FY2026-27, up 40 GW (18%) from last year’s 230 GW. In previous years, peak demand rose about 14% to 201 GW in FY2021-22 and held closely (199 GW) in FY2022-23. It then climbed 20% to 240 GW in FY2023-24, before easing to 231 GW in FY2024-25 and 230 GW in FY2025-26.
- At the state level, Uttar Pradesh and Maharashtra recorded the highest peak demand in Q2 2026–27 at 27 GW, followed by Gujarat (23 GW), Tamil Nadu (20 GW), and Karnataka (16 GW).
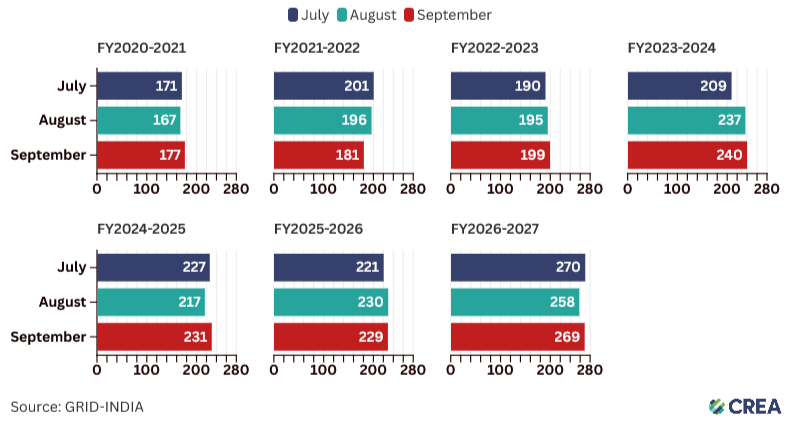
Figure 5 — Monthly maximum peak demand at national level during Q2
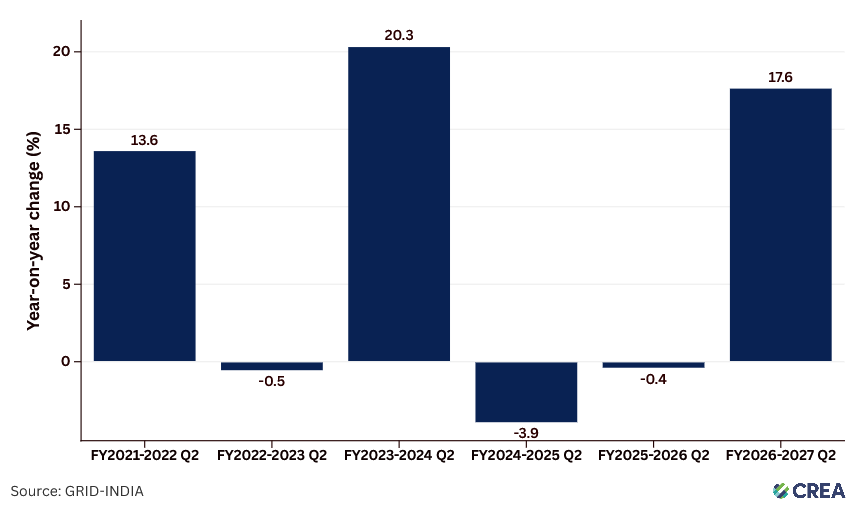
Figure 6 — Peak demand year-on-year change in Q2
Electricity generation
- Coal and lignite continued to dominate the generation mix in Q2 2026-27, contributing 351 BU (66%).
- Non-fossil fuel sources (including large hydro and nuclear) generation reached 177 BU in Q2 FY 2026-27, up 8% year-on-year.
- Renewable energy sources accounted for 19% of total generation.
- Nuclear contributed 16 BU (3%) to the total generation in Q2, while lignite (7.6 BU, 1%) and gas, naphtha and diesel (8 BU, 2%) made up smaller shares.
- Solar accounted for 58% of the increase in renewable electricity generation in Q2 FY2026–27, making it the primary driver of renewable generation growth.
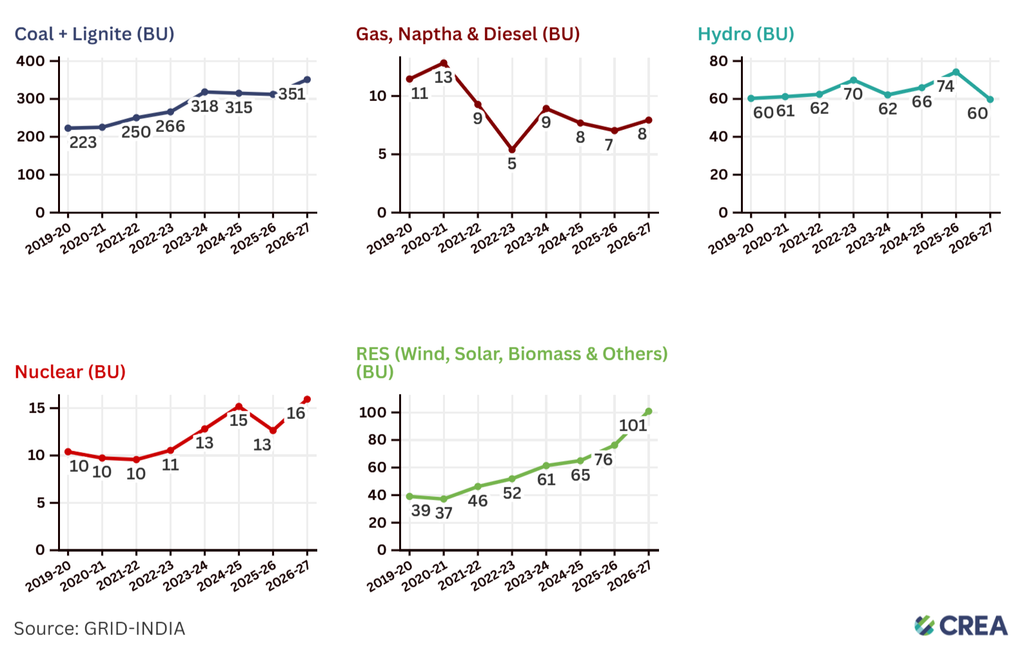
Figure 7 — Electricity generation by source in Q2
- Year-on-year growth in Q2 electricity generation slowed from 9% in Q2 2021-22 to 7% in Q2 2022-23, rose to 15% in Q2 2023-24, then fell to 1% in Q2 2024-25, recovered to 3% in Q2 2025-26, and increased to 11% in Q2 2026-27.
- Coal and lignite accounted for 73% of the year-on-year increase in electricity generation in Q2 FY2026–27, while solar and wind contributed 27% and 19%, respectively. Large hydro, in contrast, had a negative contribution of minus 27%.
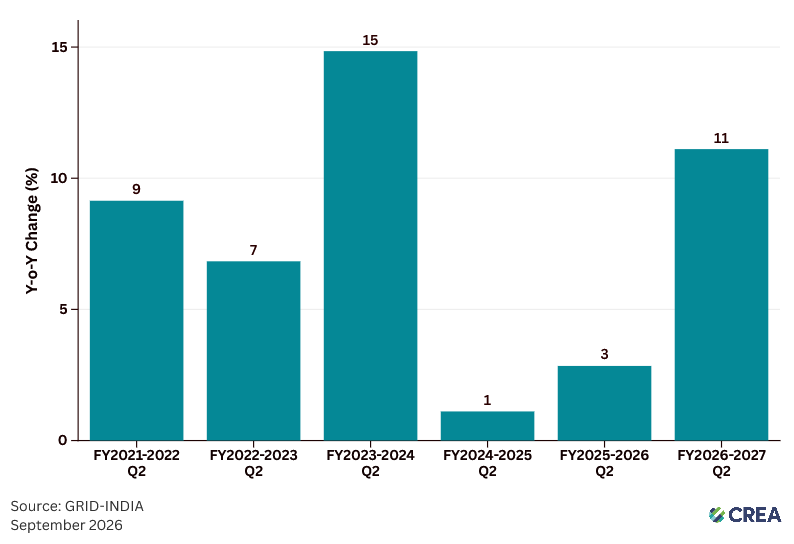
Figure 8 — India’s electricity generation year-on-year change
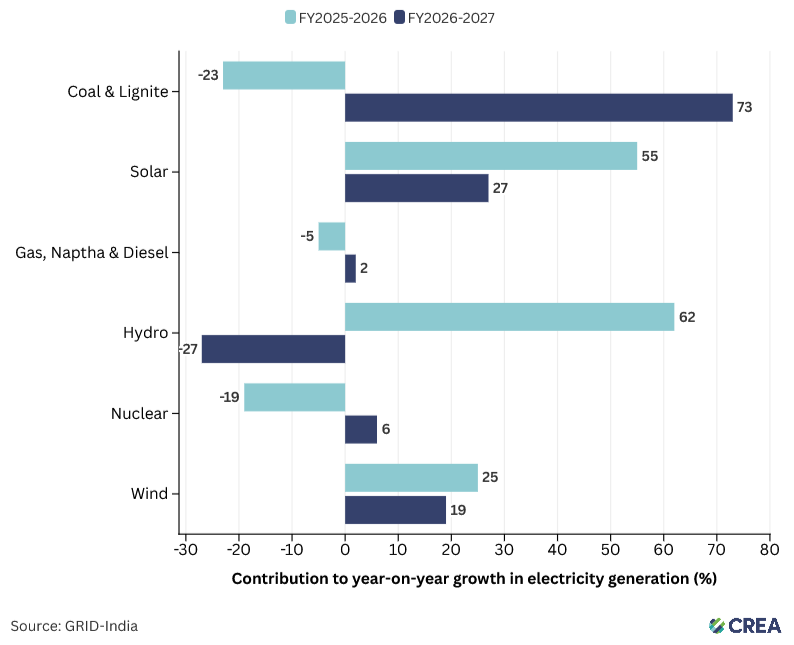
Figure 9 — Contribution of different sources to the year-on-year increase in India’s electricity generation (%)
Coal production, consumption, dispatch, and critical stocks
- Coal production followed the typical seasonal trend in July to August, increasing 7.6% year-on-year in July before declining 4.3% in August; August 2026 recorded the lowest monthly production so far this year.
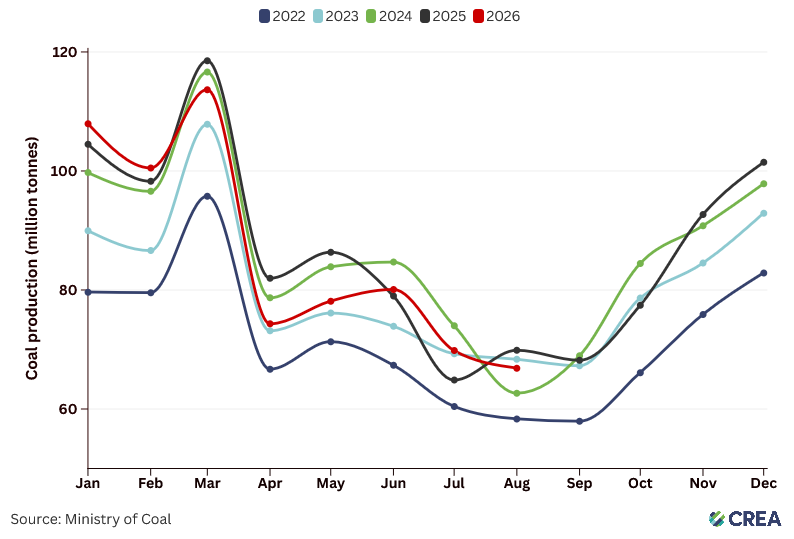
Figure 10 — Annual India coal production in million tonnes
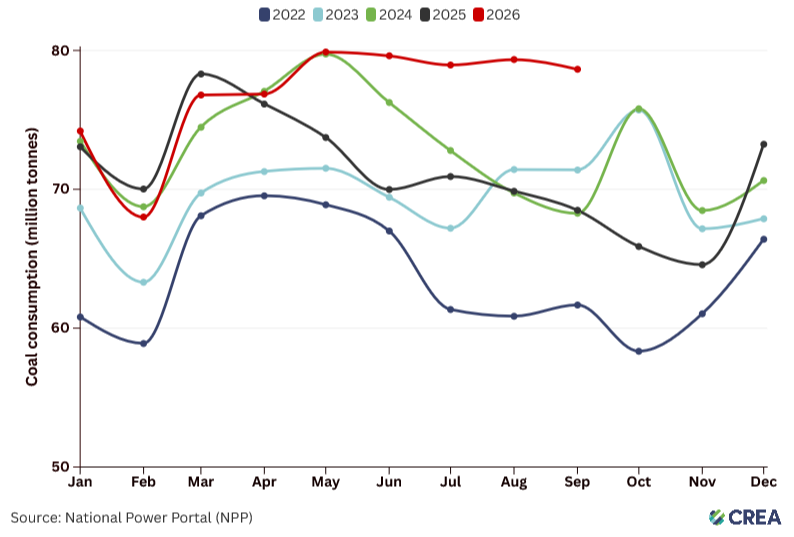
Figure 11 — India power plants coal consumption trends
- Coal consumption remained around 79 Mt per month from June through September. However, this high level of consumption came alongside growing stress on the coal supply system.
- Coal dispatch to power plants declined from 74 Mt in May to 66 Mt in August, indicating that coal supplies did not keep pace with consumption.
- Average coal rake loading to the power sector fell from around 290 rakes per day in June to 280 in August, even as coal consumption remained elevated. Coal rake loading was subsequently ramped up sharply in early September, reaching 444 rakes on 6 September. However, plant-level stocks continued to decline through the month, reaching 21 Mt by 30 September, only 36% of the normative requirement of 58 Mt.
- Coal plants were increasingly operating with critically low inventories. The number of plants with coal stocks below 25% of normative requirements rose sharply from 32 on 22 August to 61 on 8 September and 84 by 30 September, reaching 85 plants on 1 October.
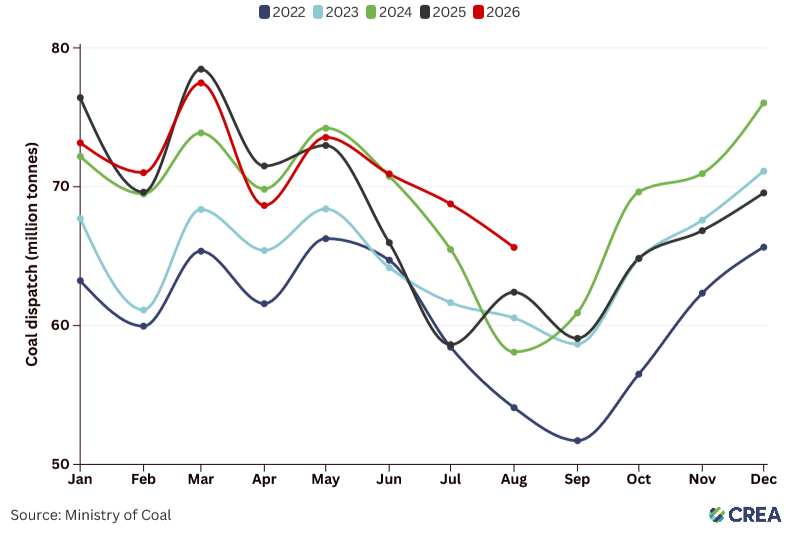
Figure 12 — Coal dispatch to India power plants
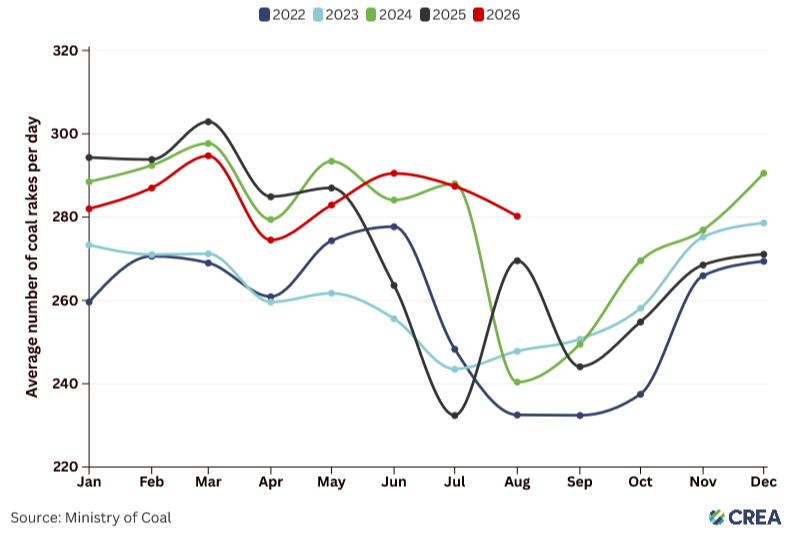
Figure 13 — Coal rake movement to India power plants
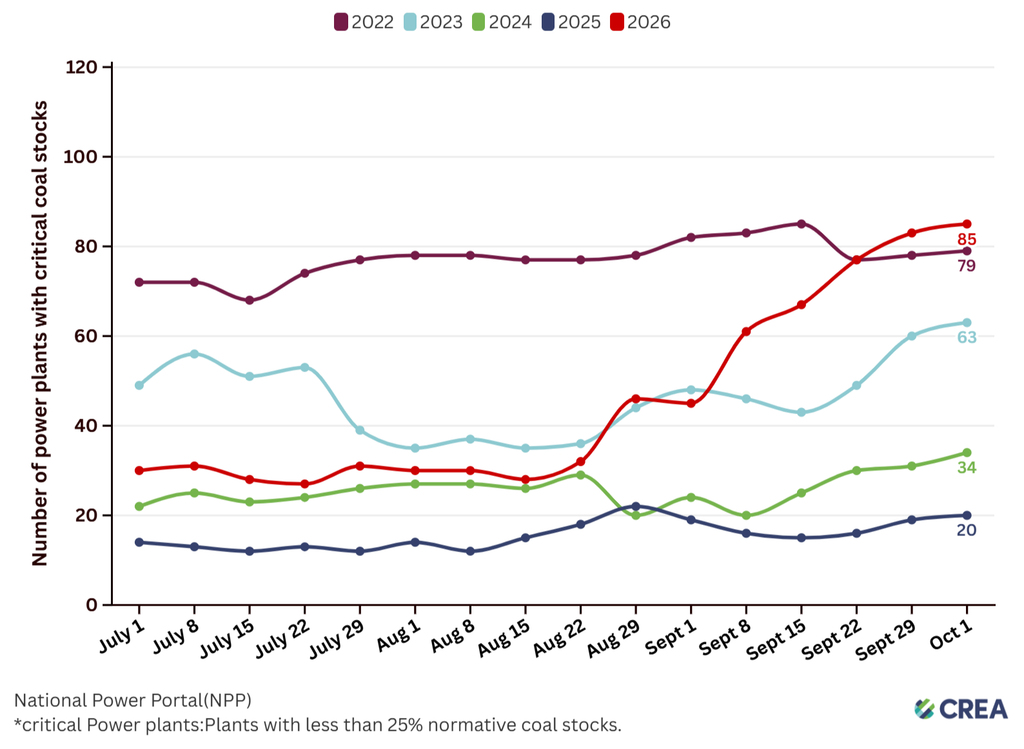
Figure 14 — India power plants with critical coal stocks
Plant load factor
- Solar Capacity Utilisation Factor (CUF) averaged 18.3% in Q2 2026-27, 0.3% less than that in Q2 2025-26.
- Wind CUF increased to 37% from 36% in Q2 2025-26, while small hydro CUF declined to 44% from 50% last year.
- Hydro PLF decreased to 50% in Q2 2026-27 from 61% in Q2 2025-26.
- Gas PLF rose to 18% from that of 16% in Q2 2025-26.
- Nuclear PLF increased to 82% in Q2 2026-27 from 65% in Q2 2025-26, while lignite PLF increased to 51% from 47% last year.
- Coal PLF rose to 68% in Q2 2026-27, after a dip to 62% in Q2 2025-26; before that, in Q2 2024-25 it was 65%, and in Q2 2023-24 it was 67%.
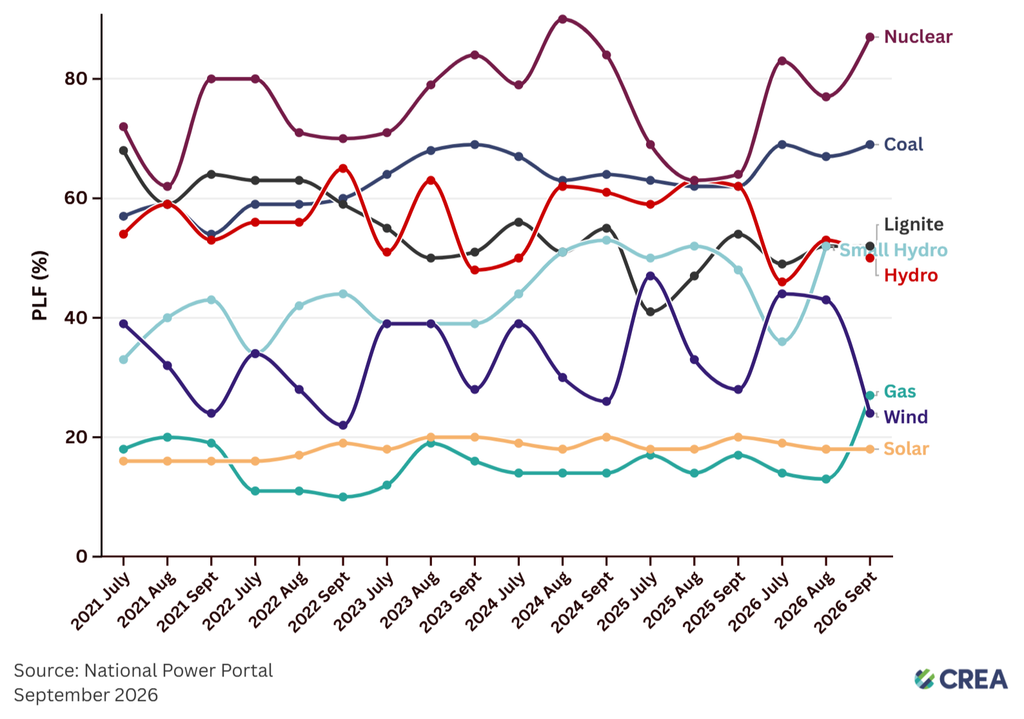
Figure 15 — India’s plant load factor in Q2 by source
Data sources
All data used in this assessment have been sourced from GRID-INDIA, the Ministry of Coal, the Central Electricity Authority (CEA), and the National Power Portal (NPP).
Quarterly energy snapshot for India: Q2 2026-27 (pdf version)
Press release – Quarterly energy snapshot for India: Q2 2026-27