
By Manoj Kumar N and Nandikesh Sivalingam
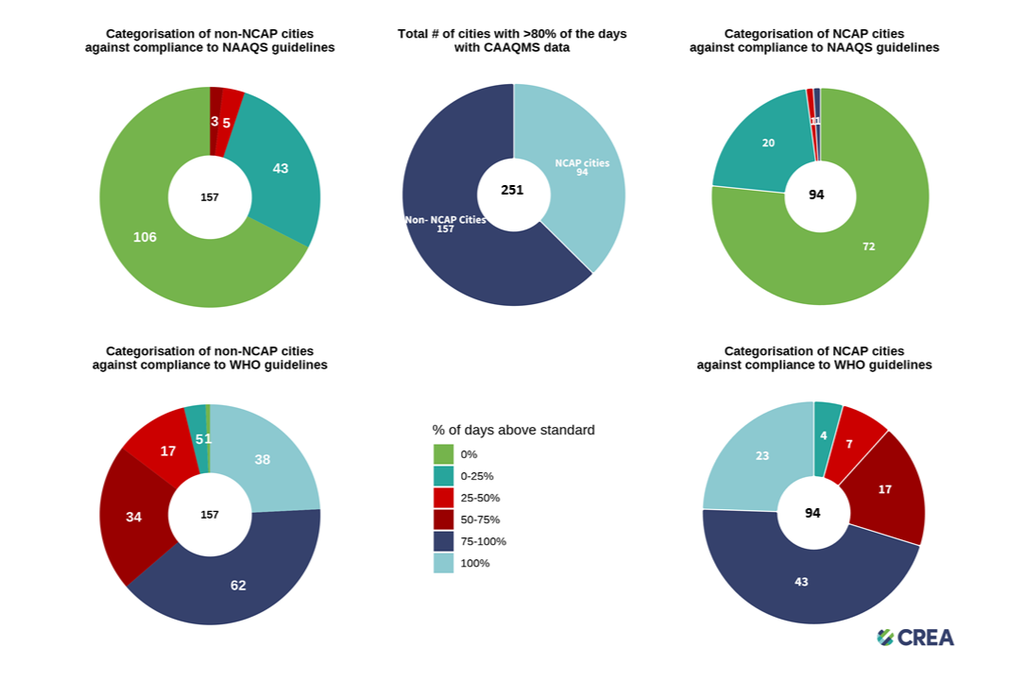
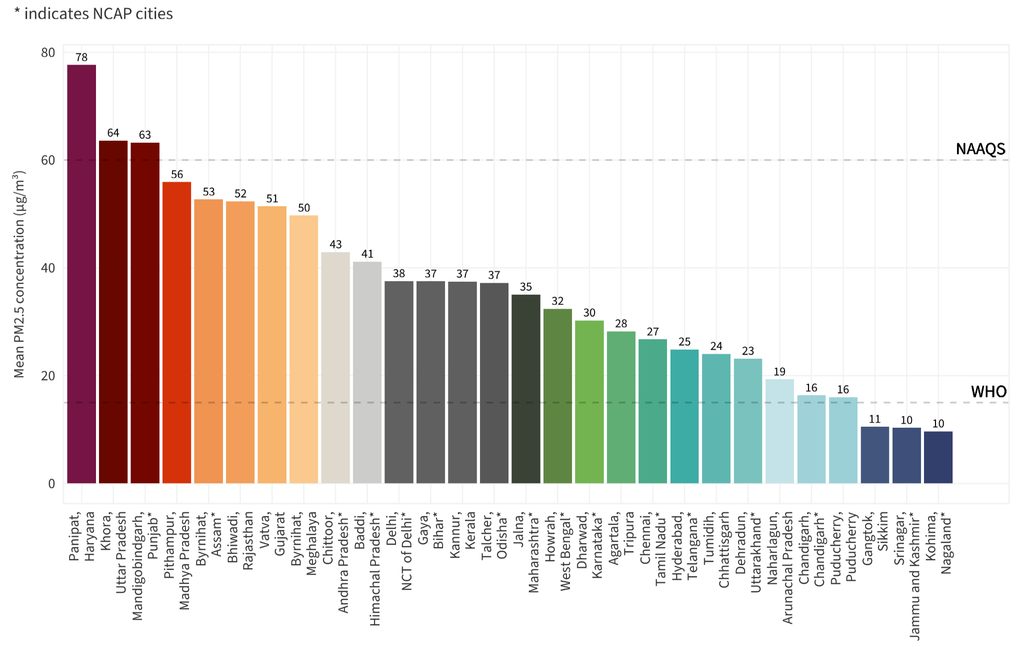
In September 2026, 230 of 251 Indian cities with sufficient CAAQMS data exceeded the WHO daily PM2.5 guideline of 15 µg/m³. Haryana state emerged as a major hotspot, accounting for five of the ten most polluted cities, while Panipat recorded the highest monthly average of PM2.5 at 78 µg/m³.
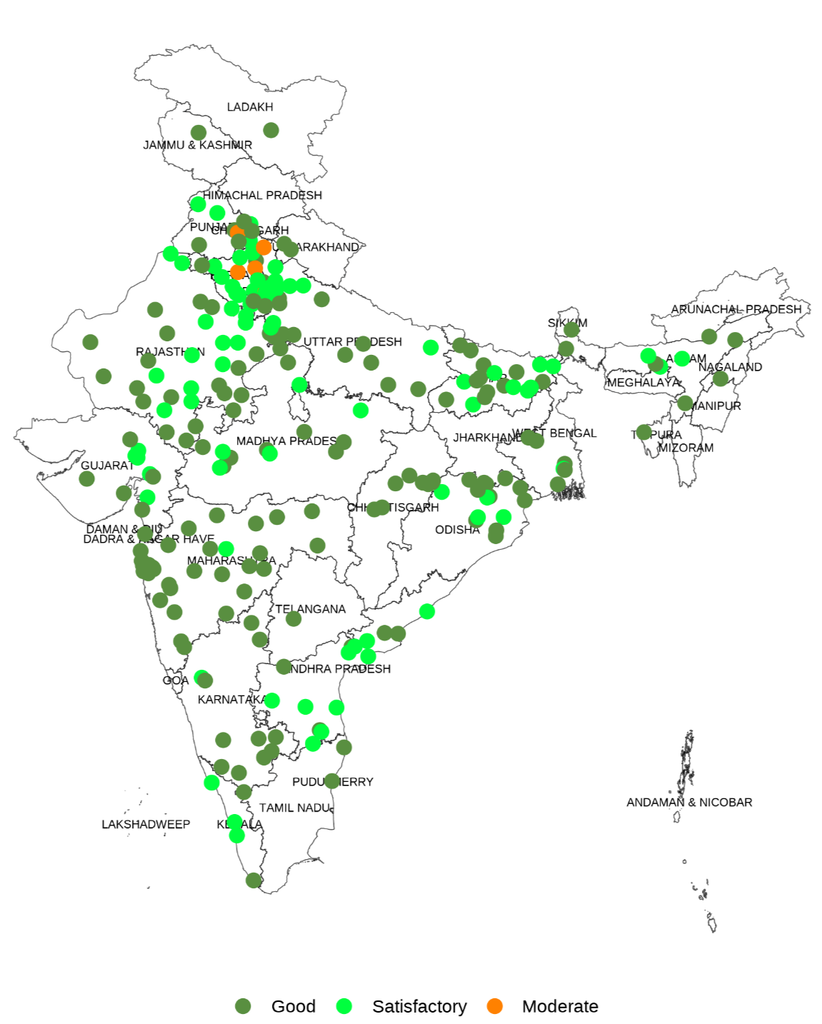
Distribution of Indian cities based on PM2.5 AQI during September 2026
Key highlights
- Compliance: In September 2026, 246 out of 251 cities with 80% and above days with continuous ambient air quality monitoring stations (CAAQMS) available data recorded PM2.5 concentrations below India’s National Ambient Air Quality Standards (NAAQS) of 60 µg/m³. Twenty-one cities complied with the World Health Organization’s (WHO) daily safe guideline concentration of 15 µg/m³.
- NCAP cities: The monthly average PM2.5 levels in 93 National Clean Air Programme (NCAP) cities (94 cities with more than 80% of days with data) complied with India’s daily NAAQS for PM2.5, while 86 of 94 NCAP cities exceeded the WHO’s daily guideline.
- Non-NCAP cities: Among the 157 non-NCAP cities with over 80% of days with CAAQMS data, 143 cities reported monthly average PM2.5 levels above the WHO daily guideline. Four cities exceeded the daily NAAQS.
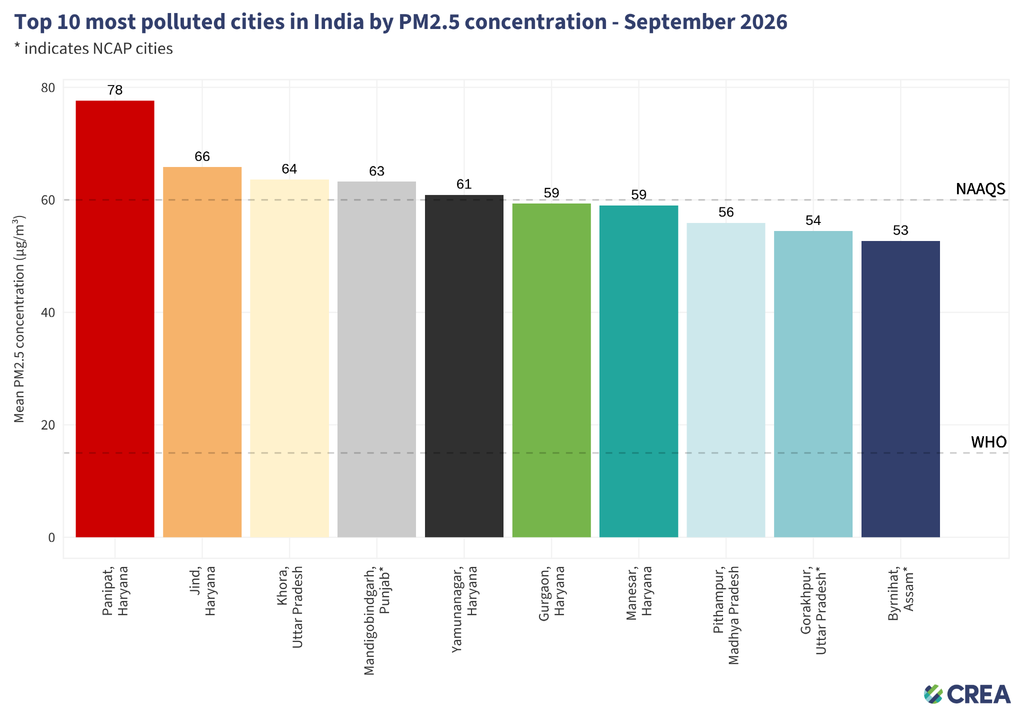
- Most polluted city: Panipat in Haryana ranked as the most polluted city in India in September 2026, recording a monthly average PM2.5 concentration of 78 µg/m³, surpassing the daily NAAQS limit of 60 µg/m³ for 20 days out of a total of 29 days of observation in the month.
- Panipat recorded five days in the ‘Very Poor’ category, six days in ‘Poor’ category, nine days in ‘Moderate’ category, three days in the ‘Satisfactory’ category, and six days in ‘Good’ category.
- Jind in the same state of Haryana was the second most polluted city in India during September 2026, with a monthly average PM2.5 of 66 µg/m³.
- In September 2026, Jind recorded two days in the ‘Poor’ category, 16 days in the ‘Moderate’ category, and 12 days in the ‘Satisfactory’ category.
- Khora, Mandi Gobindgarh, Yamuna Nagar, Gurugram, Manesar, Pithampur, Gorakhpur, and Byrnihat were in the top 10 cities, with Khora and Byrnihat in third and tenth places, respectively.
- Haryana accounted for five of the ten most polluted cities in September 2026, two cities in Uttar Pradesh, followed by one city each in Punjab, Madhya Pradesh, and Assam.
- State with most polluted cities: Among all Indian states, three cities in Haryana, followed by one city each in Punjab and Uttar Pradesh, exceeded the national ambient air quality standards of 60 µg/m³.
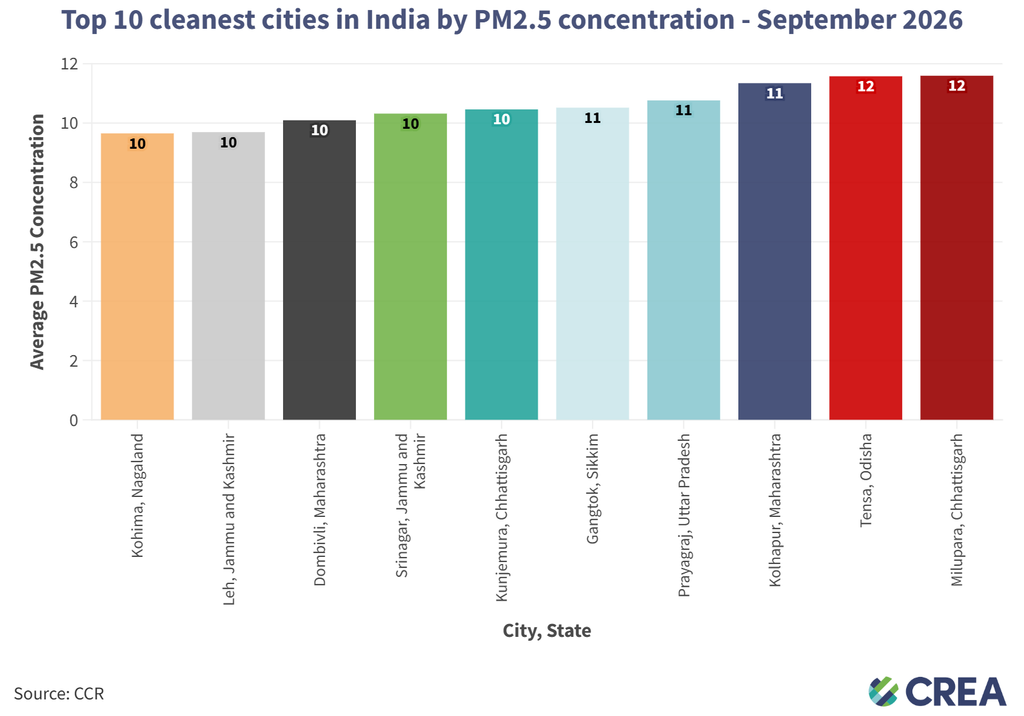
- Cleanest city: Kohima in Nagaland was recorded as the cleanest city in India during September 2026, with a monthly average PM2.5 of 10 µg/m³, followed by Leh in Jammu & Kashmir and by Dombivli in Maharashtra. The top 10 cleanest cities comprise two cities each in Chhattisgarh, Jammu & Kashmir, and Maharashtra, followed by one each in Nagaland, Odisha, Sikkim, and Uttar Pradesh.
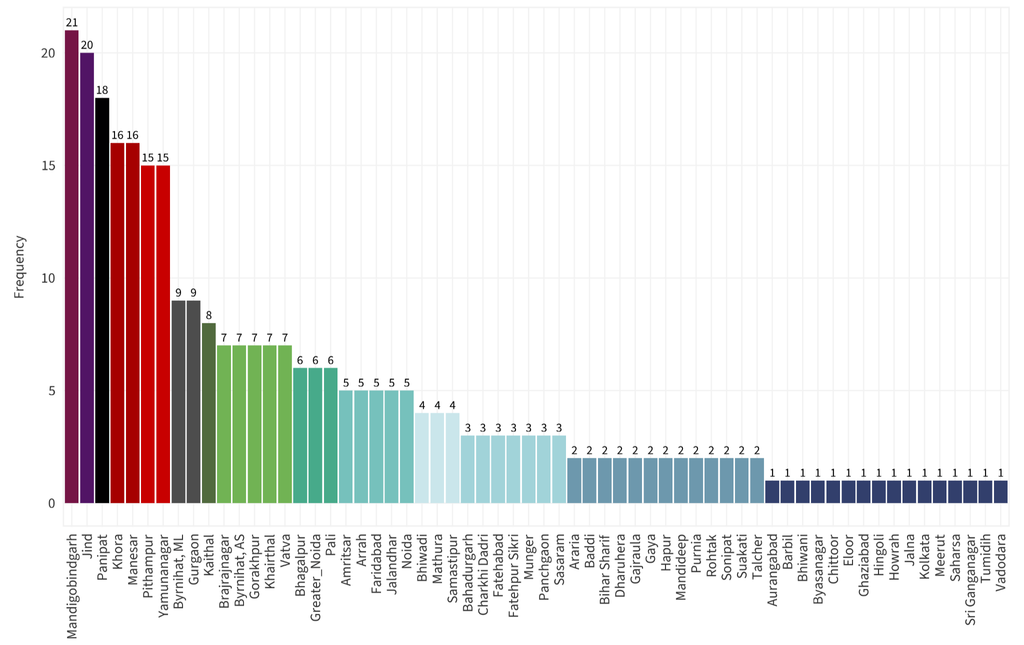
- Frequency in top 10 polluted cities: A total of 62 cities were featured in the daily top 10 most polluted cities list in September 2026, topped by Mandi Gobindgarh (21 days), followed by Jind (20 days), Panipat (18 days), Khora (16 days), Manesar (16 days), Pithampur (15 days), and Yamuna Nagar (15 days).
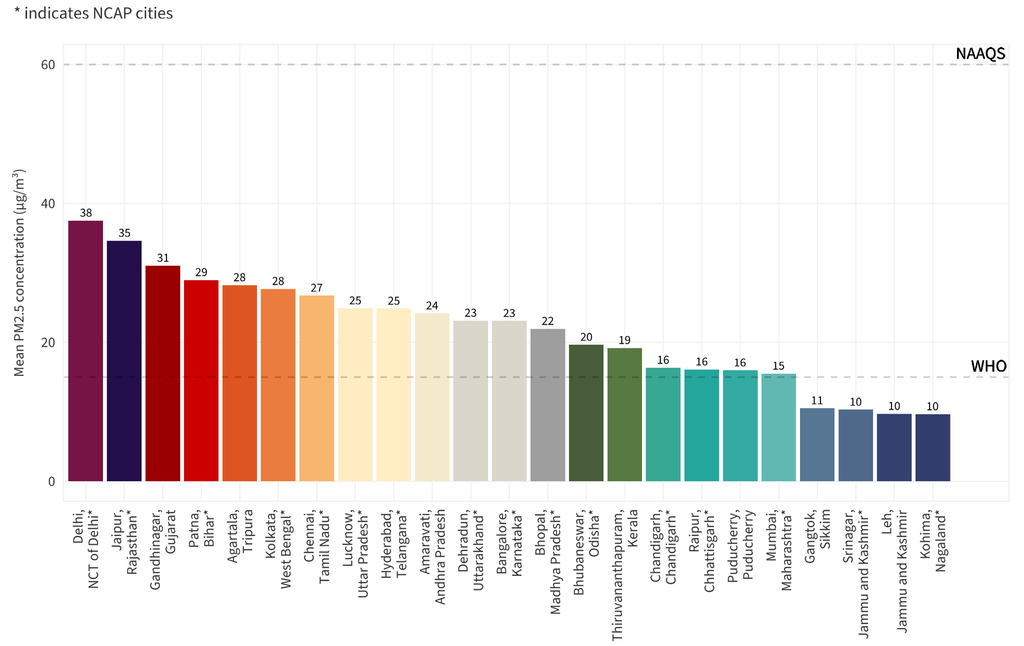
- Megacities: Delhi (38 µg/m³), Kolkata (28 µg/m³), Chennai (27 µg/m³), Bangalore (23 µg/m³), and Mumbai (15 µg/m³) all recorded monthly average PM2.5 levels below the daily standard.
Number of cities vs. frequency of days with PM2.5 concentration above NAAQS and WHO guidelines – September 2026
Top 10 most polluted cities in India by PM2.5 concentration – September 2026
| Days in respective AQI categories based on PM2.5 (µg/m3) – September 2026 | ||||||
|---|---|---|---|---|---|---|
| City | Good (0-30) | Satisfactory (31-60) | Moderate (61-90) | Poor (91-120) | Very poor (121-250) | Severe (>250) |
| Panipat | 6 | 3 | 9 | 6 | 5 | 0 |
| Jind | 0 | 12 | 16 | 2 | 0 | 0 |
| Khora | 4 | 10 | 9 | 6 | 1 | 0 |
| Mandi Gobindgarh | 4 | 3 | 22 | 1 | 0 | 0 |
| Yamunanagar | 0 | 15 | 13 | 2 | 0 | 0 |
| Gurgaon | 1 | 20 | 3 | 3 | 3 | 0 |
| Manesar | 2 | 15 | 10 | 3 | 0 | 0 |
| Pithampur | 2 | 19 | 7 | 2 | 0 | 0 |
| Gorakhpur | 4 | 20 | 4 | 0 | 0 | 1 |
| Byrnihat | 0 | 27 | 1 | 0 | 0 | 0 |
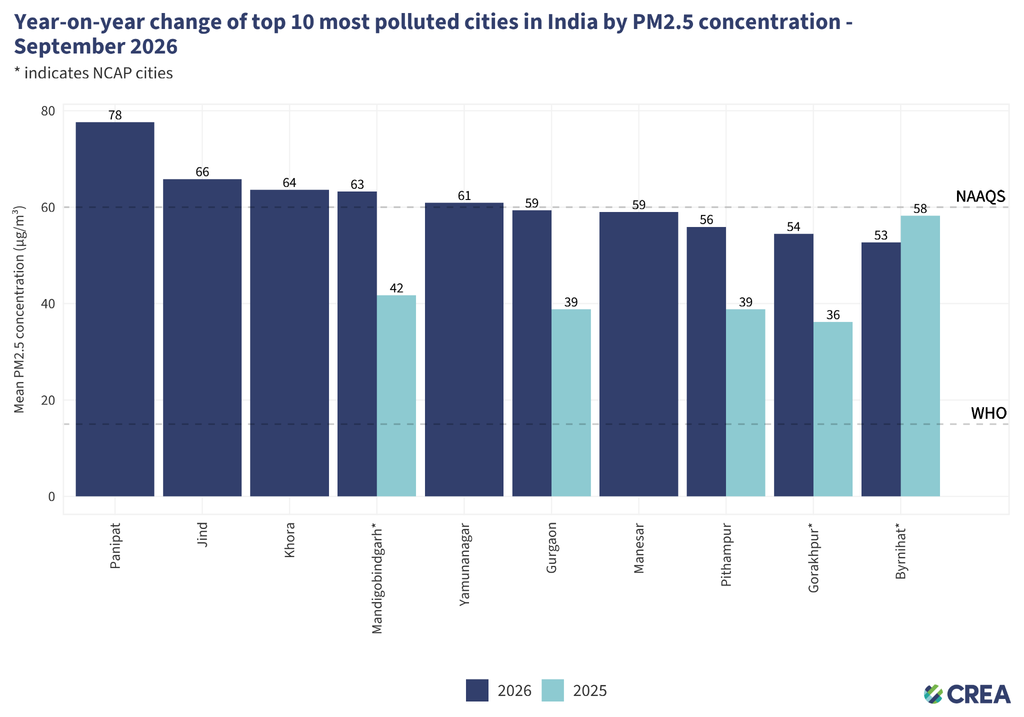
Status of PM2.5 concentration in September 2025 for top 10 most polluted cities in September 2026 across India
| Days in respective AQI categories based on PM2.5 (µg/m3) – September 2025 | ||||||
|---|---|---|---|---|---|---|
| City | Good (0-30) | Satisfactory (31-60) | Moderate (61-90) | Poor (91-120) | Very poor (121-250) | Severe (>250) |
| Byrnihat | 0 | 20 | 9 | 0 | 0 | 0 |
| Gorakhpur | 9 | 20 | 1 | 0 | 0 | 0 |
| Gurgaon | 10 | 18 | 2 | 0 | 0 | 0 |
| Mandi Gobindgarh | 12 | 11 | 6 | 1 | 0 | 0 |
| Pithampur | 6 | 23 | 1 | 0 | 0 | 0 |
Distribution of cities by PM2.5 air quality index (AQI) based on monthly average PM2.5 concentrations – September 2026
| State/UT | Number of cities in AQI category (PM2.5 μg/m3) | ||||
| Good (0-30) | Satisfactory (31-60) | Moderate (61-90) | Poor (91-120) | Very Poor (121-250) | |
| Andhra Pradesh | 5 | 10 | 0 | 0 | 0 |
| Arunachal Pradesh | 1 | 0 | 0 | 0 | 0 |
| Assam | 3 | 3 | 0 | 0 | 0 |
| Bihar | 11 | 8 | 0 | 0 | 0 |
| Chandigarh | 1 | 0 | 0 | 0 | 0 |
| Chhattisgarh | 8 | 0 | 0 | 0 | 0 |
| Gujarat | 6 | 5 | 0 | 0 | 0 |
| Haryana | 5 | 16 | 3 | 0 | 0 |
| Himachal Pradesh | 0 | 1 | 0 | 0 | 0 |
| Jammu and Kashmir | 2 | 0 | 0 | 0 | 0 |
| Karnataka | 11 | 1 | 0 | 0 | 0 |
| Kerala | 1 | 3 | 0 | 0 | 0 |
| Madhya Pradesh | 8 | 4 | 0 | 0 | 0 |
| Maharashtra | 33 | 2 | 0 | 0 | 0 |
| Meghalaya | 0 | 1 | 0 | 0 | 0 |
| NCT of Delhi | 0 | 1 | 0 | 0 | 0 |
| Nagaland | 1 | 0 | 0 | 0 | 0 |
| Odisha | 12 | 4 | 0 | 0 | 0 |
| Puducherry | 1 | 0 | 0 | 0 | 0 |
| Punjab | 4 | 2 | 1 | 0 | 0 |
| Rajasthan | 21 | 14 | 0 | 0 | 0 |
| Sikkim | 1 | 0 | 0 | 0 | 0 |
| Tamil Nadu | 1 | 0 | 0 | 0 | 0 |
| Telangana | 1 | 0 | 0 | 0 | 0 |
| Tripura | 1 | 0 | 0 | 0 | 0 |
| Uttar Pradesh | 12 | 13 | 1 | 0 | 0 |
| Uttarakhand | 1 | 0 | 0 | 0 | 0 |
| West Bengal | 6 | 1 | 0 | 0 | 0 |
Top 10 cleanest cities in India by PM2.5 concentration – September 2026
| Days in respective AQI categories based on PM2.5 (µg/m3) – September 2026 | ||||||
|---|---|---|---|---|---|---|
| City | Good (0-30) | Satisfactory (31-60) | Moderate (61-90) | Poor (91-120) | Very poor (121-250) | Severe (>250) |
| Kohima | 29 | 0 | 0 | 0 | 0 | 0 |
| Leh | 26 | 0 | 0 | 0 | 0 | 0 |
| Dombivli | 28 | 2 | 0 | 0 | 0 | 0 |
| Srinagar | 30 | 0 | 0 | 0 | 0 | 0 |
| Kunjemura | 30 | 0 | 0 | 0 | 0 | 0 |
| Gangtok | 30 | 0 | 0 | 0 | 0 | 0 |
| Prayagraj | 30 | 0 | 0 | 0 | 0 | 0 |
| Kolhapur | 30 | 0 | 0 | 0 | 0 | 0 |
| Tensa | 28 | 1 | 0 | 0 | 0 | 0 |
| Milupara | 28 | 0 | 0 | 0 | 0 | 0 |
PM2.5 concentrations across state capital cities in India – September 2026
Frequency of appearance of respective cities in top 10 most polluted cities in India by PM2.5 concentration – September 2026
State-wise most polluted cities (PM2.5, µg/m3) in India – September 2026
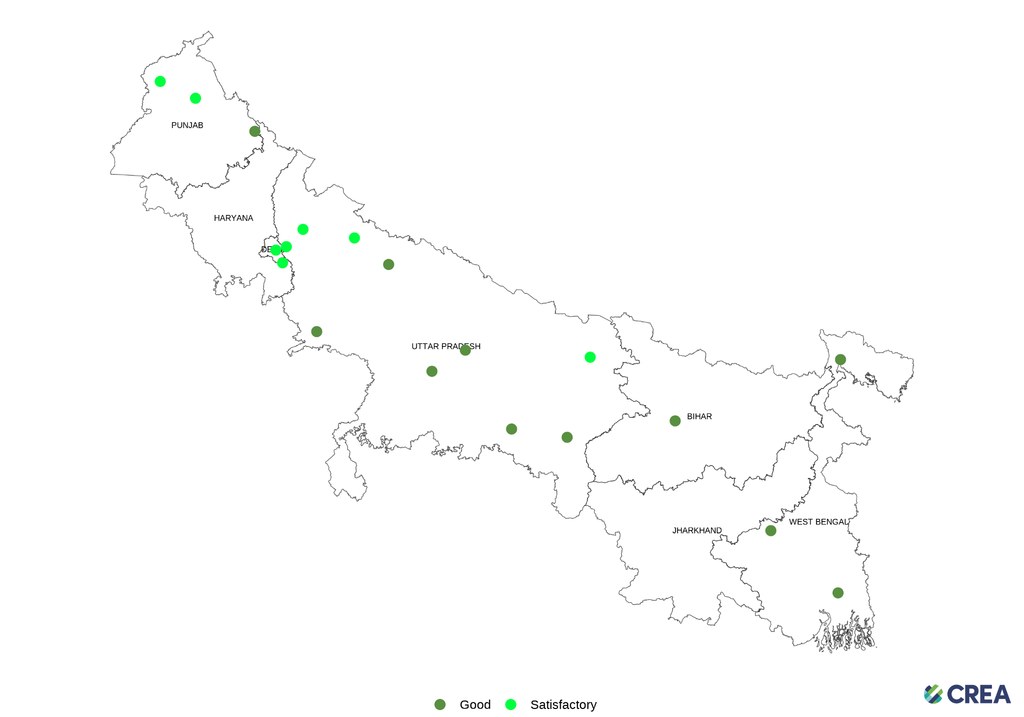
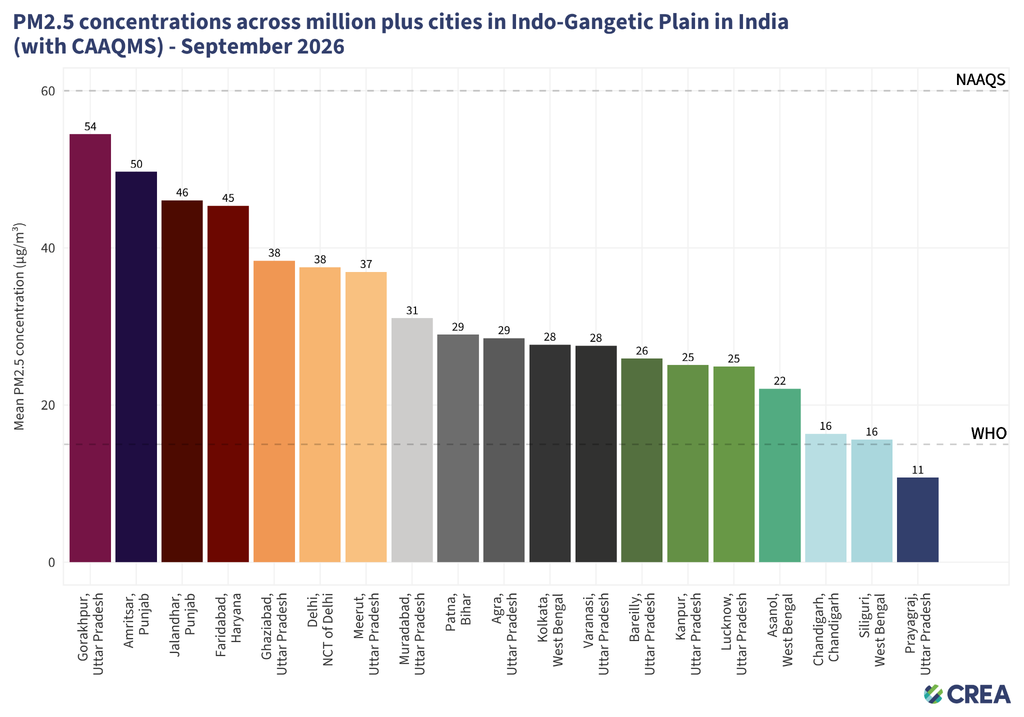
PM2.5 concentrations across million-plus cities with CAAQMS in Indo-Gangetic Plain in India – September 2026
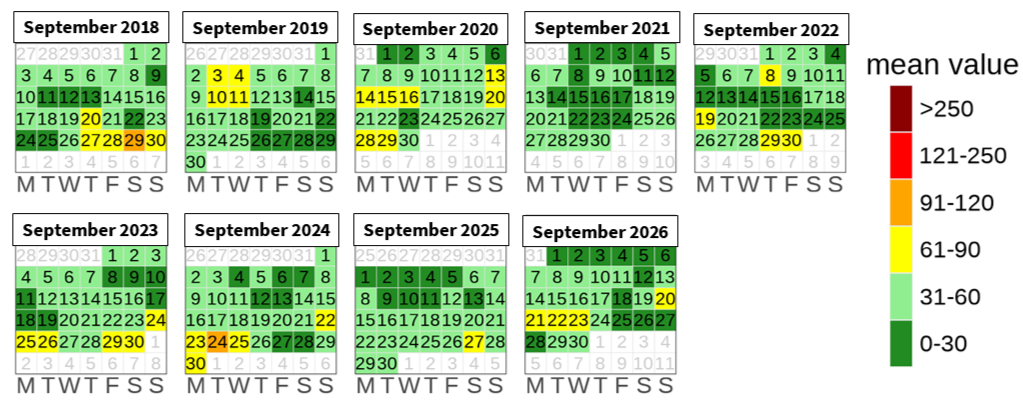
Ambient air quality status in Delhi – September 2026 (PM2.5 concentration, µg/m3)
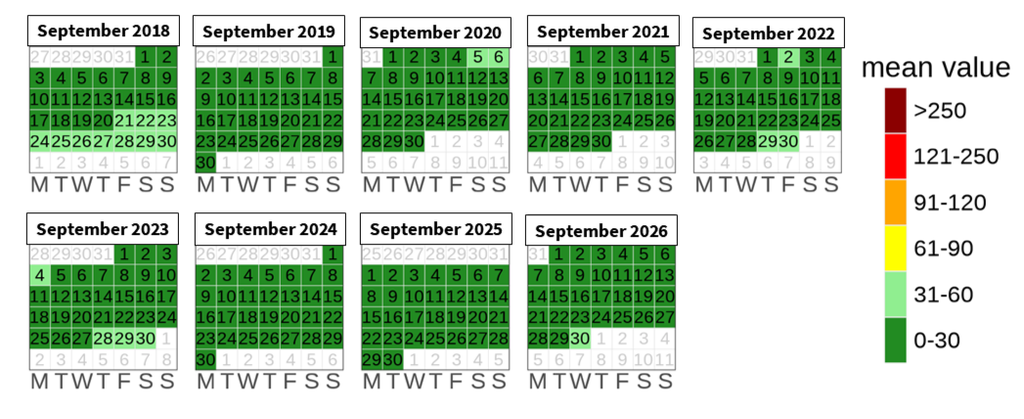
Ambient air quality status in Mumbai – September 2026 (PM2.5 concentration, µg/m3)
Ambient air quality status in Chennai – September 2026 (PM2.5 concentration, µg/m3)
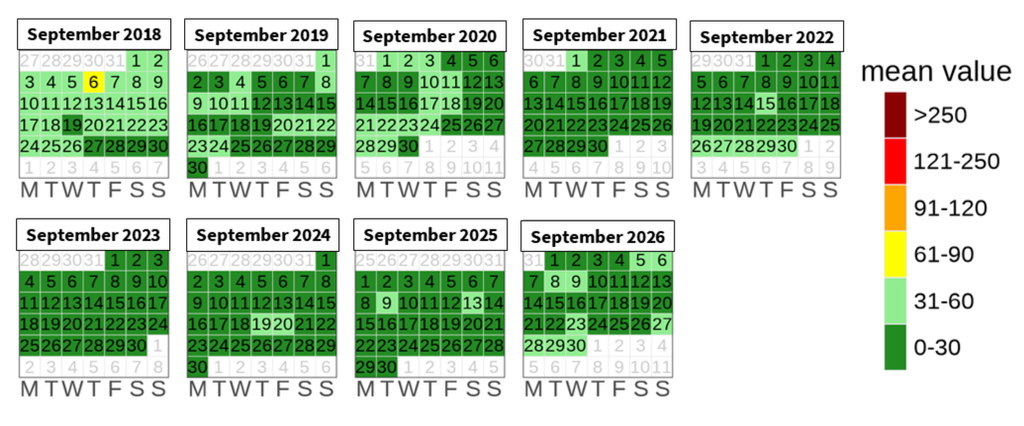
Ambient air quality status in Bangalore – September 2026 (PM2.5 concentration, µg/m3)
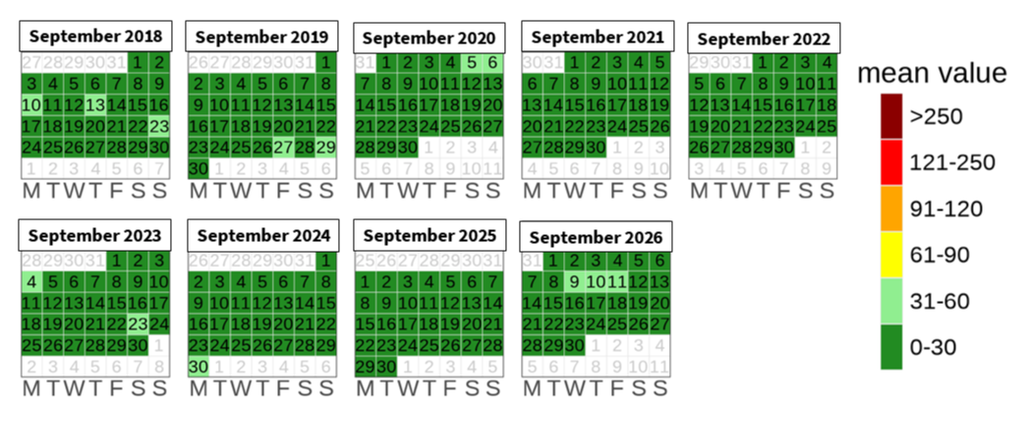
Ambient air quality status in Kolkata – September 2026 (PM2.5 concentration, µg/m3)
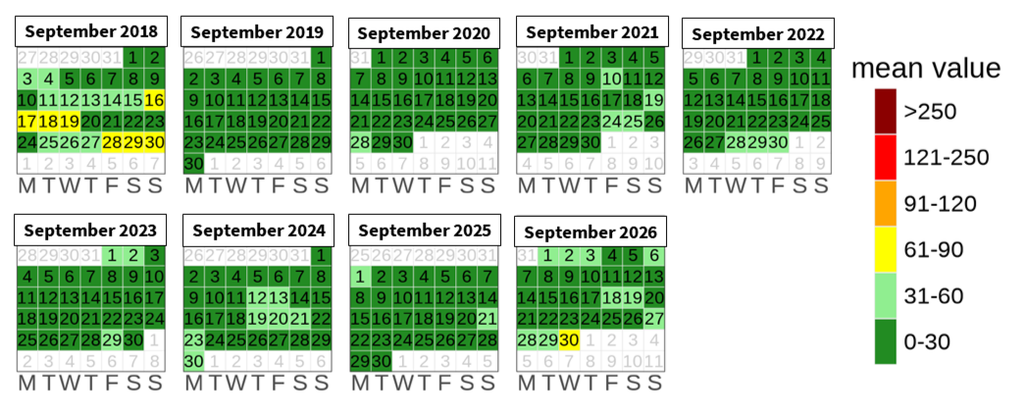
Data sources
Ambient air quality data recorded by Continuous Ambient Air Quality Monitoring Stations (CAAQMS) is downloaded from the ‘Central Control Room for Air Quality Management – All India’ dashboard operated by the Central Pollution Control Board (CPCB).
Resources
To subscribe to these monthly air quality snapshots and to access the graphs and web version of this snapshot on our website here- India monthly ambient air quality snapshot
Monthly ambient air quality snapshot for India – September 2026 (pdf version)