
Fossil fuel importers paid extra USD 330 bn for seaborne crude oil, oil products and LNG in six months following strikes against what pre-war futures markets had forecast, while in first five months of the crisis, clean power generation added since 2020 saved importing countries estimated USD 36 bn
Authors: Luke Wickenden and Lauri Myllyvirta
Key findings
- Fossil fuel importers paid a gross extra cost of USD 330 bn for seaborne crude oil, oil products and LNG in the six months following the strikes, against what pre-war futures markets had expected they would pay over the same period. This is the estimated gross additional cost to importers, before accounting for the additional earnings of countries that also export.
- The US–Iran war has caused the largest sustained oil price shock since the 1990 Gulf War. During the conflict’s first six months, Asian LNG prices averaged 75% above pre-war expectations, European LNG prices 60% above, diesel 59% above and crude oil 35% above.
- In absolute terms, the highest gross extra costs were faced by the EU (USD 78 bn), China (USD 35 bn), and India (USD 22 bn). Among importers, the typical low- or middle-income country paid about twice as much relative to GDP as the typical high-income country.
- In the first five months of the crisis alone, clean power generation added since 2020 saved importing countries an estimated USD 36 bn in avoided coal, gas and oil imports.
- The cost of the crisis to fossil fuel importers equalled all global investments in renewable power in 2025, on a per-month average basis.
Quantifying the cost of the Hormuz crisis
Fossil fuel importers paid a gross extra cost of USD 330 bn for seaborne crude oil, oil products, and LNG in the six months following the US-Israel strikes on Iran, compared with what pre-war futures markets had expected they would pay over the same period.
In the 12 days before the US and Israel first struck Iran, futures markets were already pricing every delivery month of 2026. We compare actual fossil fuel prices over the past six months with those monthly expected prices.
- Crude oil accounts for USD 164.1 bn of the gross increase in fossil fuel import cost; diesel and gasoil, USD 73.8 bn; gasoline, USD 35.7 bn; LNG, USD 38.0 bn across both basins; and jet fuel, USD 20.0 bn.
- Volumes reflect what importers actually bought, not what they would have bought at pre-war prices, so these figures already reflect the fall in demand. The analysis excludes the cost of suppressed demand when buyers could not afford fuel imports due to higher prices; it measures payments rather than welfare. The analysis also excludes freight and war-risk premiums, pipeline gas, coal, fuel oil, naphtha and blending components. These exclusions make the estimate conservative.
Clean energy investments have helped contain the crisis
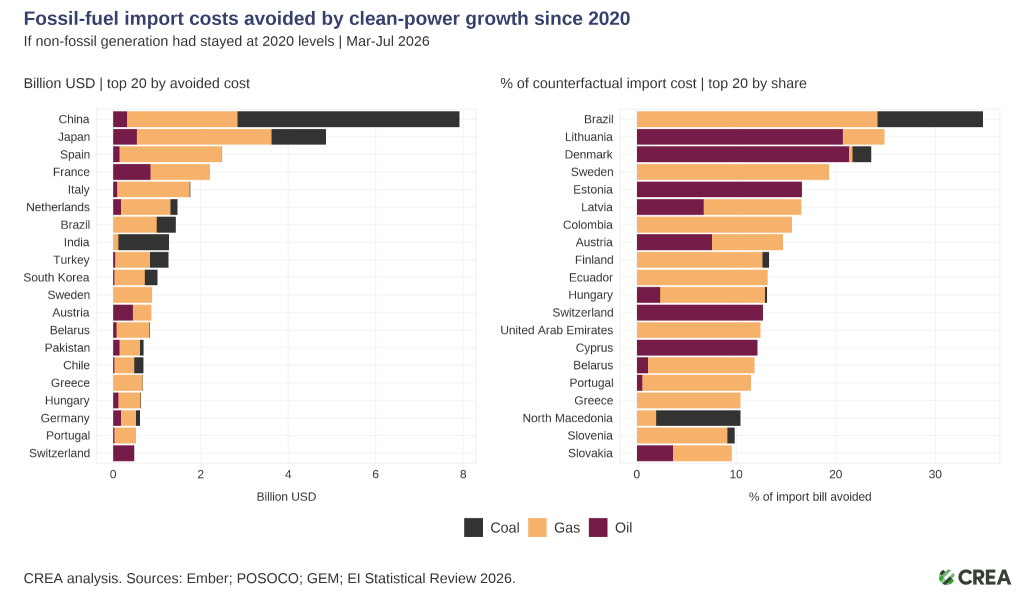
Figure 1 — Fossil-fuel import costs avoided by clean-power growth since 2020
Note: The counterfactual holds non-fossil power generation at 2020 levels, March to July 2026. The left panel shows the entire import bill avoided by clean power generation; the right panel shows the portion of that bill created by the war, so it is included within the left-hand figure rather than added to it. The chart shows the top 20 countries by avoided cost.
- In the first five months of the crisis alone, clean power generation added since 2020 saved importing countries an estimated USD 36 billion in avoided coal, gas and oil imports. This includes USD 22 bn in gas imports, USD 10 bn in coal imports, and USD 5 bn in oil imports.
- USD 10.6 bn of the total, about 29%, exists only because of the US-Iran war. Prices ran above what the market had expected before the strikes, so every tonne of coal and cubic metre of gas these countries did not have to buy also spared them the war mark-up on these foregone purchases. The remaining USD 25.9 bn is the underlying cost of fuel they would have avoided buying at the expected pre-war prices.
- In absolute terms, the largest savings were in China (USD 7.9 bn) and Japan (USD 4.9 bn), followed by Spain, France, Italy, the Netherlands, Brazil and India.
- Measured against what each country’s fossil fuel import bill would otherwise have been, Brazil avoided 35%, Lithuania 25%, Denmark 24% and Sweden 19% of the total national import value. Outside the EU, Brazil and Colombia saw the largest proportional savings.
- According to the IEA, in 2025, global renewable power investments totalled USD 700 bn or USD 58 bn per month. Global monthly investment in renewable power was just 5.6% higher than the USD 55.3 billion in additional monthly fossil fuel import costs caused by higher seaborne oil and gas prices following the war on Iran.
Prices have not returned to what the market expected
The largest sustained price shock since the 1990 Gulf War
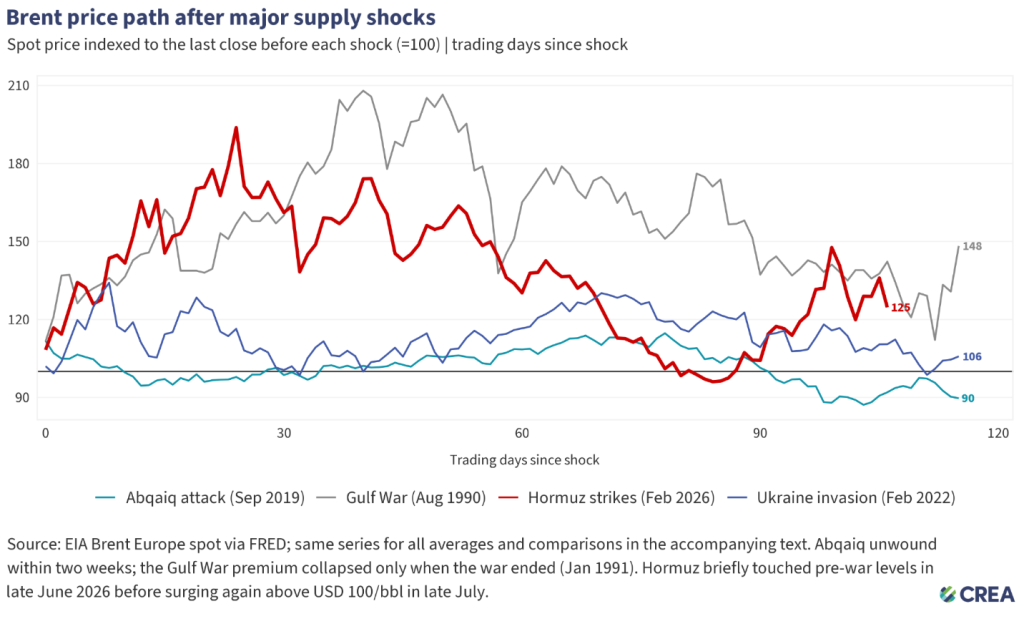
Figure 2 — Brent price paths after major supply shocks
- Brent crude oil prices peaked at almost double their pre-strike level in the weeks after the strikes and have averaged 38% above it since. Of the major supply shocks of the past three decades, only the 1990 Gulf War ran higher. Oil has traded above its pre-strike level on 94% of trading days.
- Brent crude oil prices briefly fell below pre-strike levels in late June 2026, then spiked to USD 105 a barrel on 23 July before easing back, with the July average at USD 84 per barrel.
In absolute terms, crude oil is at its highest sustained price since 2022, after Russia’s full-scale invasion of Ukraine
- Brent spot price averaged USD 93 per barrel between March and August 2026. No six-month stretch has reached that average price of Brent crude since the spike ending in December 2022, when markets were still absorbing the increase in oil prices following the start of Russia’s full-scale invasion of Ukraine.
Prices spiked well beyond what the futures curves predicted on the first session after the strikes
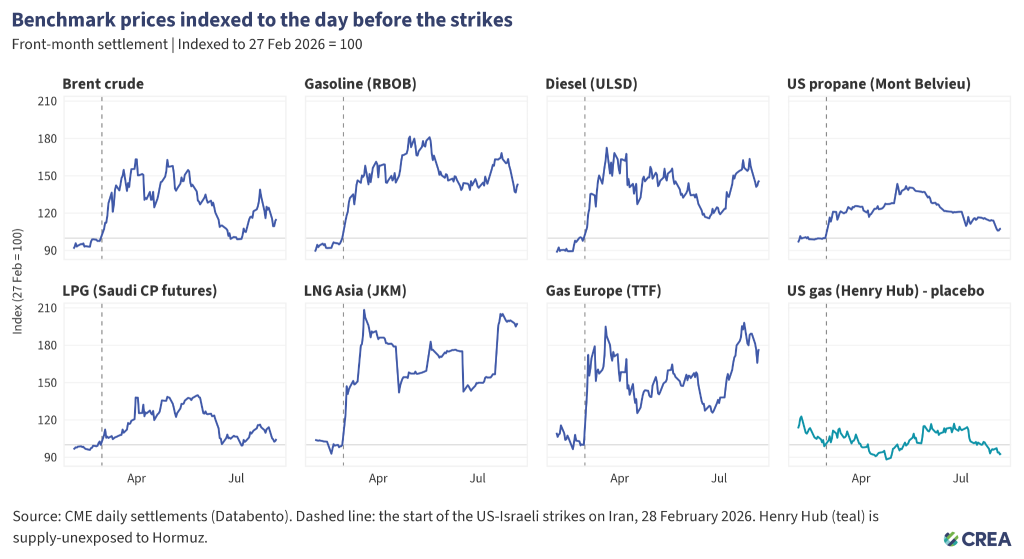
Figure 3 — Benchmark prices indexed to the day before the strikes
Note: The chart indexes each price to its 27 February level, not to the futures curve. Henry Hub price sits above that line in four of the six months because the pre-war curve had already priced a 19% seasonal rise from March to July. It delivered less than that, so it runs above its February level and yet below market expectations.
- On the first trading session after the strikes, 2 March 2026, seven of the eight benchmarks tracked rocketed upwards away from their pre-war futures curve.
- US natural gas, the one major benchmark Hormuz cannot reach, did not break away from its own curve. Measured against the futures curve for each delivery month, the price was 5% above pre-war expectations in March, the only month in which it exceeded expectations, and 22% below by the end of August.
How the price increases differed by region
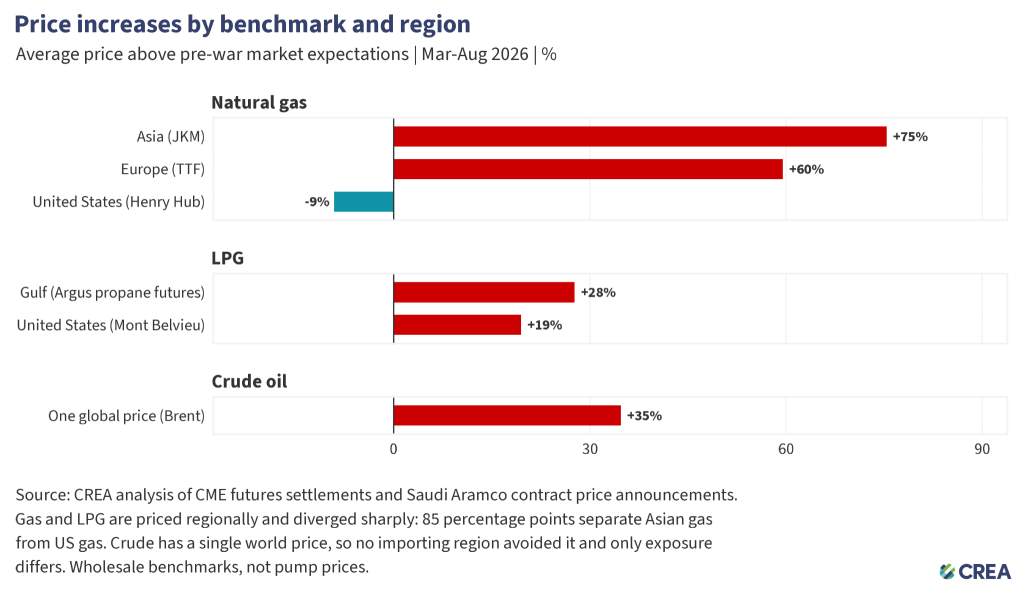
Figure 4 — Price increases by benchmark and region
- Gas and LPG are priced regionally, and their prices have diverged sharply. Asian LNG ran 75% above pre-war expectations between March and August 2026, European gas prices 60% above, and US gas 9% below. This represents an 85-percentage-point difference between Asian and US gas prices.
- Gulf LPG futures ran 28% above pre-war expectations between March and August, compared with 19% for the US benchmark. Measured on what India actually pays, blending the Saudi contract price for Gulf cargoes with Mont Belvieu for US ones, India’s premium is 29%.
- Brent ran 35% above expectations between March and August, and no importing region avoided that. What differed between regions was mainly exposure to price spikes, not price.
- All figures are wholesale benchmark prices, which are what importers pay for cargoes. What reaches a pump or a meter depends on each country’s taxes, subsidies and margins.
Commodity-by-commodity impact analysis
| Table 1 — Refined products’ prices increased more than crude they are made from | ||||
|---|---|---|---|---|
| Market | Gross extra cost, USD bn | Average price, Mar–Aug | Pre-war expectation | Premium |
| Crude oil | 164.1 | USD 93/bbl | USD 69/bbl | +35% |
| Diesel and gasoil | 73.8 | USD 161/bbl | USD 101/bbl | +59% |
| Gasoline | 35.7 | USD 133/bbl | USD 93/bbl | +43% |
| LNG, Atlantic basin | 21.5 | USD 16.99/MMBtu | USD 10.65/MMBtu | +60% |
| Jet fuel | 20.0 | — | — | +59% |
| LNG, Pacific basin | 16.5 | USD 18.62/MMBtu | USD 10.62/MMBtu | +75% |
| US gas, unexposed | not applicable | USD 2.91/MMBtu | USD 3.20/MMBtu | −9% |
| Note: Monthly average futures settlements. Gross means before netting off each country’s extra export earnings; the country and market figures later in the report are net. Premiums are the movement in each benchmark; costs apply those premiums to observed arrivals for March to July and modelled arrivals for August. August trade data is partial on both sides: five of its 21 trading days had settled when the analysis closed, 3 to 7 August, with the rest of the month held at the 7 August settlement. Two exceptions apply to the premiums. The Pacific LNG premium is charged only on 31% of imports bought on spot and short-term terms, based on the GIIGNL annual report for 2025, while Atlantic cargoes are hub-indexed and charged in full. Jet fuel has no separately traded curve in this dataset and is valued at the diesel premium converted at jet density. | ||||
- Diesel prices rose 59% above pre-war expectations, against crude’s 35%. An analysis of crude alone would have missed a large share of what importers actually paid for imported fuels.
- Diesel carries freight, farming and industry, and its premium has not eased: above 55% in five of the six months, and after dipping to 43% in June, it ended August higher than pre-war levels.
Crude prices have eased; diesel and gas have not
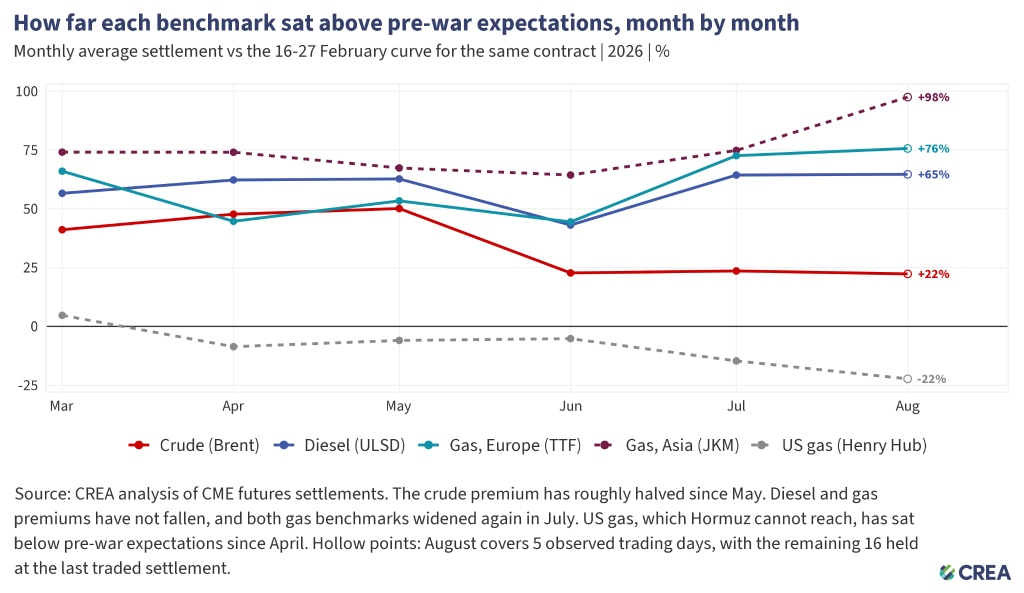
Figure 5 — How far each benchmark sat above pre-war expectations, month by month
- The crude premium has roughly halved, from 50% above expectations in May to 22% in August.
- Diesel sat 57% above expectations in March and 65% in August, so none of the easing in crude has reached it.
- European gas prices moved from 44% above pre-war expectations in June to 76% in August, and Asian LNG prices rose from 64% to 98%, so both benchmarks widened again after the June trough.
- US gas prices have sat below pre-war expectations since April and ended August 22% below.
Even when crude oil prices temporarily approached pre-war levels, prices for refined fuels used in transport remained elevated. Furthermore, gas prices rose more than those of any other fuel analysed, with the winter heating season still ahead.
Diesel: how elevated, and since when
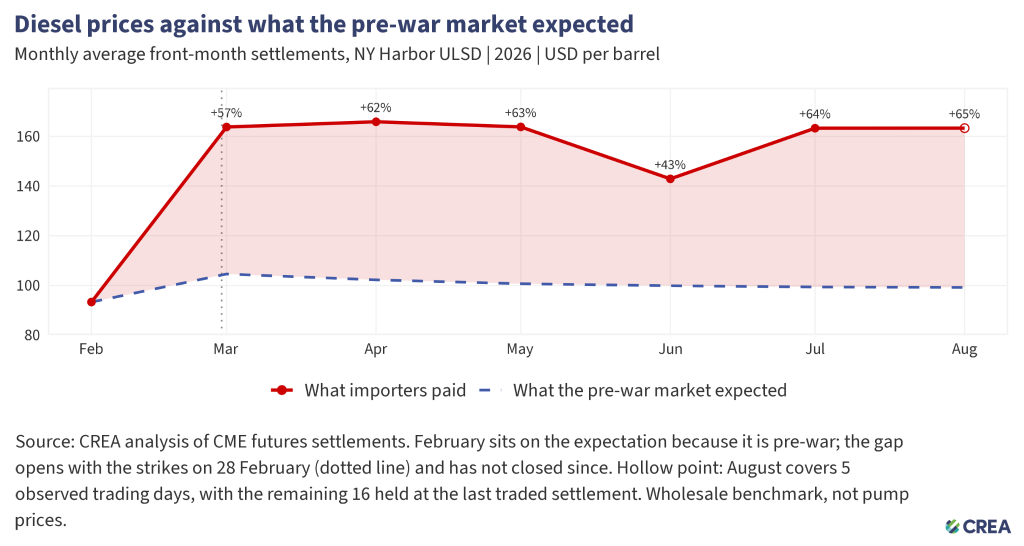
Figure 6 — Diesel prices against what the pre-war market expected
- The gap between diesel prices and what the pre-war market expected widened significantly following the US-Israeli strikes on Iran and has not closed since. February sits on the expectation line in this chart because it precedes the strikes on Iran; the pack’s counterfactual throughout the analysis is the 16-27 February futures curve.
- Diesel has averaged USD 161 per barrel over the past six months, against a pre-war expectation of USD 101.
- The premium has been above 55% in five of the six months, dipping to 43% in June before returning to 64% in July and 65% in August.
- This data represents wholesale benchmark diesel prices, not pump prices.
Who bore the cost?
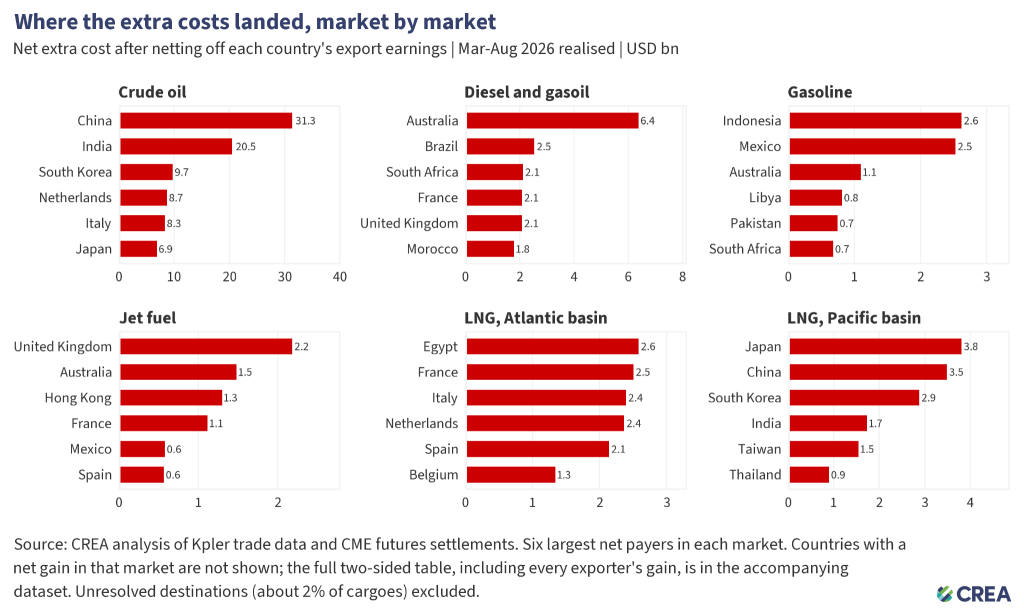
Where the extra costs landed, market by market
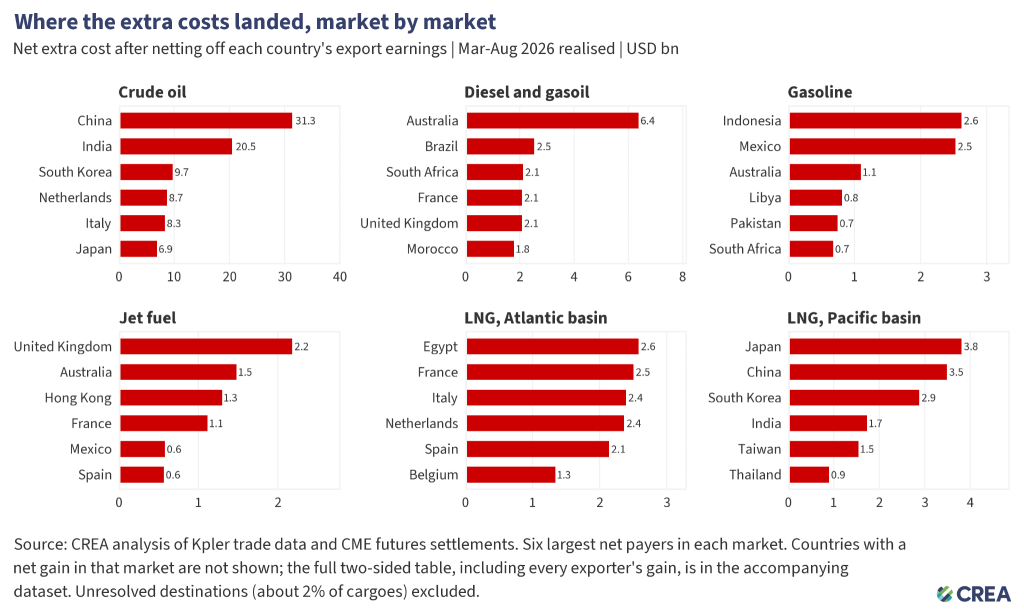
Figure 7 — Where the extra fossil fuel import cost landed
Note: Figures in this section are the net of each country’s extra export earnings, so the commodity totals here are lower than the gross figures included in the chart above.
- China paid USD 31.3 bn net for crude oil between March and August 2026, and India paid USD 20.5 bn, together 40% of the USD 131.2 bn crude total. South Korea, the next-largest, paid USD 9.7 bn for increased net crude oil imports due to the price spikes caused by the Hormuz crisis.
- Australia paid USD 6.4 bn net for diesel and gasoil over the six months, two and a half times as much as the next-largest country. Below Australia, the costs level off, with Brazil at USD 2.5 bn and South Africa, France, and the United Kingdom each estimated to face a net higher cost of USD 2.1 bn each for imported diesel and gasoil. Diesel is the most widely shared market in this analysis, with 134 countries reporting an increase in net import value and none accounting for more than 13% of the total.
- Gasoline costs are concentrated in two countries. Between March and August 2026, Indonesia and Mexico incurred net additional costs of USD 2.6 billion and USD 2.5 billion, respectively. Together, they accounted for one-quarter of the USD 20.4 billion total for gasoline. Australia ranked third, at USD 1.1 billion—less than half the amount incurred by either country.
- Jet fuel costs fall on the aviation hubs, with the United Kingdom paying USD 2.2 bn net, Australia USD 1.5 bn and Hong Kong USD 1.3 bn over the six months, accounting for a third of the USD 14.6 bn total.
- The two LNG basins behave in opposite ways. Atlantic LNG is evenly spread, with Egypt, France, Italy, the Netherlands and Spain each paying between USD 2.1 bn and USD 2.6 bn and none carrying more than 13% of the basin. Pacific LNG is more concentrated, with Japan, China, and South Korea together accounting for 64% of the USD 16.0 bn, because only 19 countries buy at that price.
Europe and East Asia absorbed most of the cost
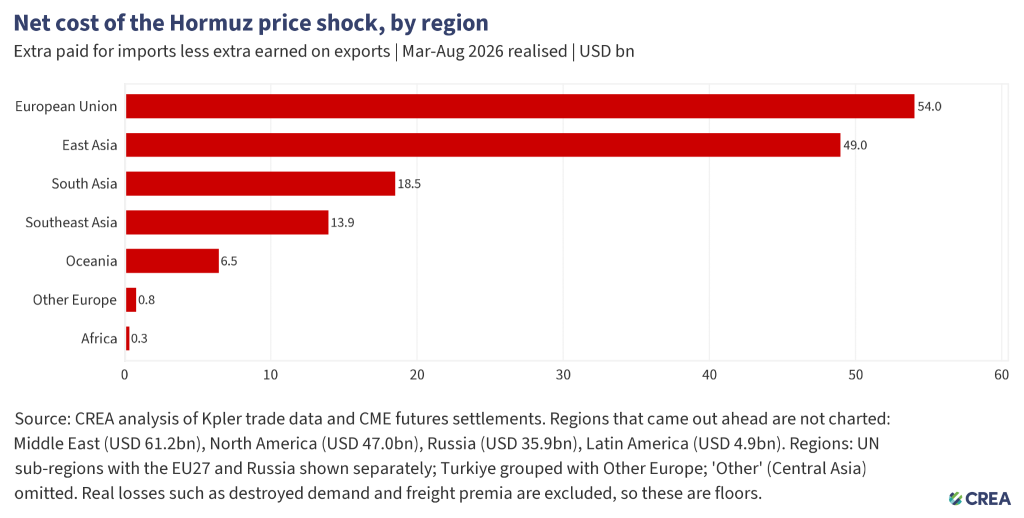
Figure 8 — Net cost of the Hormuz price shock, by region
- The European Union paid an additional USD 54.0 bn in net fossil fuel costs between March and August 2026, and East Asia USD 49.0 bn, together more than twice the combined net cost of every other paying region.
- The Middle East came out ahead by USD 61.2 bn over the same six months, North America by USD 47.0 bn, Russia by USD 35.9 bn and Latin America by USD 4.9 bn. Those four regions earned more from higher prices than their own importers paid. The Hormuz energy crisis provided Russia with a financial lifeline. Surging fossil fuel prices boosted its export revenues after earnings had fallen to an all-time low in January 2026, while US sanctions waivers encouraged countries to purchase Russian fuels without the threat of secondary sanctions.
- Other Europe comes out at a net import cost of USD 0.8 bn between March and August 2026, because Norway earned USD 7.9 bn while the United Kingdom and ten neighbours paid USD 8.7 bn in total. Latin America shows a net gain of USD 4.9 bn over the same period, although 36 of its 42 countries paid more.
- European costs here exclude pipeline gas due to data limitations. European pipeline buyers pay prices linked to the same hub benchmarks that rose, so the USD 54.0 bn is a conservative estimate of the increased cost to importers from higher fossil fuel prices.
Gross additional costs borne by fossil fuel importers
Turning from net positions to gross additional fossil fuel import costs, the EU faced the largest burden of any region, despite relying less on fossil fuel imports from Gulf states than regions such as Southeast Asia. The EU faced the highest gross additional cost, at USD 78 bn, followed by China at USD 35 bn and India at USD 22 bn.
A regional total says little about most of its members
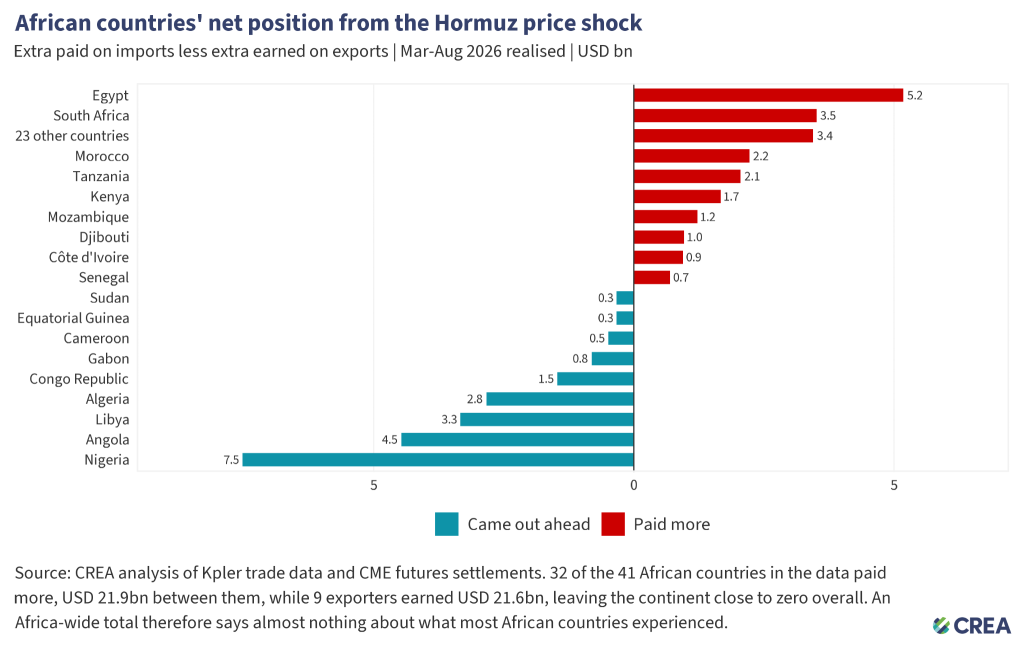
Figure 9 — African countries’ net position from the Hormuz price shock
- Thirty-two of the 41 African countries in the data paid higher costs for imported fossil fuels following the strikes on Iran between March and August 2026, totalling USD 21.9 bn, while nine exporters earned USD 21.6 bn, leaving the continent at a net of USD 0.3 bn.
- Nigeria earned USD 7.5 bn over the six months, more than Egypt paid at USD 5.2 bn, meanwhile, Egypt is the continent’s largest payer. Nigeria, Angola, Libya and Algeria together account for USD 18.1 bn of the USD 21.6 bn earned.
- Egypt paid USD 5.2 bn between March and August 2026, South Africa USD 3.5 bn and Morocco USD 2.2 bn. None of the individual countries’ increased import costs is visible in an Africa-wide net figure.
- Other Europe and Latin America show the same pattern, netting to USD 0.8 bn and to a USD 4.9 bn gain, respectively, although 11 of Other Europe’s 12 countries and 36 of Latin America’s 42 paid more.
The twenty largest payers and what it cost relative to their economies
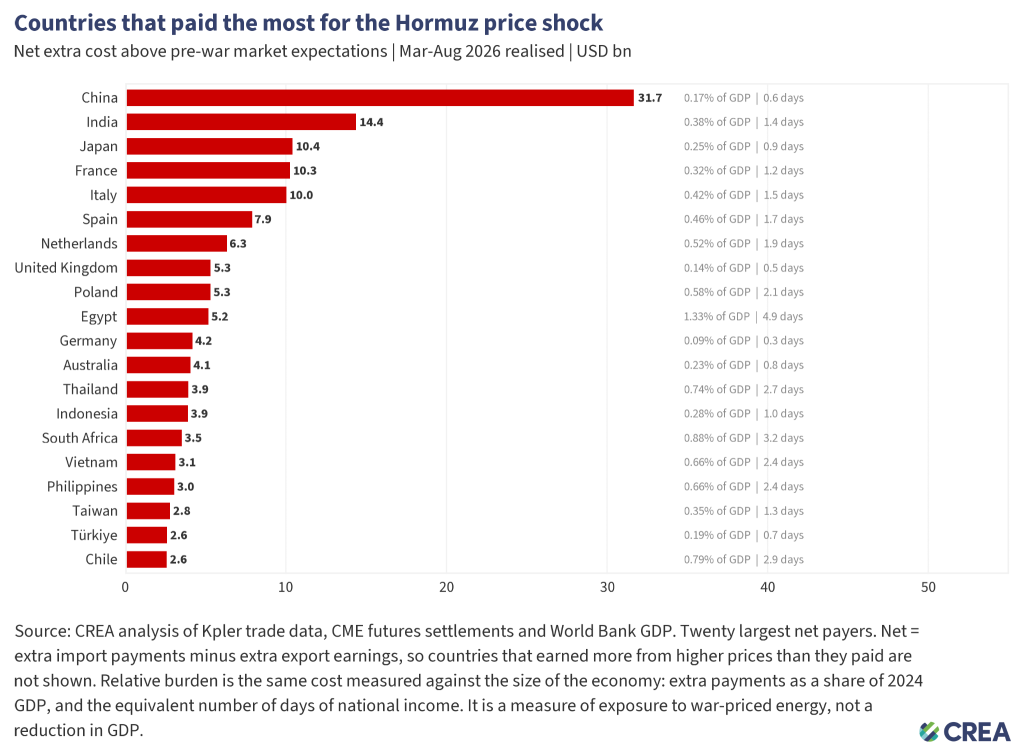
Figure 10 — Top 20 Countries that paid the most for the Hormuz price shock
- China faced the highest net cost across all fuels in absolute terms at USD 31.7 bn, but that is 0.17% of its GDP.
- Egypt paid USD 5.2 bn, which is 1.33% of its GDP, the equivalent of nearly five days of its national income. Within this list of twenty, the burden relative to the size of the economy varies fifteen-fold, from Egypt’s 1.33% to Germany’s 0.09%.
- South Africa, Chile, Thailand, Vietnam, and the Philippines all paid more than 0.65% of GDP, compared with 0.14% for the United Kingdom and 0.19% for Turkiye.
- The share of GDP measures exposure to rises in war-priced energy costs. It is not a reduction in GDP.
The burden fell hardest on the countries least able to absorb it
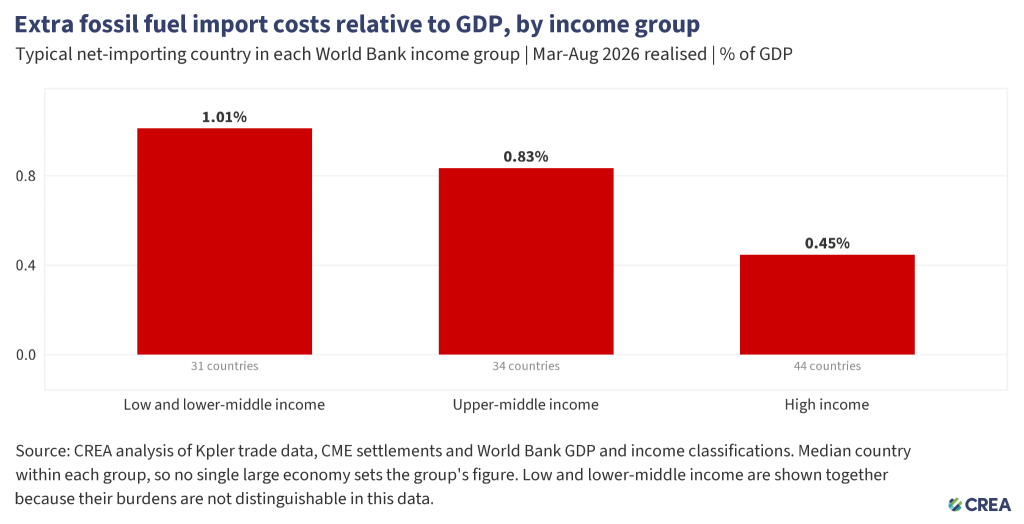
Figure 11 — Extra fossil fuel import costs relative to GDP, by income group
- The typical low- or lower-middle-income importer paid 1.0% of its GDP. The typical high-income importer paid 0.45%. Poorer countries carried roughly twice the relative burden.
- Counting exporters as well as importers, high-income countries as a group came out ahead, gaining the equivalent of 0.09% of their combined GDP, because the large exporters sit almost entirely within that group. Every other income group paid more than it earned.
- Whether measured by the typical country, weighted by population or weighted by GDP, the poorest group bears between 1.7 and 2.3 times the relative burden of the richest.
- Countries whose ports serve landlocked neighbours are excluded because their import bills are largely their neighbours’ costs.
Cooking gas: where the price shock reached households
Liquefied petroleum gas (LPG) is the fuel that reaches households most directly in South and Southeast Asia and much of Africa, where it is used for cooking and is disproportionately relied on by rural and lower-income families. India is the single largest LPG importer.
LPG is priced differently from all other fossil fuels in this analysis. Saudi Aramco announces a price for propane and butane at the start of each month, and term contracts for Gulf-supplied cargoes across Asia and Africa are indexed to that price, which makes it an administered rather than an exchange price. The US equivalent, Mont Belvieu, is a traded market benchmark; the price applicable to a buyer depends on the cargo’s origin.
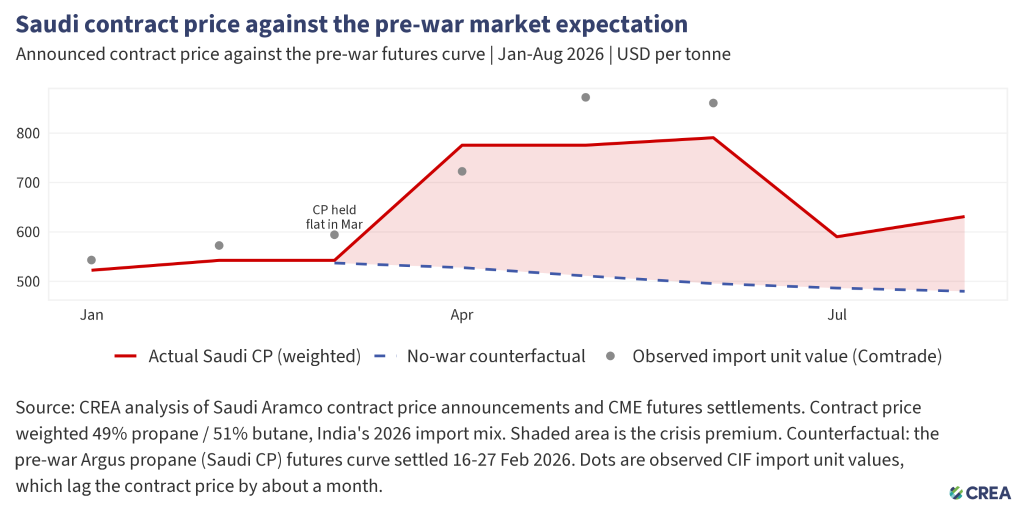
Figure 12 — Saudi contract price against the pre-war market expectation
- The Saudi contract price rose from USD 545 per tonne in February to USD 750 per tonne in April, an increase of 38%, peaking at USD 760 per tonne in June before easing to USD 580 per tonne in July.
- August’s contract price is estimated at USD 621 per tonne, based on the futures contract that settles against it. Checked against Aramco’s announcements from February to July, the futures settlement matched the announced price exactly in the three months when the contract was still trading on the announcement date, and came within 1.4% in the three where it expired two or three days earlier.
- Butane, which accounts for just over half of what India buys, rose more than propane. Saudi Aramco’s April pricing announcement raised its official selling price for propane by 38% to USD 750 per tonne and for butane by 48% to USD 800 per tonne.
In the six months following the US-Israel strikes on Iran, India paid 29% more per tonne for cooking gas than the market expected, and imported 26% less of it
- India’s imported LPG bill over the six months came to about USD 4.7 bn, of which roughly a fifth was the extra cost caused by the price shock. That extra cost was paid on volumes that collapsed in March to half the average volumes of the previous two years (2024 and 2025) and had recovered to 86% of that level by June.
- In March to June, the four months for which India has reported trade data, its LPG bill ran USD 788 mn above the pre-war market expectation.
- Each cargo is priced based on its origin: Gulf-supplied volumes are priced against the Saudi contract price, and US-supplied volumes against Mont Belvieu pricing, which matters because the mix shifted sharply during the crisis.
- Across the full six months, India’s extra LPG import cost is estimated at USD 1.1 bn. The figure counts only gas that was bought, so the cooking gas households gave up because it became unaffordable is not included in this cost estimation.
Measured per cylinder, the gas in a standard 14.2kg Indian domestic cylinder cost roughly USD 8.1 at import parity from March to August 2026, compared with USD 6.28 in the pre-war expectation. That is a cost increase of about USD 1.8 per refill, or 29%, peaking at USD 2.9 in May. These are import-parity figures, before any subsidies, distribution margins, or taxes, so they are not what a household paid for LPG at the shop.
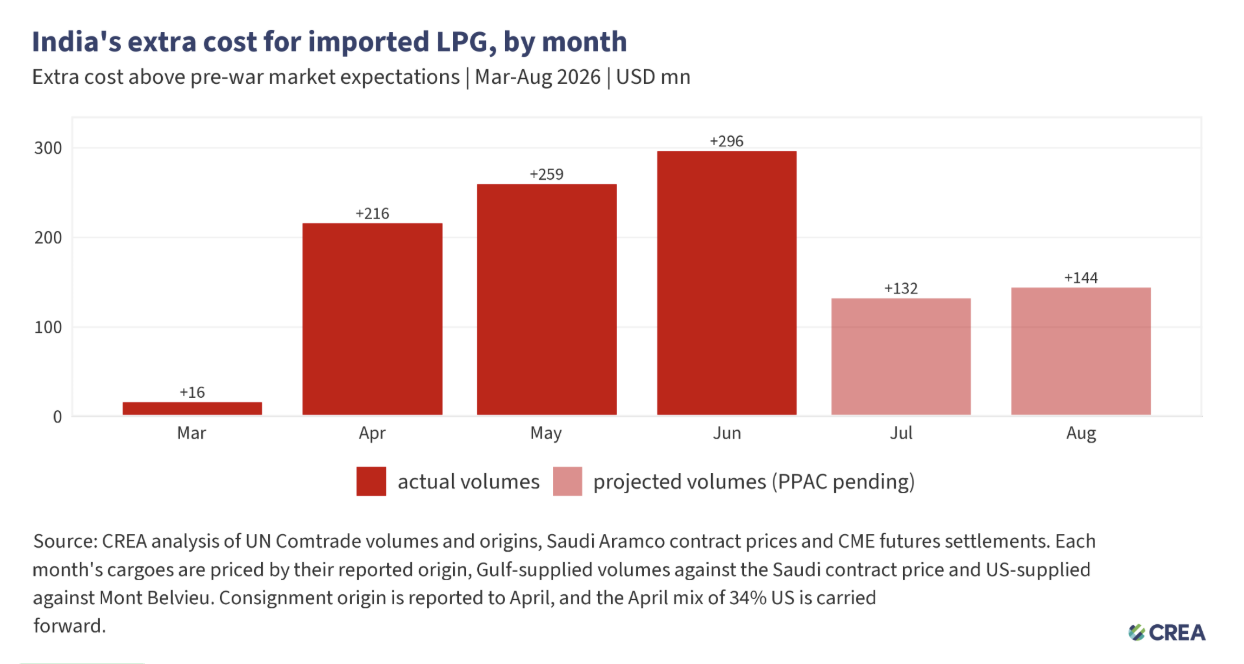
Figure 13 — India’s extra cost for imported LPG compared to pre-war expectations, by month
Note: The chart shows the lower end of the estimation range, assuming that imports remain unchanged in July and August, held at June’s level rather than continuing to recover. It totals USD 1.064 bn, of which USD 788 mn rests on reported volumes.
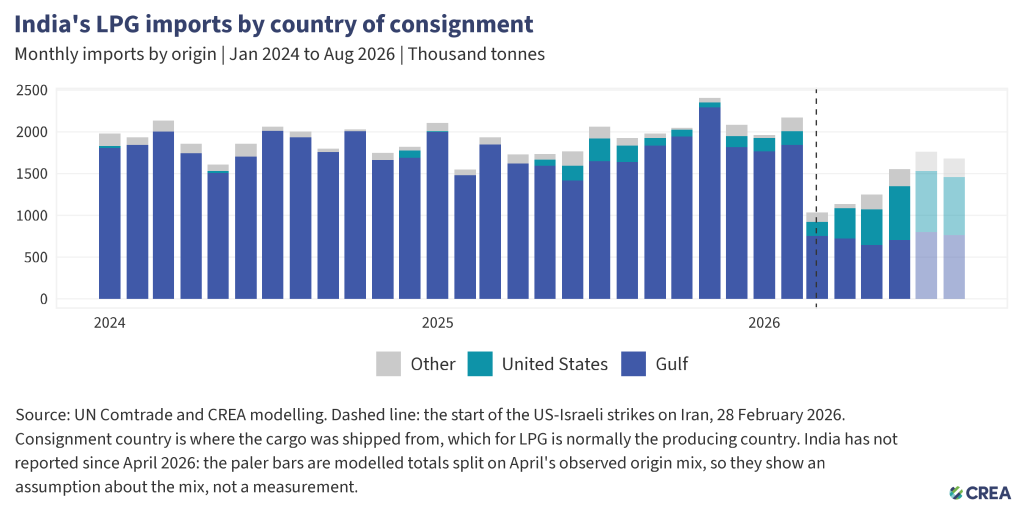
Figure 14 — Where India’s LPG imports came from
India’s LPG imports fell 49% in March, the first full month of the US-Iran war, compared with the average of the previous two years.
The US share of India’s LPG imports rose from 8% in February to 16% in March and to 32% in April, replacing some, but not all, of the lost Gulf volume.
Readily available monthly trade data covers only a minority of importing countries and excludes the largest, China, so any global LPG figure would be based on a biased sample. India is reported instead because it reports both volumes and cargo origins.
Methodology
CREA compared what importing countries actually paid for seaborne fossil fuels against the prices futures markets expected before the war.
Several realised cost components are excluded from the analysis, resulting in conservative estimates. These include pipeline gas, coal, fuel oil and naphtha costs; freight rates; and any other components of consumer prices added on top of the wholesale price.
Pricing
The counterfactual is the futures curve settled between 16 and 27 February 2026, the 12-day period before the strikes, which already embeds the seasonality and the 2026 oversupply the market was pricing at the time. Realised prices are based on daily exchange settlement prices for the same contracts. Accordingly, each comparison is made on a like-for-like basis using the same instrument, so no price is estimated in the core calculation. Three exceptions are set out where they arise: jet fuel, which has no separately traded curve and is valued at the diesel premium converted at jet density; LPG, where the Saudi contract price is administered, and its counterfactual comes from the futures contract that settles against it; and August, where the unsettled part of the month is held at the last settlement.
The difference between pre-war expectations and realised prices is naturally affected by all other developments since 28 February, not only the conflict. There are, however, multiple reasons why attributing the difference to the conflict is justified and conservative. Prices gapped up at the first settlement after the strikes, on Monday, 2 March. Most of the crude and gas repricing occurred within the first fortnight; diesel and gasoline continued to climb after that. The oil benchmarks were also drifting up in the fortnight before the strikes, so the move measured from 27 February does not capture the full impact.
We quantify the cost only as the additional price paid on fuel that each country actually bought. Where countries have cut back on imports, particularly as a result of demand destruction, this entails an additional economic cost that we do not quantify.
LNG pricing is differentiated by destination region, with European price benchmarks used west of the Suez and Asian benchmarks to the east. The Asian spot market price applies only to the share of imports bought on spot and short-term terms, estimated at 31%. This assumption limits the estimated costs of LNG price increases in Asia.
Jet fuel is valued using diesel forward prices, as our futures data did not cover jet fuel.
For August, we use actual daily prices for historical trading days available at the time of the analysis, with remaining days set to the last traded price.
For LPG, the Saudi contract price is administered rather than traded, so it has no futures curve of its own. The counterfactual is built from the Argus Propane (Saudi Aramco) futures contract, whose final settlements converge on the announced price, averaged over the same 16 to 27 February window used for every other benchmark. That pre-war curve was declining, from about USD 537 per tonne in March to USD 480 in August, so the premium is measured against a market that expected prices to fall. Butane follows the propane shape, because the butane contract trades too thinly to build a curve from, and the two sat about USD 5 per tonne apart before the war.
All future price data is obtained from Databento.
Volumes
Volumes are observed seaborne arrivals from Kpler, valued once at each destination’s own benchmark, which is why importer costs and exporter gains balance exactly. LPG is not carried in that feed, so India’s volumes and cargo origins come from UN Comtrade, cross-checked against India’s own customs statistics, which agree to the kilogram in every reported month. LPG prices are based on Saudi Aramco’s announced contract price for Gulf-supplied cargoes and Mont Belvieu for US-supplied cargoes, blended each month according to the observed origin mix. LPG sits outside the USD 330 bn headline and is reported separately.
Around USD 6 bn of cost could not be attributed to specific countries due to gaps in ship-tracking data. This cost is included in global totals but not in country-by-country figures.
August volumes are projected based on the July volume for each trade route, adjusted by that commodity’s July-to-August seasonal change, averaged over 2024 and 2025.
India LPG volumes for July and August are projected because India has reported trade data only up to June. Each month is set at the average of that same calendar month in 2024 and 2025, then scaled by the shortfall observed in June, the last reported month, when imports ran about 15% below that benchmark. Those two months are roughly a quarter of the India LPG figure, which is why it is given as a range rather than a single number: the low end holds the shortfall at June’s level; the high end assumes imports return to the pre-crisis norm. The origin mix for both months carries June’s.
Fossil fuel imports avoided due to clean energy expansion
We estimate how much additional fossil fuel and additional fossil-fuel imports the power sector of each country would have consumed between March and July 2026 if its non-fossil generation had remained at 2020 levels. The growth in clean generation since 2020 is treated as having displaced fossil-fired generation, and the counterfactual simply reverses that displacement: the additional clean output is assumed to have been met by fossil plants instead.
For each country, we compare non-fossil generation in March–July 2026 with the same months of 2020, by technology. Monthly generation data come from Ember, using each country’s actual monthly figures where available and projecting missing recent months based on year-on-year trends. For India, we use national daily generation data from POSOCO. For countries without monthly data, we scale the change in Ember’s annual data to the five-month period.
Because year-to-year swings in hydro and nuclear output often reflect weather and outages rather than structural change, we exclude changes in a country’s hydro or nuclear generation unless there were significant capacity additions or between 2020 and 2026, as identified from Global Energy Monitor’s plant-level trackers.
This avoided fossil generation is divided between coal, gas, and oil according to each country’s average fossil-power fuel mix over the period, and avoided imports based on import dependency for each fuel, calculated from the Energy Institute’s Statistical Review of World Energy dataset.
Annex
| Table A.1 — Net gains and costs by region | |||
|---|---|---|---|
| Region | Extra import cost | Extra export earnings | Net position |
| European Union | 77.8 | 23.8 | −54.0 |
| East Asia | 67.5 | 18.6 | −49.0 |
| South Asia | 26.6 | 8.1 | −18.5 |
| Southeast Asia | 33.0 | 19.0 | −13.9 |
| Oceania | 12.0 | 5.6 | −6.5 |
| Other Europe | 18.2 | 17.4 | −0.8 |
| Africa | 33.7 | 33.3 | −0.3 |
| Latin America | 29.4 | 34.3 | +4.9 |
| Russia | 0.0 | 35.9 | +35.9 |
| North America | 20.1 | 67.0 | +47.0 |
| Middle East | 7.3 | 68.5 | +61.2 |
| USD bn, March to August 2026. Negative is a net cost. | |||
| Note. The export column sums to the USD 331.5 bn headline because every cargo’s origin is identified. The import column sums to USD 325.5 bn, because about USD 6 bn of cargo discharges at destinations the ship-tracking cannot resolve: it is held in the global total but belongs to no region. That is also why the net column sums to −6.0 rather than to zero.Regional nets do not add to a global net either. A region containing both payers and exporters nets them against one another, so the seven regions that ended with a net cost come to USD 143.0 bn between them, rather than the USD 198.9 bn that moved from importing to exporting countries. | |||
| Table A.2 — Top 20 countries that paid the most for the Hormuz price shock | |||
|---|---|---|---|
| Country | Net cost, USD bn | Share of GDP | Days of national income |
| China | 31.7 | 0.17% | 0.6 |
| India | 14.4 | 0.38% | 1.4 |
| Japan | 10.4 | 0.25% | 0.9 |
| France | 10.3 | 0.32% | 1.2 |
| Italy | 10.0 | 0.42% | 1.5 |
| Spain | 7.9 | 0.46% | 1.7 |
| Netherlands | 6.3 | 0.52% | 1.9 |
| United Kingdom | 5.3 | 0.14% | 0.5 |
| Poland | 5.3 | 0.58% | 2.1 |
| Egypt | 5.2 | 1.33% | 4.9 |
| Germany | 4.2 | 0.09% | 0.3 |
| Australia | 4.1 | 0.23% | 0.8 |
| Thailand | 3.9 | 0.74% | 2.7 |
| Indonesia | 3.9 | 0.28% | 1.0 |
| South Africa | 3.5 | 0.88% | 3.2 |
| Vietnam | 3.1 | 0.66% | 2.4 |
| Philippines | 3.0 | 0.66% | 2.4 |
| Taiwan | 2.8 | 0.35% | 1.3 |
| Turkiye | 2.6 | 0.19% | 0.7 |
| Chile | 2.6 | 0.79% | 2.9 |