By Vaibhav Raghunandan, Petras Katinas, and Luke Wickenden
Russian total fossil fuel export earnings drop to all time low, yet France’s imports of Russian LNG rise 57% month-on-month.
Key findings
- In January 2026, Russia’s monthly fossil fuel export revenues saw a marginal 3% month-on-month decline to EUR 464 mn per day — the lowest figures since the full-scale invasion of Ukraine.
- In January, France’s LNG imports from Russia saw a massive 57% month-on-month increase, while its total import volumes saw a much more modest 15% increase.
- China’s total seaborne imports of Urals grade crude — previously disfavoured by Chinese refiners — doubled in volumes in January 2026 — to their highest monthly import volumes ever.
- One fifth of the volume of Russian oil (21%) transported by tankers flying false flags (770 thousand tonnes, valued at EUR 268 mn) transited the Danish Straits — carried by just nine vessels in January.
- India’s Russian crude imports recorded a 12% reduction in January despite a 4% rise in total imports. This drop in Russian crude volumes was led by a complete pause in imports by the Jamnagar refinery.
- Entity-based sanctions and price caps have been easily circumvented through special purpose vehicles (SPVs) and ‘shadow’ fleet growth. Considering this, CREA now proposes a full maritime services ban that targets the physical infrastructure of exports, closing these loopholes and imposing uniform, volume-based constraints on Russian oil revenues.
Trends in total export revenue
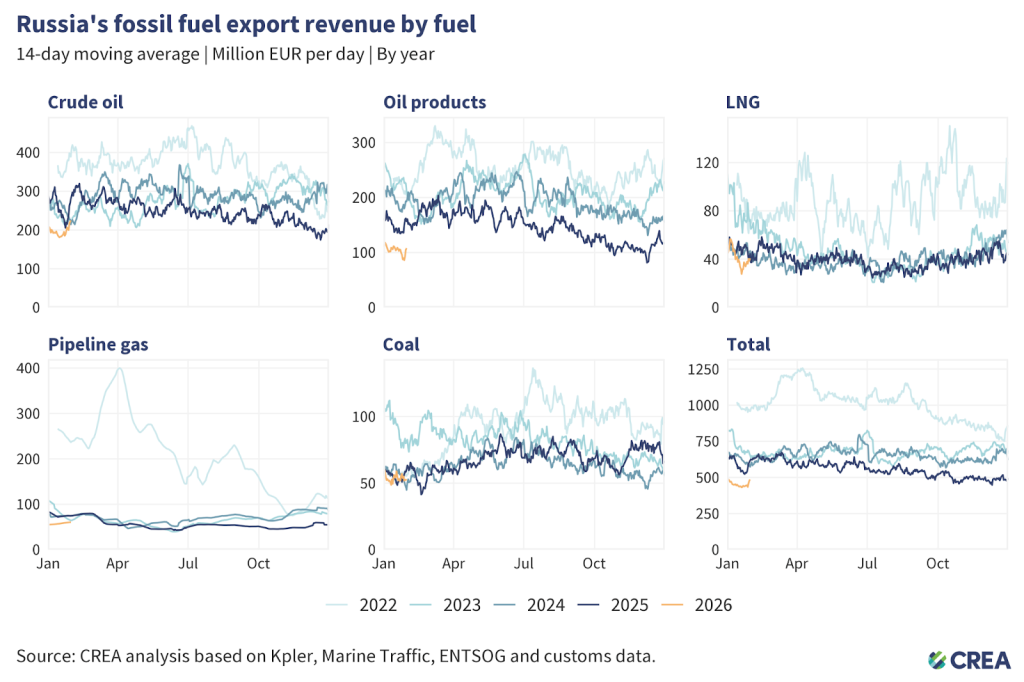
- In January 2026, Russia’s monthly fossil fuel export revenues saw a marginal 3% month-on-month decline to EUR 464 mn per day. Conversely, volumes saw a bigger 6% month-on-month drop in January.
- There was an 8% month-on-month increase in crude oil export revenues to EUR 205 mn per day. This was largely led by a significant 12% increase in revenues from seaborne crude, which totalled EUR 156 mn per day. The revenue growth from seaborne crude mirrored a similar 10% increase in export volumes.
- Pipeline crude export revenues saw a 3% month-on-month decrease to EUR 49 mn per day.
- Liquefied natural gas (LNG) revenues decreased by 18% to EUR 39 mn per day, aligning with a similar 15% decrease in exported volumes.
- Pipeline gas revenues rose by 3% to EUR 59 mn per day.
- Revenues from exports of seaborne oil products saw a 6% month-on-month decrease, earning Russia EUR 107 mn per day.
- Coal export revenues reduced by 23% month-on-month to EUR 54 mn per day.
Who is buying Russia’s fossil fuels?
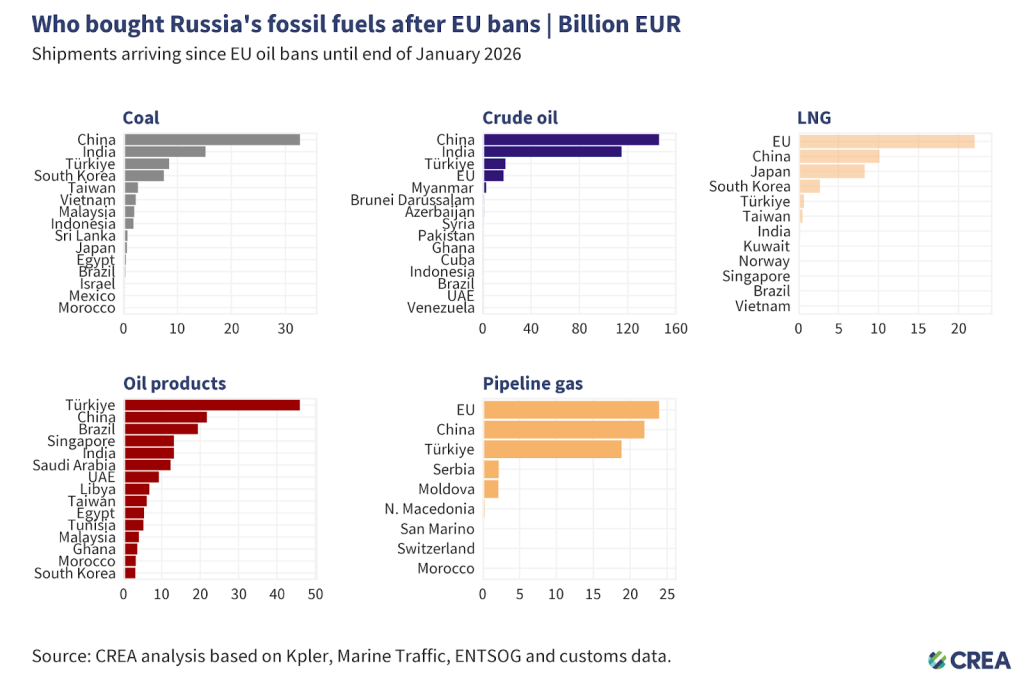
- Russia’s fossil fuel exports remain highly concentrated, with China dominating purchases of coal and crude oil, Turkiye dominating purchases of oil products, and the EU remaining the largest buyer of LNG and pipeline gas — showing Moscow’s dependence on a narrow set of key customers.
- Coal: From 5 December 2022 until the end of January 2026, China purchased 43% of all Russian coal exports. India (20%), Turkiye (11%), South Korea (10%), and Taiwan (4%) round out the top five buyers’ list.
- Crude oil: China has bought 48% of Russia’s crude exports, followed by India (38%), Turkiye (6%), and the EU (6%).
- Oil products: Turkiye, the largest buyer, has purchased 27% of Russia’s oil product exports, followed by China (13%), Brazil (11%), and Singapore (8%).
- LNG: The EU remains the largest buyer of Russian LNG, accounting for almost half (49%) of Russia’s total LNG exports, followed by China (23%) and Japan (18%).
- Pipeline gas: The EU is the largest buyer, purchasing 35% of Russia’s pipeline gas exports, followed by China (31%) and Turkiye (27%).
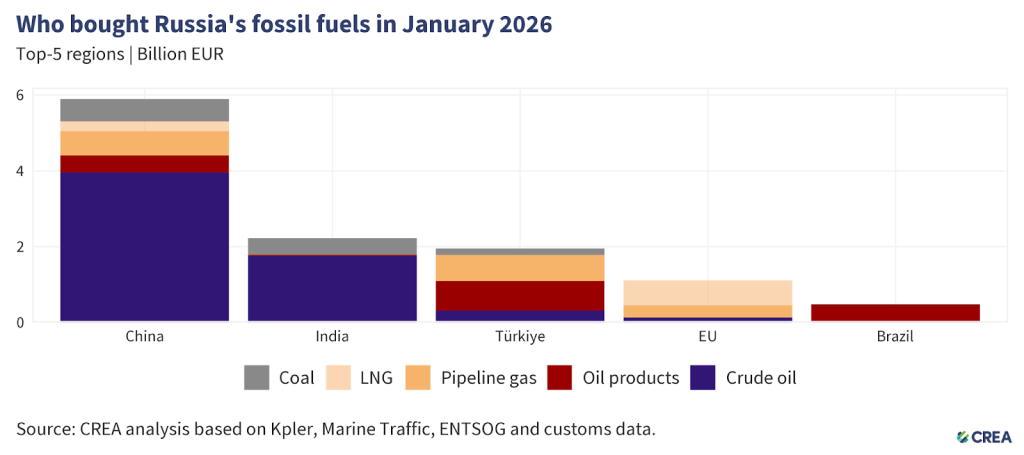
- In January 2026, China remained the largest global buyer of Russian fossil fuels, accounting for 50% (EUR 6 bn) of Russia’s export revenues from the top five importers. Crude oil made up 67% (EUR 4 bn) of China’s purchases, followed by pipeline gas (EUR 646.7 mn) and coal (EUR 593 mn). Refined oil products (EUR 451 mn) and LNG (EUR 258 mn) constituted the remainder of their imports.
- While China’s total seaborne crude imports saw a 10% month-on-month decrease in January, imports from Russia saw an 18% rise, constituting 16% of their total imports.
- While China’s seaborne imports of Russia’s Eastern Siberia–Pacific Ocean (ESPO) grade crude oil remained stable, imports of Urals grade crude — previously disfavoured by Chinese refiners — doubled in volumes in January 2026. Their imports of Urals grade crude were the highest volumes imported, ever.
- India was the second largest importer, purchasing EUR 2.2 bn of Russian hydrocarbons in January. Crude oil constituted the largest share at 78% (EUR 2 bn), followed by coal (EUR 442 mn). Oil products (EUR 30 mn) constituted the remainder of their imports from Russia.
- While India’s Russian crude imports recorded a 12% reduction in January, total imports saw a 4% rise. India compensated the drop in Russian volumes with imports from Iraq, which saw a 14% month-on-month rise.
- The biggest drop has been in imports to the Jamnagar refinery. In January, the refinery did not receive any seaborne Russian oil at all. The reasons for this cut-off may have to do with OFAC sanctions on Rosneft, which was the chief supplier to the refinery. As of publication (18 February 2026), there are three shipments from Russia reported as destined for Jamnagar.
- While President Trump announced a new bilateral trade deal and heralded India’s decision to stop buying Russian crude, there has been no such clear declaration by Indian government officials. Indian officials have chosen not to react to President Trump’s statement, or even corroborate it, choosing instead to highlight their own statements on the details of the trade deal.
- Turkiye was the third highest buyer of Russian fossil fuels in January 2026, importing a total of EUR 2 bn of Russian hydrocarbons. Oil products constituted 40% of Turkiye’s purchases, totalling EUR 779 mn. Pipeline gas imports accounted for 35% (EUR 684 mn), while coal (EUR 175 mn) and crude oil (EUR 318 mn) constituted the remainder of their monthly imports.
- Turkiye’s imports of Russian crude increased by 8% in January, even as there was a 10% decrease in total imports.
- The SOCAR-owned STAR refinery’s Russian crude imports dropped by a sharp 38% month-on-month, with total imports down by 14%. In contrast, the Tupras Izmit refinery’s Russian imports rose by 76% month-on-month, and after a month-long pause, the Tupras Aliaga refinery also received three shipments of Russian crude in January.
- Turkiye’s imports of Russian oil products saw a 25% month-on-month reduction in January. Forty-four per cent of these volumes were delivered to the port of Mersin, with three-quarters delivered to the OPET Mersin and Turkis Enerji terminals. The latter’s imports from Russia saw an 83% month-on-month rise in January.
- The EU was the fourth-largest buyer of Russian fossil fuels, accounting for 10% (EUR 1.1 bn) of Russia’s export revenues from the top five importers. 59% of these imports (EUR 657 mn) consisted of LNG. Pipeline gas (EUR 319 mn), and crude oil (EUR 137 mn) constituted the remainder of their imports.
- Brazil was the fifth-largest importer in January, with purchases totalling EUR 489 mn. The vast majority of these imports were oil products (EUR 477 mn), with coal comprising the remainder.
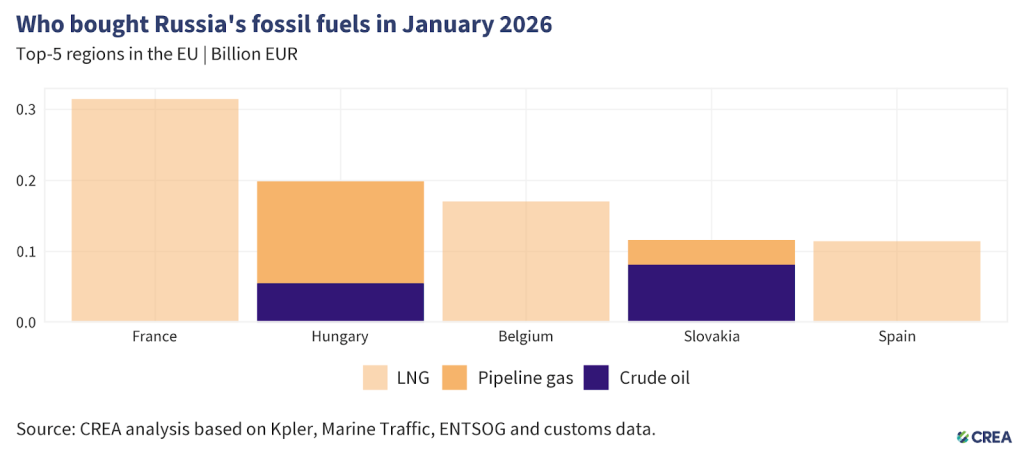
- In January 2026, the five largest EU importers of Russian fossil fuels paid Russia a combined EUR 915 mn. Natural gas — unsanctioned by the EU — accounted for 85% of these imports, delivered mainly by pipeline or as liquefied natural gas (LNG). The remainder constituted crude oil, which continues to reach Hungary and Slovakia via the southern branch of the Druzhba pipeline under an EU exemption.
- France was the largest buyer, importing EUR 315 mn of Russian fossil fuels, all in the form of LNG. France’s LNG imports from Russia saw a massive 57% month-on-month increase, while total monthly import volumes saw a much more modest 15% increase.
- Hungary was the EU’s second-largest importer, purchasing EUR 199 mn worth of Russian fossil fuels. This included 144 mn of pipeline gas and EUR 55 mn of crude oil.
- Belgium was the third-biggest importer, importing EUR 171 mn of Russian LNG in January. Belgium’s imports of Russian LNG decreased by 14% month-on-month, while total imports registered a 5% decrease.
- Slovakia* was the fourth-highest importer, with imports totalling EUR 116 mn. Crude oil delivered via the Druzhba pipeline accounted for 70% of the total (EUR 82 mn), while pipeline gas accounted for EUR 34 mn.
- Spain, the fifth-highest importer, purchased EUR 114 mn of Russian LNG in January.
*Note: CREA’s initial December 2025 monthly analysis stated that, ‘Slovakia was the fifth-highest importer, with imports totalling EUR 451 mn. Crude oil delivered via the Druzhba pipeline accounted for 37% of the total (EUR 130 mn), while pipeline gas accounted for EUR 285 mn’. These findings were incorrect and the result of human error. The correct figures are: EUR 194 mn; 85%; EUR 166 mn; and EUR 28 mn, respectively. They have been updated in the December 2025 monthly analysis. We apologise for the inconvenience.
- The EU’s ban on imports of oil products made from Russian crude came into effect on 21 January 2026. The EU’s ban, in combination with OFAC sanctions on Rosneft and Lukoil, saw Indian refineries that export to the EU completely cut off their Russian feedstock.
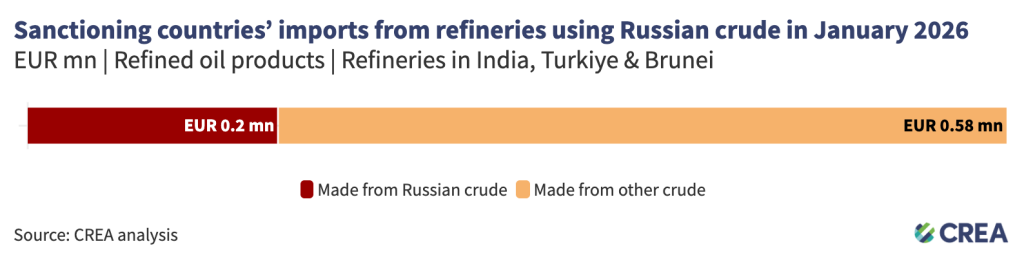
- Five refineries in India, Turkiye, and Brunei that use Russian crude exported EUR 781 mn of oil products to sanctioning countries in January 2026. The importers included the EU (EUR 309 mn), USA (EUR 118 mn), UK (EUR 24 mn), and Australia (EUR 330 mn). An estimated EUR 200 mn of these products were refined from Russian crude.
- There was an 11% month-on-month reduction in these refineries’ exports to sanctioning countries. The decrease was led chiefly by the EU and UK, who recorded monthly reductions of 20% and 30%, respectively.
- In contrast to those two, exports to Australia (EUR 330 mn) increased by 3% in January. The biggest exporter to Australia was the Hengyi refinery in Brunei (EUR 138 mn). Over one third of the refinery’s feedstock in January was Russian crude.
- The USA’s imports totalled EUR 118 mn and originated mainly in the Jamnagar refinery and the Tupras-owned refineries in Turkiye — both of which continue to use Russian crude.
How are oil prices changing?
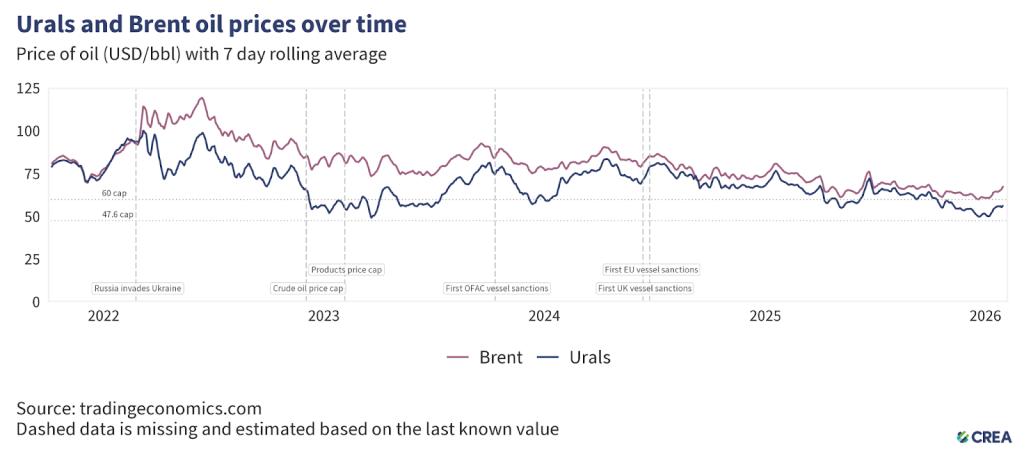
- In January 2026, the average price of Russia’s Urals crude rose by 4% to USD 54.2 per barrel, remaining above the new EU and UK price cap of USD 44.1 per barrel, which took effect on 1 February.
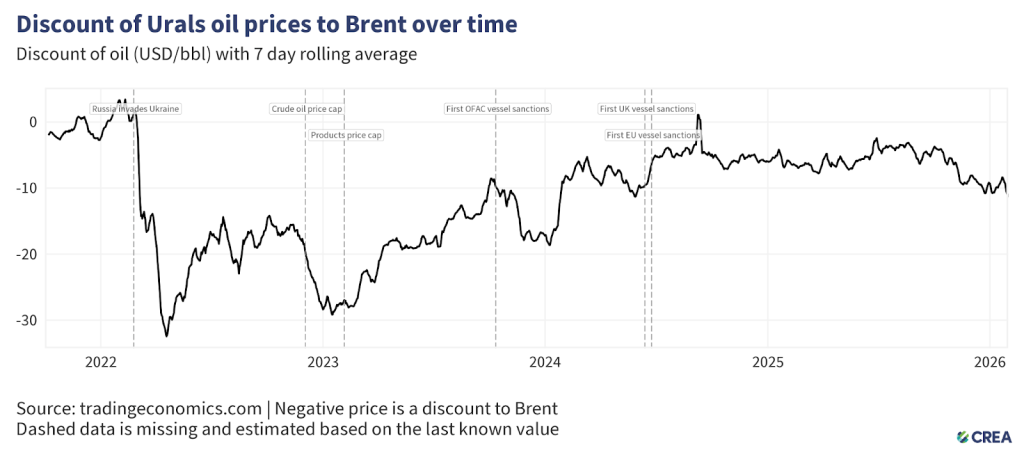
- In January, the discount on Urals crude increased by 5% month-on-month, averaging USD 9.85 per barrel below Brent.
Sanctioned tankers carry the majority of Russian crude despite Western sanctions
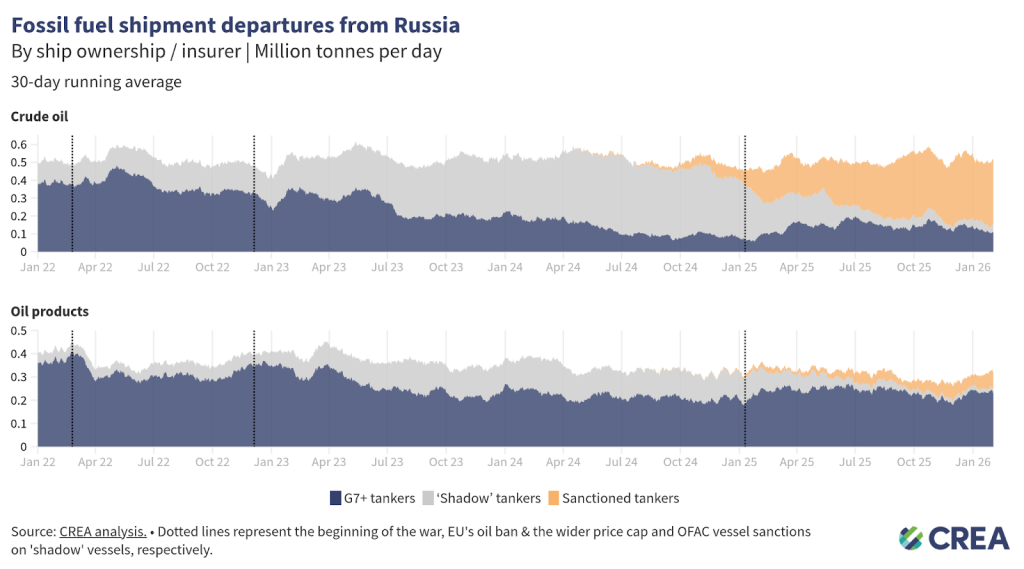
- In January 2026, Russian oil exports by sea increased by 19%, with the largest share, 49%, transported by ‘shadow’ tankers under sanctions. Around 44% of the volume was transported by G7+ tankers.
- G7+ tankers transported 24% of Russian crude oil exports in January, while non-sanctioned ‘shadow’ tankers accounted for 8% of the total. The largest share, 68%, was carried by sanctioned ‘shadow’ tankers.
- For oil products, Russia’s dependence on G7+ tankers is higher, and they transported 76% of Russian oil products in January. Sanctioned ‘shadow’ tankers carried 19% of total Russian oil product volumes, while non-sanctioned ‘shadow’ tankers accounted for 5% of the volume.
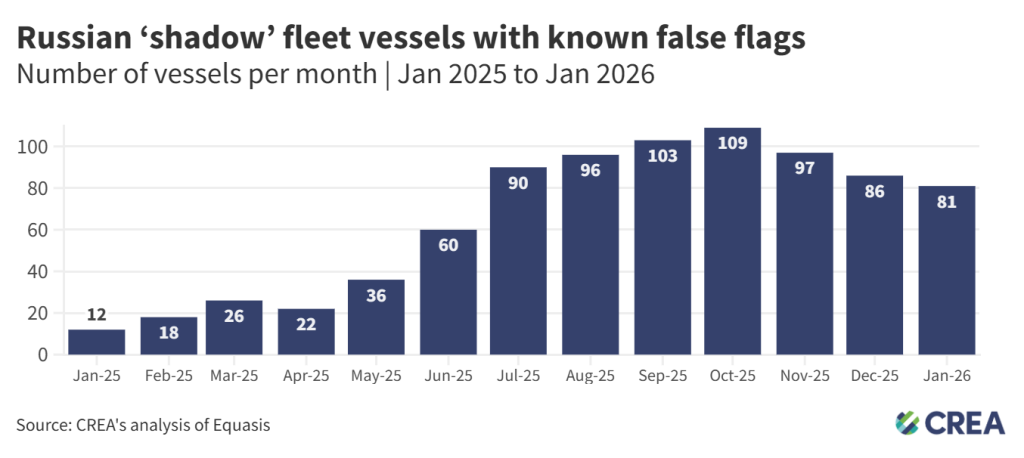
- In January 2026, 81 ‘shadow’ vessels were operating under false flags at the end of the month. Thirty-five vessels delivered EUR 1.3 bn of Russian crude oil and oil products while flying a false flag.
- One fifth of the volume of Russian oil (21%) transported by tankers flying false flags (770 thousand tonnes, valued at EUR 268 mn) transited the Danish Straits in January — carried by just nine vessels.
‘Shadow’ tankers pose significant risks to ecology and impact of sanctions
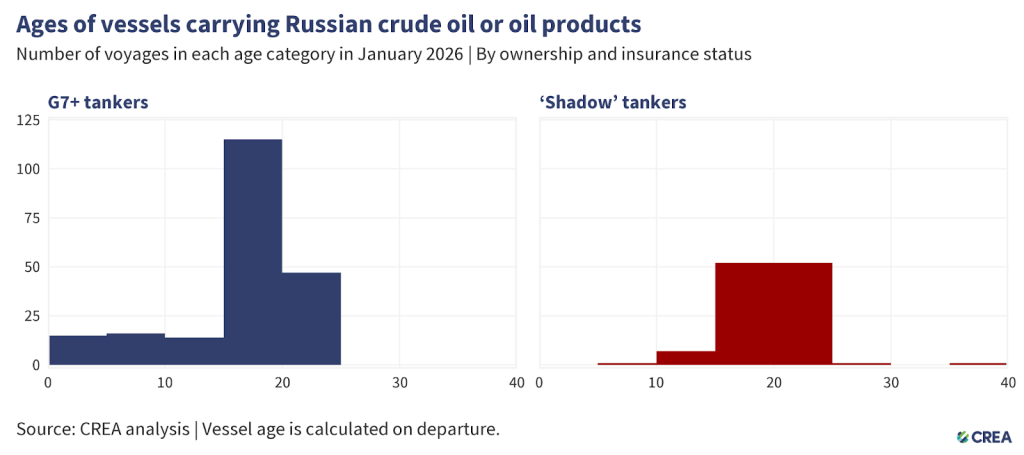
- In January 2026, 321 vessels exported Russian crude oil and oil products. Among them, 207 were G7+ tankers, and the remaining 114 were ‘shadow’ tankers. Additionally, 54 of these ‘shadow’ tankers were at least 20 years old or older.
- The oldest vessel transporting Russian oil in January was constructed 38 years ago.
- Older ‘shadow’ tankers transporting Russian oil through EU waters pose environmental and financial risks due to their age, poor maintenance, and inadequate protection and indemnity (P&I) insurance. In the event of an oil spill or accident, coastal states may face significant cleanup costs and damage to their marine ecosystems.
- The cost of cleanup and compensation from an oil spill by tankers with dubious insurance could amount to over EUR 1 bn for taxpayers in coastal countries.
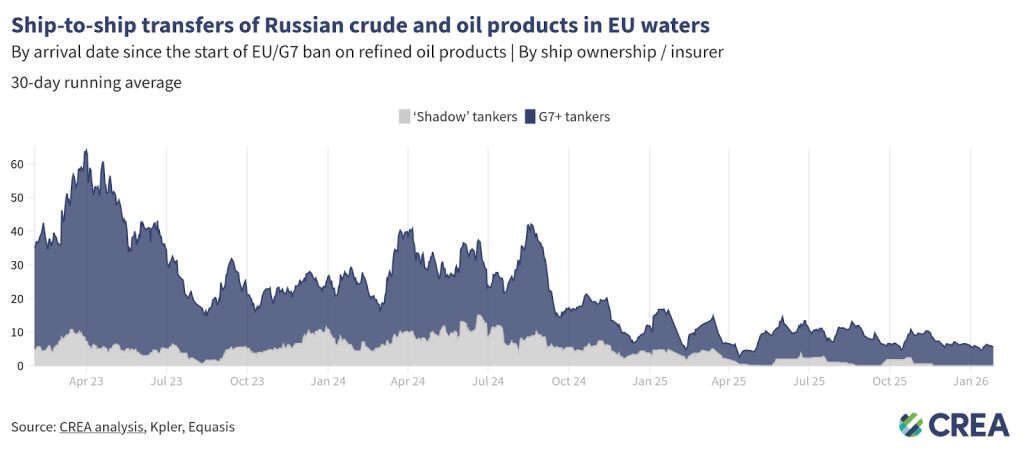
- In January 2026, an estimated EUR 68 mn worth of Russian oil was transferred via ship-to-ship (STS) transfers in EU waters.
- All STS transfers of Russian oil in EU waters were conducted in either Spain (53%) or Cyprus (47%).
- Daily transfers averaged EUR 5.5 mn — a 8% decrease compared to last month. G7+ tankers conducted 100% of these transfers.
How can Ukraine’s allies tighten the screws?
Russia’s fossil fuel export revenues have fallen since the sanctions were implemented, subsequently constricting Putin’s ability to fund his full-scale invasion of Ukraine. However, much more should be done to limit Russia’s export earnings and constrain the funding of the Kremlin’s war chest.
Implement a G7+ Maritime services ban for Russian oil
The oil price cap has failed to impose a durable constraint on Russian crude exports, working only briefly and selectively for Urals while leaving other grades and export channels largely unaffected. Urals prices dipped below the USD 60 cap only in late 2022 and early 2023 before rebounding, while ESPO crude consistently traded well above the cap due to its structural orientation toward China and Pacific markets.
At the same time, Russia has built a large ‘shadow’ fleet that now carries the majority of crude exports, reducing reliance on Western services. In January 2026, only 24% of Russian crude oil exports were transported by G7+ tankers, while 68% were carried by sanctioned ‘shadow’ vessels. This shift demonstrates that the price cap has neither constrained export volumes nor prevented Russia from selling crude above the cap through alternative logistics and buyers.
For oil products, the situation further exposes the cap’s ineffectiveness. Russia remains heavily dependent on G7+ tankers for refined product exports, which transported 76% of oil product volumes in January, yet the product price caps were set so high — up to USD 100 per barrel for premium products — that they rarely bound market prices and therefore failed to limit revenues.
Combined with the widespread use of intermediaries and SPVs, which legally separate sanctioned producers such as Rosneft and Lukoil from export transactions, Russia can continue exporting both crude and oil products while formally complying with sanctions.
These dynamics show that entity-based sanctions and price caps have been easily circumvented through SPVs and ‘shadow’ fleet growth. Considering this, CREA now proposes a full maritime services ban that targets the physical infrastructure of exports, closing these loopholes and imposing uniform, volume-based constraints on Russian oil revenues.
Restrict the growth of ‘shadow’ tankers & tighten regulations targeting the refining loophole
- Frequent sanctioning of Russian ‘shadow’ vessels has shifted Russian oil back to tankers owned or insured in G7+ countries. Nonetheless, Russian ‘shadow’ tankers still hold sway on the transport of Russian crude oil. In addition, many sanctioned vessels continue to deliver oil to ports globally, with EU and UK sanctions in particular frequently violated. Sanctioning countries must align their vessel lists and enforcement paradigms for a magnified effect on their operations.
- Maritime coastal states should intensify efforts to monitor, inspect, and detain ‘shadow’ fleet vessels that lack legal passage rights, such as unflagged, unlawfully idle, or security-risk vessels. Authorities must enforce and improve environmental and navigation laws within their territorial waters, investigating and boarding suspicious vessels when justified. Crews involved in criminal activity should face prosecution, and noncompliant ships and personnel should be subject to international arrest warrants.
- In its 18th sanctions package, the EU banned the imports of ‘oil refined from Russian crude’. The regulation bans imports from countries that are ‘net importers’ of crude oil. Net export status does not preclude the import and refining of Russian-origin crude, especially in jurisdictions with flexible or opaque crude sourcing practices. To close this enforcement gap, the exemption should be applied at the refinery level, not the national level. Refined petroleum products should be subject to import restrictions if produced at facilities that have processed Russian crude within the past six months, regardless of the final product’s declared origin or the host country’s net export position.
- The exemptions for countries including the UK, the US, Canada, Norway, and Switzerland create an opportunity for oil products refined from Russian crude to be re-exported to the EU. This gap should be closed to ensure the sanctions are comprehensive and watertight. The EU should work with its partners to encourage them to also ban the importation of oil products from refineries running on Russian crude.
- Imports of oil products or petrochemicals from storage terminals or re-export hubs in non-sanctioning countries that have received a shipment of Russian oil in the previous six months should be prohibited from exporting to sanctioning jurisdictions. This aims to prevent re-export hubs from obfuscating the origin of imported Russian oil products that are then sent to sanctioning countries, such as suspicious cases observed in Turkiye and Georgia.
Stronger sanctions enforcement and monitoring of violations
- Despite clear evidence of violations, there is a need for stronger enforcement of penalties by agencies against shippers, insurers, and vessel owners. This information must be shared widely in the public domain. Penalties against violating entities increase the perceived risk of being caught and serve as a deterrent.
- Penalties for violating the price cap must be significantly harsher. Current penalties include a 90-day ban on vessels from securing maritime services after violating the price cap, a relatively minor sanction. If found guilty of violating sanctions, vessels should be fined and banned in perpetuity.
- The G7+ countries should ban STS transfers of Russian oil in G7+ waters. STS transfers undertaken by old ‘shadow’ tankers with questionable maintenance records and insurance pose environmental and financial risks to coastal states and support Russia logistically in exporting high volumes of crude oil. Coastal states should require oil tankers suspected of being ‘shadow’ tankers transporting Russian oil through their territorial waters to provide documentation showing adequate maritime insurance. Upon failing to do so, having been identified as a ‘shadow’ tanker, they should be added to the OFAC, UK, and European sanctions lists. This policy could limit Russia’s ability to transport its oil on ‘shadow’ tankers, which are not required to comply with the oil price cap policy.
- To strengthen the integrity of maritime operations, the International Maritime Organization (IMO) must revise its guidelines to enhance transparency regarding maritime insurance. The IMO should mandate that flag states require shipowners and insurers to publicly disclose key financial information, including insurer solvency data, credit ratings from recognised agencies, and audited financial statements. Maritime authorities of coastal states should be legally able and encouraged to detain tankers that fly false flags, which therefore pose environmental and security threats.
Relevant reports:
- The shadowy world of abandoned oil tankers
- EU Mulls Replacing Russia Oil Price Cap With Ban on Services
- France seizes oil tanker in Mediterranean sailing from Russia: Macron
- Britain ‘writing the Kremlin cheques’ with Russian oil loophole
- UK insurance facilitates EUR 15bn/year Russian coal export trade
| Note on methodology: This monthly report uses CREA’s fossil shipment tracker methodology. The data used for this monthly report is taken as a snapshot at the end of each month. The data provider revises and verifies data on trades and oil shipments throughout the month. We subsequently update this verified data each month to ensure accuracy. This might mean that figures for the previous month change in our updated subsequent monthly reports. For consistency, we do not amend the previous month’s report; instead, we treat the latest one as the most accurate data for revenues and volumes. Russia’s daily revenues for commodities used in this report are derived as an average, using CREA’s pricing methodology. The number of vessels with false flags per month is calculated using an end-of-month snapshot. In other words, for each month, vessels were counted if their most recent flag change at the end of the month was to a false flag. This does not account for the vessels with multiple false flag periods (switches between false flags and verified flags, or between different false flags), only the most recent flag status at the end of the month. To calculate the volume and value carried by false flags transiting the Danish Straits, we assume that vessels loading from Russia’s Northern and Western ports (Ust-Luga, Primorsk, Vysotsk, St Petersburg, Murmansk, Arkhangelsk, Kaliningrad) must transit the Danish Straits. CREA’s estimates of the impact of a revised and lowered price cap have been updated since February 2025. These numbers are a more accurate representation of the revenue losses Russia would incur. Our earlier numbers severely underestimated the impact of a lower price cap due to a bug that we identified that mislabelled commodities in our model. |