
能源与清洁空气研究中心 (CREA)
我们是一家独立的研究机构,专注于研究空气污染的变化趋势、成因、公众健康影响以及相关解决方案。
全球每年至少有300万人死于化石燃料燃烧导致的空气污染。现代清洁能源技术的快速发展已经成为提升空气质量、保障公众健康的关键。
通过科学的数据、研究和证据,我们致力于支持全世界范围的政府、企业及倡议组织推动清洁能源与清洁空气。我们相信,高效的研究和沟通是相关政策、投资决定和倡导行动的成功关键。


最新消息
中国能源与排放趋势 2026年1月至2月简报
中国能源与排放趋势 2026年2月简报
中国能源与排放趋势 2026年1月简报
最近发表的文章
中国气候转型: 2025展望
增强煤电组合灵活性:以浙江2025/2030为例的经济与气候价值评估
中国气候转型2025: 专家调查
CREA @X
🇨🇳 🎥 WEBINAR | Recording | Implications of China’s 15th five-year plan for climate & energy transition
🔍️ In case you missed it: Join experts as they take a closer look⤵️
https://energyandcleanair.org/aspi-crea-webinar-implications-of-chinas-15th-five-year-plan-for-the-climate-and-energy-transition
w/@BelindaSchaepe; @LauriMyllyvirta; @Kate_K_Logan & @AsiaSociety

🇧🇷⚕️NEW | REPORT | CANDIOTA COAL - Health impacts of coal mining & power generation cluster in Rio Grande do Sul, Brazil
☠️ Candiota 2017–2040 coal use risks 1,300 deaths & BRL 11.7 billion - avoidable w/earlier phase-out
w/@arayaraoficial

@arayaraoficial 🏛️ CREA & ARAYARA call for:
-Accelerated coal phase-out in Candiota
-Termination of public subsidies, preferential financial treatment for coal
-Strengthening environmental licensing & emissions enforcement
-Health evidence in judicial & regulatory decisions
-A just transition
@arayaraoficial 🇧🇷⚕️CREA & ARAYARA's health impact assessment (HIA) report on the Candiota coal mining and power generation cluster in Rio Grande do Sul, Brazil is now available in English & Portuguese:
https://energyandcleanair.org/publication/coal-in-candiota-health-impacts-of-a-coal-mining-and-power-generation-cluster-in-rio-grande-do-sul-brazil

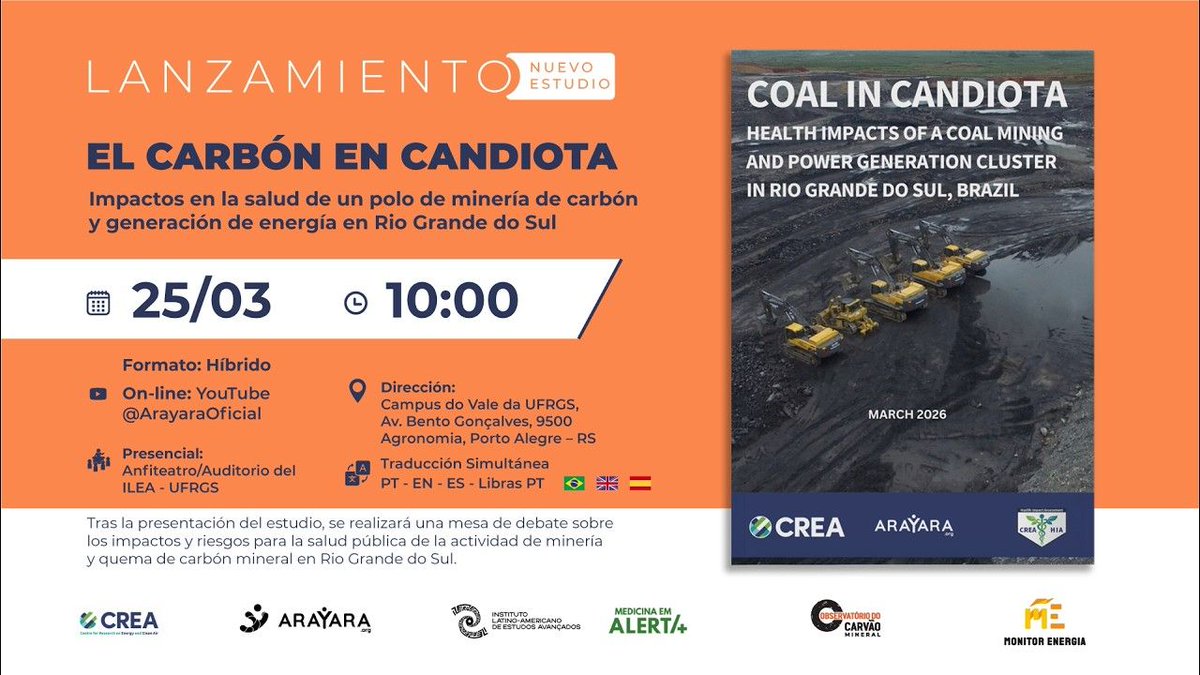
🎙️🇧🇷 REPORT LAUNCH & ROUNDTABLE | CANDIOTA COAL
⚕️Health impact assessment of a coal mining and power generation cluster in Rio Grande do Sul, Brazil
🗓️ Wednesday, 25 March 2026
🕙️ 10 BRT | 12 GMT
📍YouTube-Hybrid
🌎️ EN - PT - ES
w/@arayaraoficial
https://www.youtube.com/watch?v=a6OABIn-R94

@arayaraoficial 🎙️🇧🇷 LANÇAMENTO DO ESTUDO E MESA REDONDA | CARVAO EM CANDIOTA
⚕️📄 Impactos à saúde causados pelo polo de mineração e geração de energia a carvão no Rio Grande do Sul, Brasil
🗓️ Quarta-feira, 25 de março de 2026
🕙️ 10 BRT | 12 GMT
📍YouTube-Hibrido
https://www.youtube.com/watch?v=qyQZecP2eIk

@arayaraoficial 🎙️🇧🇷 LANZAMIENTO DEL ESTUDIO Y MESA REDONDA | EL CARBON EN CANDIOTA
⚕️📄 Impactos en la salud de un polo de minería de carbón y generación de energía en Rio Grande do Sul, Brasil
🗓️ Miércoles, 25 de marzo de 2026
🕙️ 10 BRT | 12 GMT
📍YouTube-Híbrido
https://www.youtube.com/watch?v=SQKAyRYBKYQ
🇹🇼⚕️NEW | If RE procurement by #Taiwan electronics manufacturing (EM) companies persists at 2023 level, in 2030, related #AirPollution would be linked to:
90 premature deaths
277 #ChildAsthma cases
Nearly 19,000 work absences
Almost USD 500M in health-related economic damages ⤵️

🇹🇼⚕️Health impact assessment (HIA) report on Taiwan's fossil-dominated grid-dependent electronics manufacturing (EM) industry is now available:
http://energyandcleanair.org/publication/public-health-impacts-from-electronics-industry-electricity-consumption-in-taiwan/
w/ @GreenpeaceEAsia

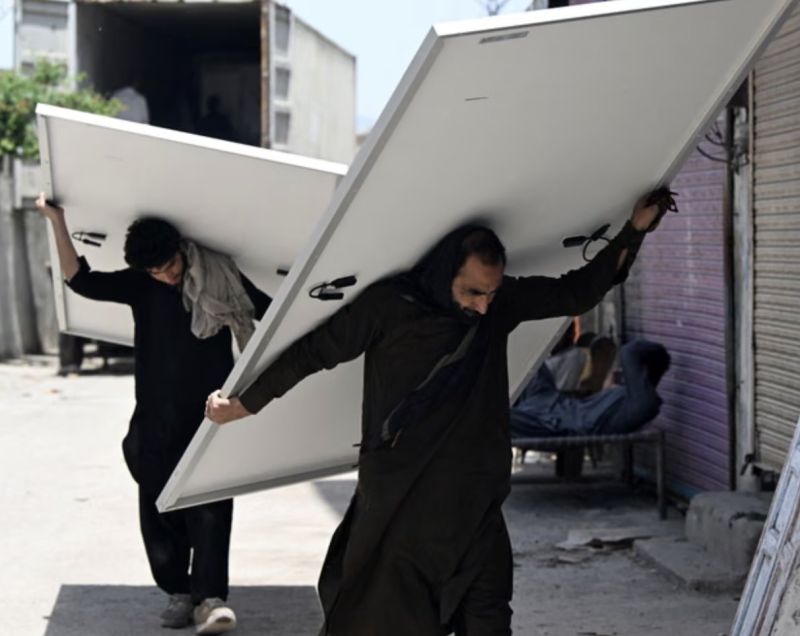
📰🇵🇰 Solar eases Hormuz crisis; Pakistan avoids USD12bn in fossil fuels
🪫After Russia’s invasion of Ukraine, gas prices surged, millions in Pakistan had no electricity
☀️But the people found rooftop solar, w/government incentives
CREA w/@renewables1st
https://theguardian.com/environment/2026/mar/17/pakistan-people-led-solar-boom-middle-east-energy-crisis
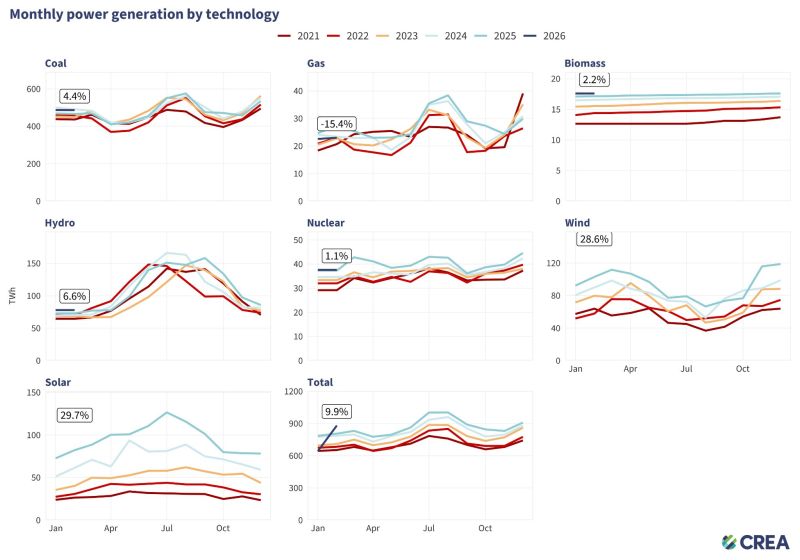
🇨🇳 NEW | China monthly snapshot | January-February 2026 | Energy & air pollution | EN & CN
Later Lunar New Year lifted Jan-Feb year-on-year power generation growth (9.9%) by delaying usual holiday-related disruption
🪨📈 In February 2026, coal power generation up 4.4% YoY
🔴 Xi'an in Shaanxi had highest monthly average PM2.5 among Chinaʼs provincial capitals, followed by Urumqi in Xinjiang & Jinan in Shandong
🔴 Worst ozone: Lhasa in Tibet; Kunming in Yunnan; & Guangzhou in Guangdong
🔴 Worst NO2: Yichuan; Urumqi, & Xi'an
🇨🇳 CREA's March 2026 #ChinaMonthlySnapshot of China's energy & air pollution trends is now available in EN & CN👇
https://energyandcleanair.org/china-energy-and-emissions-trends-january-february-2026-snapshot/
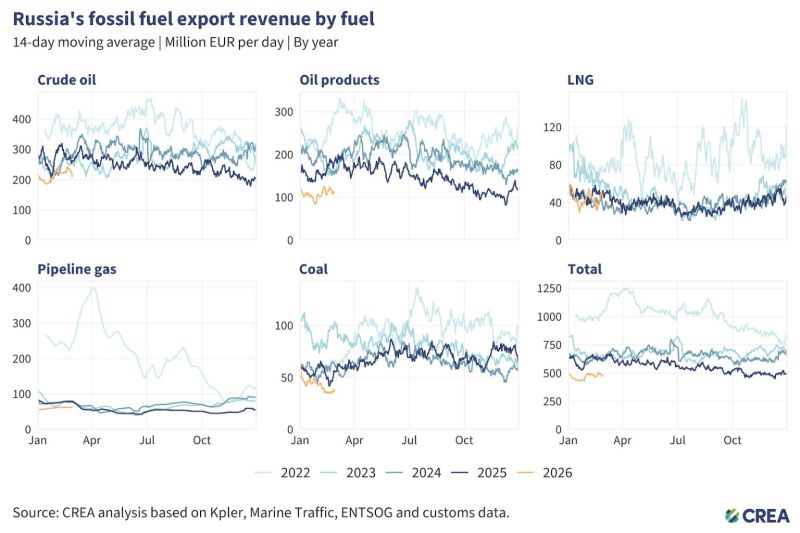
🇷🇺 NEW | Monthly analysis of Russian fossil fuel exports & sanctions
📉 In February 2026, Russia’s monthly fossil fuel export revenues saw a 7% month-on-month increase to EUR 492 mn per day. This was despite only a 1% month-on-month increase in volumes
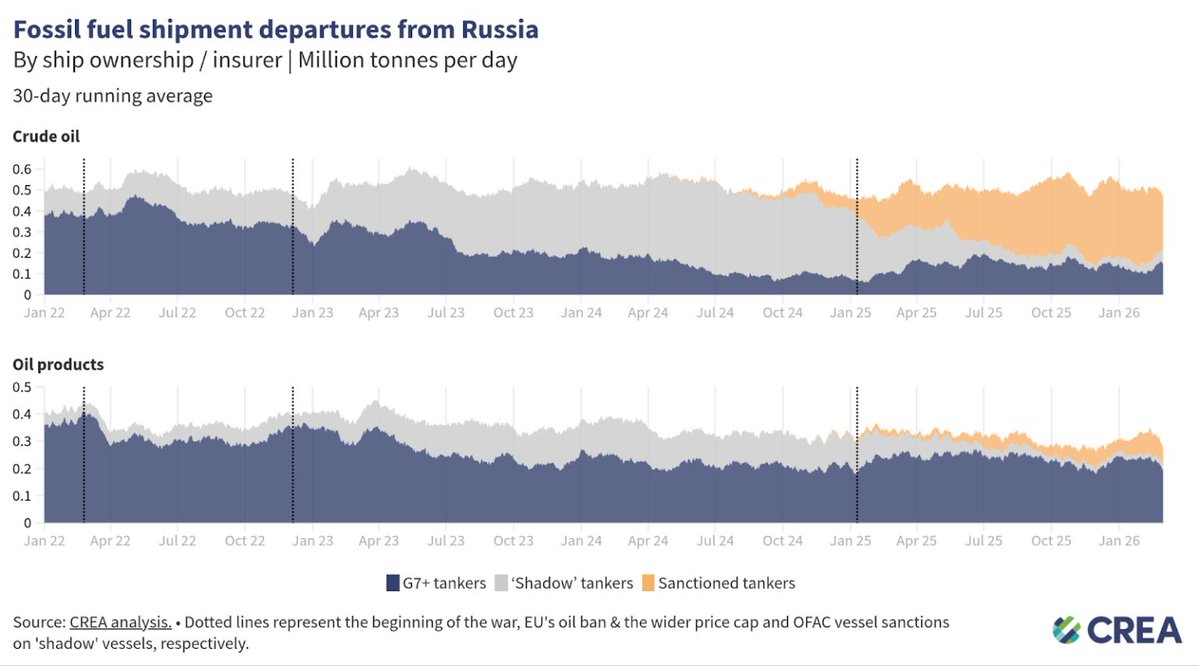
⚠️🚢In February, there was a 3% increase in the percent of Russian oil travelling on tankers flying false flags
🚩🚢 24% of Russian oil travelled on tankers flying false flags (EUR 176 mn) that transited Danish Straits — carried by 9 vessels
🇷🇺 CREA’s February 2026 monthly analysis on fossil fuel exports from Russia is now available here in EN & 🇺🇦 UA soon to follow:
Find all related CREA data here:
https://energyandcleanair.org/financing-putins-war/
#FinancingPutinsWar #StandWithUkraine

Financing Putin’s war: Fossil fuel imports from Russia during the invasion of Ukraine – Centre for...
energyandcleanair.org
📰 🇮🇳 Bokaro steel plant produces 5.25 mn tonnes of steel/year, employs +50K, yet emissions tied to est. 270 low birthweight births, 280 preterm births, 25 child asthma cases, 170 PM2.5 deaths & economic loss
@down2earthindia @danishmand_khan
http://youtu.be/53nPAegdUI4?si=66tjzQLjUG9z6w5y
Report️⤵️

@down2earthindia @danishmand_khan 🇮🇳⚕️📄 CREA's health impact assessment (HIA) on India's SAIL Bokaro steel plant is available here:
https://energyandcleanair.org/publication/air-quality-health-and-economic-impacts-of-sail-bokaro-steel-plant-in-india/
📢 We are #hiring!
🇨🇳 China Analyst
📍Remote: London-UK/EU
🔎 CREA is looking for a China #Analyst fluent in Chinese & English to monitor developments in #China’s #energy transition, particularly related to #power sector
Learn more & apply here👇
https://energyandcleanair.org/jobs/?jobId=3_k2oroQBs-O
