CREA’s H1 2026 EU CO2 emissions briefing reveals that in the first half of 2026 (H1 2026, January to June), EU CO2 emissions from fossil fuels fell by 20.9 million tonnes (Mt).
This is 2% less than the same period in 2025. EU CO2 emissions fell at just over half the pace needed to meet the EU’s 2030 climate target. Emissions in H1 2026 were 17 million tonnes above the required pathway. At the current pace, the EU would only reach the level implied by its 2030 emissions-reduction target by 2034.
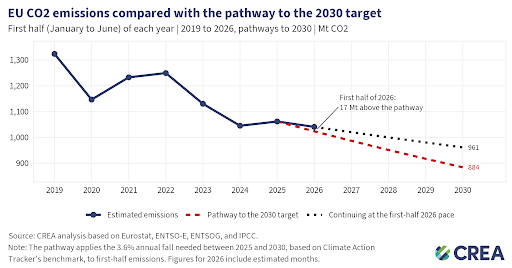
EU CO2 emissions compared with the pathway to the 2030 target
Emissions from oil used in EU industry and buildings fell 10.8% year-on-year in H1 2026, accounting for three-fifths of the EU’s total emissions reduction. The majority of the fall came between March and June, after the Hormuz crisis restricted supply and pushed up fuel prices, while industrial output remained broadly flat. CREA’s analysis of the 2022 price spike suggests some of this drop in oil emissions could reverse as prices ease and buyers refill their tanks in future months.
Gas was the only fossil fuel whose emissions rose in the EU in H1 2026 year-on-year, increasing by 3.1 Mt (0.9%). Emissions from oil fell by 21.0 Mt (4.3%), while coal emissions fell by 3.1 Mt (1.3%).
Poland saw the largest increase in H1 2026 CO2 emissions, up 8.1%, largely due to rising power generation from hard coal. Finland had the EU’s steepest emissions fall in H1 2026, down 11.8%, despite electricity demand rising 6.3% during a cold start to the year. Nuclear generation increased while coal, oil and gas use fell. Bulgaria’s emissions fell 10.1% as hydropower recovered and coal generation fell, though the decline only partially offset a sharp rise in H1 2025. Germany and France recorded the largest reductions in absolute terms, at 9.1 Mt and 8.6 Mt, respectively, largely due to lower fossil fuel use in industry, buildings and transport.
Key findings
- In the first half of 2026 (January to June, H1 2026), EU CO2 emissions from fossil fuels fell by 20.9 million tonnes (Mt), or 2.0% below H1 2025, totalling 1,040.8 Mt.
- In H1 2026, CO2 emissions fell at just over half the 3.6% annual pace needed to meet the EU’s 2030 climate target. CO2 emissions were 17 Mt above the required pathway in H1 2026, and at this pace the EU would reach the level set by its 2030 target only around 2034.
- Between the first halves of 2019 and 2026, progress came mainly from power generation, whose emissions fell by an average of 6.8% per year. Emissions from industry and buildings fell by 3.4% a year over the same period, while those from domestic transport fell by only 0.4% a year.
- Gas was the only fossil fuel whose emissions rose in H1 2026, up 3.1 Mt (+0.9%) year-on-year. Consumption increased despite the LNG supply shock, putting further pressure on already low gas storage ahead of winter and underscoring the need to reduce reliance on gas through clean power generation and electrification in the transport, buildings and industrial sectors. Emissions from oil fell by 21.0 Mt (-4.3%) and from coal by 3.1 Mt (-1.3%).
- Emissions from oil used in industry and buildings fell by 12.6 Mt (-10.8%) in H1 2026. Almost all of the reduction came between March and June, after the Hormuz crisis restricted supply and pushed up fuel prices. EU industrial output was flat (-0.2%) between January and June 2026 compared with the same period inof 2025, so lower production does not explain the fall. Deliveries of heating gasoil were 41% lower in April and May than in the same period a year earlier. Oil used in industry and buildings accounted for three-fifths of the EU’s total emissions reduction in H1 2026.
- Wind and solar generated a record 458 terawatt-hours (TWh) in H1 2026, exceeding coal and gas combined for the third consecutive first half, but renewable generation remained 13% short of the EU’s Fit for 55 pathway. Looking more broadly at clean energy (including nuclear, which has fallen more slowly than the EU Fit for 55 modelling assumes), the EU is 6% short.
- Power generation was the only sector in which emissions rose in H1 2026, by 4.5 Mt (+2.0%), marking the second consecutive increase for the first half of the year. Gas drove the increase, with gas-fired power generation in a cold January up 22% from the previous year. Coal-fired generation fell 1.0% in H1 2026.
- Transport emissions fell by 7.3 Mt (-2.0%) in H1 2026. Deliveries of road diesel between January and June were 3.4% lower than in the same months of 2025, while petrol deliveries were 1.0% higher. Diesel deliveries were already 4.0% lower in January and February than a year earlier, before the Hormuz crisis.
- Poland’s emissions rose 10.0 Mt (+8.1%) in H1 2026 compared with H1 2025, by far the largest increase in absolute terms among the member states analysed. Hard coal use rose 16.8% in Polish power plants and 48% in households, services, and agriculture.
- Finland (-11.8%), Bulgaria (-10.1%), and France (-7.4%) recorded the largest percentage drop in CO2 emissions among the member states analysed in H1 2026 compared with H1 2025. Germany (9.1 Mt) and France (8.6 Mt) recorded the largest absolute declines.
Policy recommendations
EU CO2 emissions fell in H1 2026 at just over half the pace required to meet the 2030 target, and much of the reduction was driven by a price shock.
Closing the gap to the 2030 target depends on changes that keep emissions falling once fuel prices ease, including cleaner, more flexible power systems, electrified heating and transport, and faster progress in member states where emissions are rising.
- Keep carbon pricing strong and predictable
- Clean up the power sector faster
- Turn a temporary fall in oil use into a lasting one
- Target support where emissions are rising
| Methodology Emissions are estimated with CREA’s EU CO2 emissions tracker, which applies IPCC emission factors to the fossil fuel use recorded in Eurostat’s monthly energy statistics. The estimates cover CO2 from fossil fuel combustion in power generation, industry and buildings, and domestic transport. The estimates exclude international aviation and shipping, industrial process emissions, and land use. Emissions are counted when fuel is delivered to the market, which, for oil, can differ from when and where it is burned. Find the full methodology in the report. |