The National Clean Air Programme (NCAP), initiated by the Government of India, aims to reduce coarse particulate matter (PM10) concentrations by 40% by 2026, using FY17-18 levels as a benchmark. By focusing on enhancing air quality monitoring, implementing city-specific action plans, promoting public awareness, and fostering multi-level governance collaboration, NCAP seeks to mitigate the adverse impacts of air pollution on public health and the environment.
However, there are some major concerns due to the absence of legally binding targets and stringent enforcement mechanisms, which may undermine NCAP’s effectiveness in ensuring compliance and achieving significant pollution reductions. Additionally, the reliance on city-specific action plans has been questioned for potentially overlooking broader regional and transboundary pollution sources. Furthermore, the lack of robust, consistent, transparent data collection and reporting mechanisms poses challenges to accurately assessing progress and holding decision-makers and stakeholders accountable.
Key messages
- The number of cities with PM10 levels exceeding the National Ambient Air Quality Standards (NAAQS) by twice the limit rose from eight in FY17-18 to a peak of 26 in FY22-23, before slightly dropping to 22 in FY23-24.
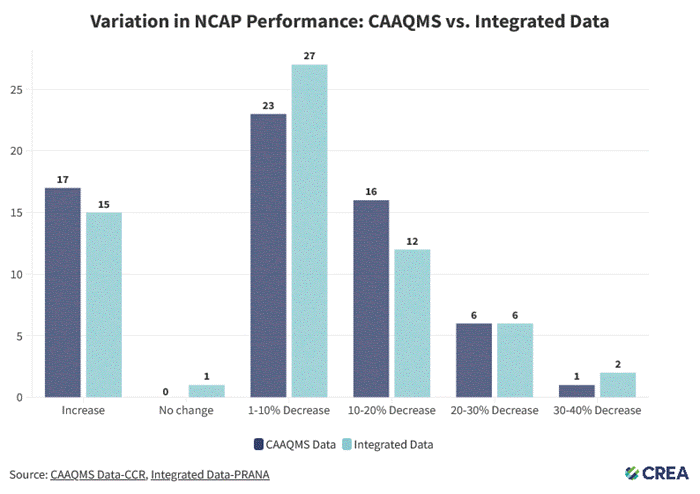
- The analysis of PM10 concentration changes revealed significant variation between continuous ambient air quality monitoring stations (CAAQMS) data and data integrated with that of the National Air Quality Monitoring Programme (NAMP).
- CAAQMS reported increases in PM10 levels for 17 cities, while integrated data noted increases in 15 cities; for decreases, CAAQMS identified 23 cities with a 1-10% decrease, compared to 27 in integrated data, along with 16 cities with a 10-20% decrease, versus 12 in integrated data. Both sources reported six cities with a 20-30% decrease; and CAAQMS recorded one city with a 30-40% decrease, while integrated data showed two cities in that range.
- Notably, cities like Byrnihat showed differing PM10 levels between the two sources, highlighting integration challenges, where CAAQMS recorded a PM10 concentration of 266 µg/m³, while integrated data showed only 104 µg/m³.
- The significant variation between this data raises serious questions about data accuracy. These contrasting contributions have raised critical questions about the accuracy of air quality data, suggesting potential inconsistencies that could misrepresent actual improvements.
Recommendations
- CAAQMS and NAMP data needs to be analysed separately in order to arrive at an accurate representation of the pollution.
- The integrity of the data needs to be maintained by locating monitoring stations in proper locations, maintaining them adequately and finally ensuring that the stations and data are tamper proof.
- It is important to continue to use both CAAQMS and NAMP methods to measure air pollution in India with a clear plan to convert NAMP stations to CAAQM stations in a time-bound manner.