Authors: Petras Katinas, Vaibhav Raghunandan
Sanctioned tankers transported 44% of Russian crude in October, as revenues continue to slide to the lowest levels since the full-scale invasion
Key findings
- In October 2025, Russia’s monthly fossil fuel export revenues saw a 4% month-on-month decline to EUR 524 million (mn) per day — the lowest they have been since the full-scale invasion of Ukraine.
- G7+ tankers transported 38% of Russian crude oil exports, while non-sanctioned ‘shadow’ tankers accounted for 18%. The largest share, 44%, was carried by sanctioned ‘shadow’ tankers.
- The EU’s five largest importers paid Russia EUR 938 mn for fossil fuels. Natural gas — unsanctioned by the EU — accounted for two-thirds of these imports, delivered mainly by pipeline or as liquefied natural gas (LNG).
- The EU, Australia, the UK, and the US imported EUR 971 mn of refined products from Indian and Turkish refineries using Russian crude. An estimated EUR 443 mn of these products were refined from Russian crude. Australia and the US’ imports from these refineries saw a 140% and 17% month-on-month increase, respectively.
- In October, the EU and UK sanctioned Vadinar refinery’s imports from Russia increased 32% month-on-month to their highest volumes since the full-scale invasion.
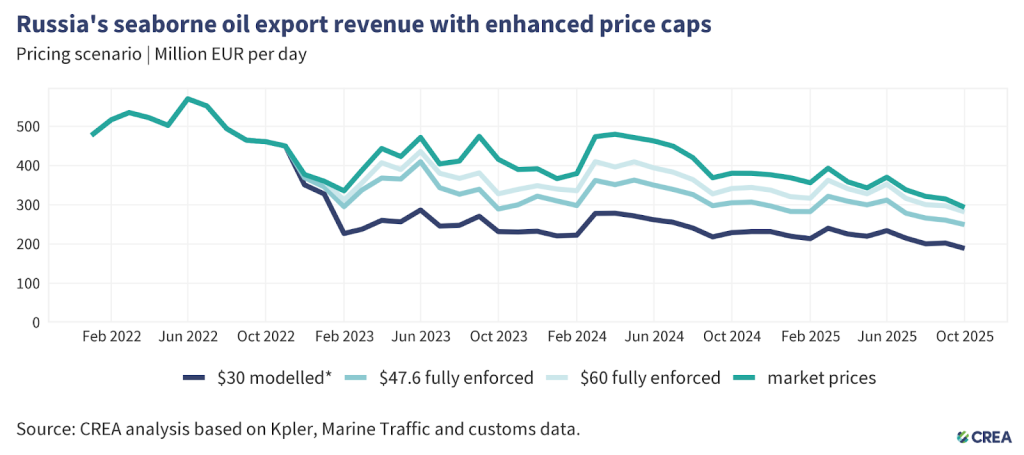
- A lower price cap of USD 30 per barrel would have slashed Russia’s oil export revenue by 40% from the start of the EU sanctions in December 2022 until the end of October 2025. In October alone, a USD 30 per barrel price cap would have slashed Russian revenues by 36%.
Trends in total export revenue
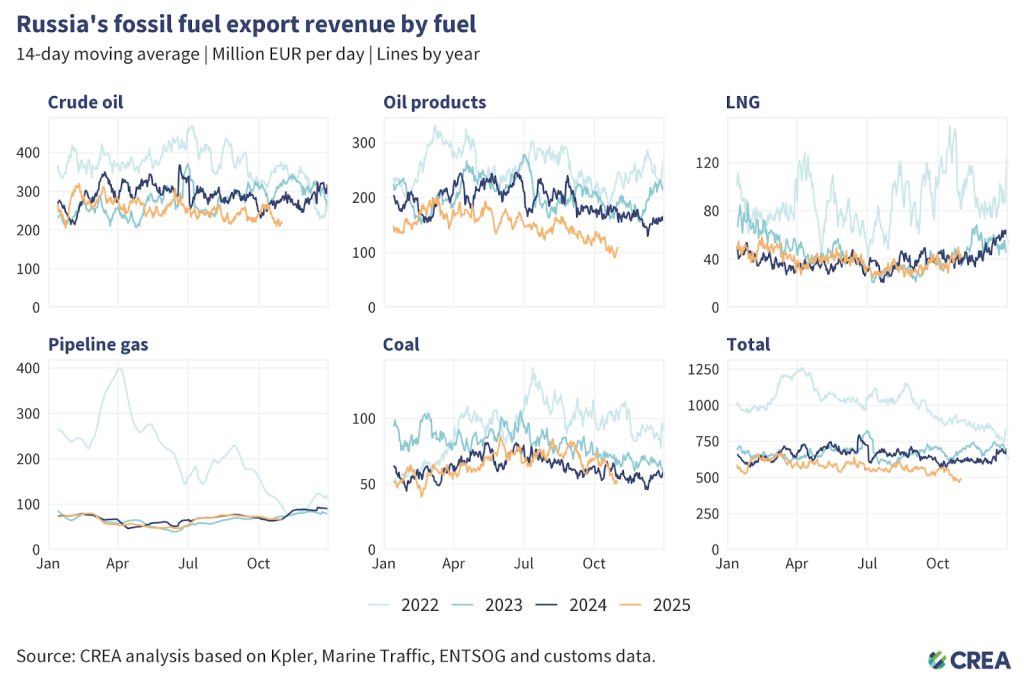
- In October, Russia’s monthly fossil fuel export revenues saw a 4% month-on-month decline to EUR 524 mn per day — the lowest they have been since the full-scale invasion of Ukraine.
- Crude oil revenues remained stable at EUR 238 mn per day, with EUR 59 mn per day from pipeline exports and EUR 179 mn per day from seaborne crude oil.
- Liquefied natural gas (LNG) revenues increased by 10% to EUR 38 mn per day, corresponding to a 29% increase in exported volumes.
- Pipeline gas revenues decreased by 6% to EUR 69 mn per day.
- Revenues from exports of seaborne oil products saw a steep 11% month-on-month decline, at EUR 114 mn per day.
- Coal revenues dropped by 10% month-on-month to EUR 62 mn per day, with exported volumes increasing by 14%. This marks the first time Russia’s coal revenues have declined in the last six months.
Who is buying Russia’s fossil fuels?
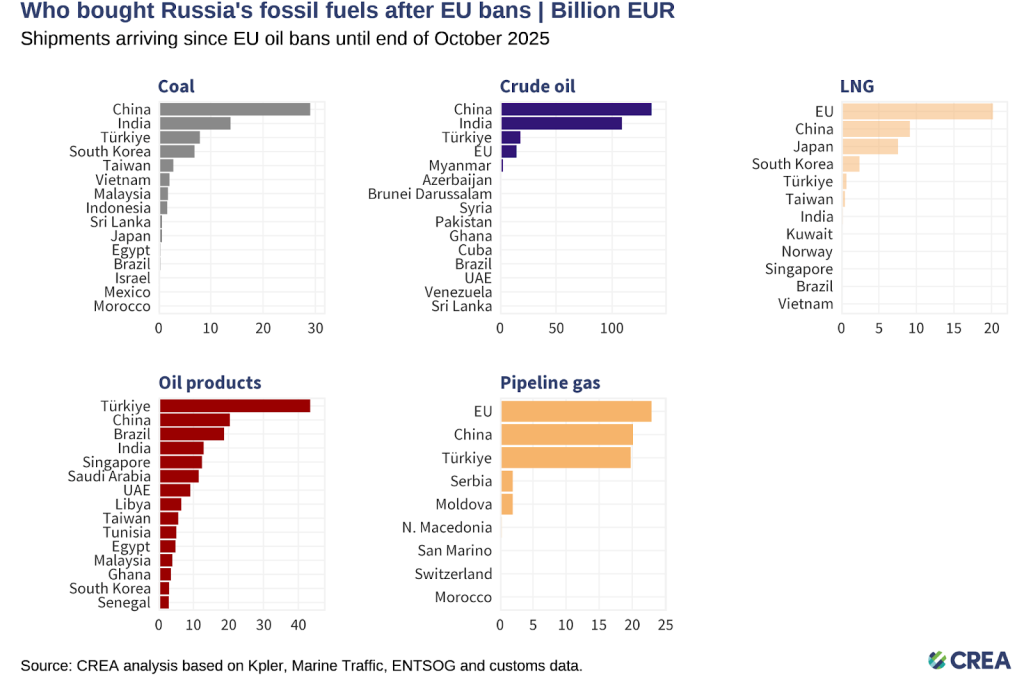
- Russia’s fossil fuel exports remain highly concentrated, with China dominating coal and crude oil purchases, Turkiye dominating purchases of oil products, and the EU still the largest buyer of LNG and pipeline gas — showing Moscow’s dependence on a narrow set of key customers.
- Coal: From 5 December 2022 until the end of October 2025, China purchased 42% of all of Russia’s coal exports. India (20%), Türkiye (11%), South Korea (10%), and Taiwan (4%) round out the top five buyers’ list.
- Crude oil: China has bought 47% of Russia’s crude exports, followed by India (38%), Turkiye (6%) and the EU (6%).
- Oil products: Turkiye, the largest buyer, has purchased 26% of Russia’s oil product exports, followed by China (12%), Brazil (11%) and Singapore (8%).
- LNG: The EU remains the largest buyer of Russian LNG, and has bought almost half (49%) of Russia’s total LNG exports, followed by China (22%) and Japan (18%).
- Pipeline gas: The EU is the largest buyer, purchasing 34% of Russia’s pipeline gas, followed by China (30%) and Turkiye (29%).
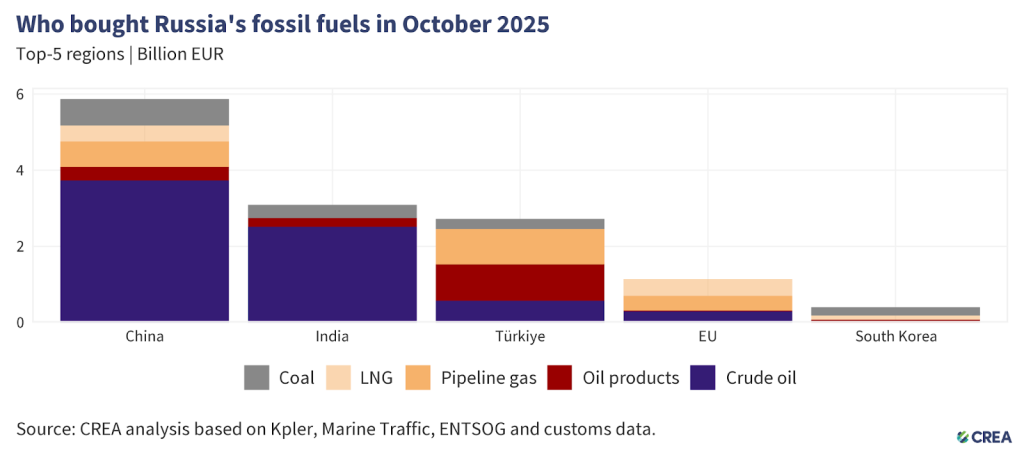
- In October 2025, China remained the largest global buyer of Russian fossil fuels, accounting for 44% (EUR 5.8 bn) of Russia’s export revenues from the top five importers. Crude oil made up 63% (EUR 3.7 bn) of China’s purchases, followed by coal at 12% (EUR 704 mn), pipeline gas at 11% (EUR 668 mn), LNG at 7% (EUR 487 mn), and oil products at 6% (EUR 355 mn).
- China’s seaborne crude imports from Russia saw a 21% month-on-month rise, while total seaborne imports recorded a significantly more modest 9% month-on-month growth. While Rosneft and Lukoil supplies flowed to China consistently for the first three weeks of the month, they were entirely absent from deliveries made in the final week of October — despite the OFAC sanctions not taking effect till November 21.
- India remained the second-largest buyer of Russian fossil fuels, importing a total of EUR 3.1 bn. Crude oil dominated India’s purchases at 81% (EUR 2.5 bn), followed by coal at 11% (EUR 351 mn) and oil products at 7% (EUR 222 mn).
- India’s Russian crude imports recorded a 11% month-on-month increase, which corresponds closely to an 8% month-on-month increase in total imports. While private refiners’ imports constituted over two-thirds of India’s total imports, state owned refineries almost doubled their Russian volumes month-on-month in October.
- In a keen development, the Rosneft owned Vadinar refinery — now sanctioned by the EU and the UK — increased its production to 90% capacity in October. After the EU sanctions in July, the refinery has been importing crude solely from Russia. In October, their imports from Russia recorded a 32% month-on-month increase to their highest volumes since the full-scale invasion. Exports from the refinery have dropped significantly (-47% compared to the same month last year) to the lowest levels since May 2023.
- Turkiye was the third-largest importer of Russian fossil fuels, accounting for 21% (EUR 2.7 bn) of Russia’s export revenues from its top five buyers. Oil products constituted the largest share of Turkiye’s imports at 35% (EUR 957 mn), followed by pipeline gas at 34% (EUR 929 mn). Crude oil (EUR 572 mn) and coal (EUR 259 mn) constituted the remainder of their imports.
- Turkiye’s imports of oil products from Russia saw a 25% month-on-month increase. Diesel constituted the majority of its imports from Russia (46%) and imports saw a 9% month-on-month rise.
- The EU was the fourth-largest buyer of Russian fossil fuels, accounting for 9% (EUR 1.1 bn) of Russia’s export revenues from the top five importers. The majority of imports, 73% (EUR 824 mn), consisted of LNG and pipeline gas, followed by crude oil at 26% (EUR 311 mn), and a small — 1% (EUR 15 mn) — portion of oil products.
- South Korea remained the fifth-largest importer of Russian fossil fuels. More than half (53%) of their imports, valued at EUR 215 mn, consisted of coal, followed by LNG (EUR 107 mn) and oil products (EUR 80 mn).
- South Korea’s coal total imports dropped by a sharp 15% in October, but Russian volumes suffered a much bigger 24% month-on-month decline. Korean companies might also be hitting ‘internal limits’ on Russian purchases. While the limits are not formalised they are followed by state owned companies to plan purchases through the year.
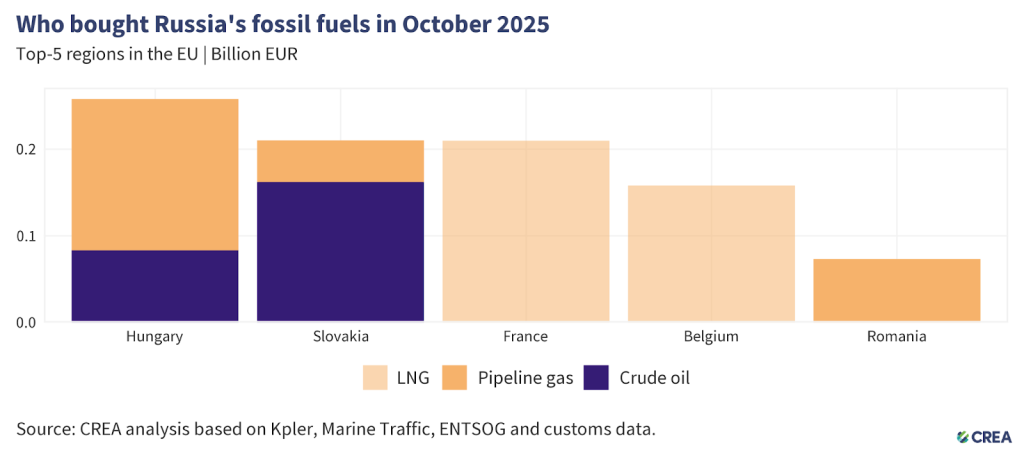
- In October 2025, the five largest EU importers of Russian fossil fuels paid Russia a combined EUR 938 mn for fossil fuels. Natural gas — unsanctioned by the EU — accounted for two-thirds of these imports, delivered mainly by pipeline or as liquefied natural gas (LNG). The remainder was largely crude oil, which continues to flow to Hungary and Slovakia through the southern branch of the Druzhba pipeline under an EU exemption.
- Hungary was the EU’s largest importer, purchasing EUR 258 mn worth of Russian fossil fuels. This included EUR 83 mn of crude oil and EUR 175 mn of pipeline gas.
- Slovakia was the second-highest importer, with imports totaling EUR 210 mn. Crude oil delivered via the Druzhba pipeline made up 77% of the total (EUR 162 mn), while pipeline gas accounted for EUR 48 mn. The derogation allowing Slovak refineries to process Russian crude into oil products and re-export them to Czechia expired on 5 June, which suggests that all refined oil products are consumed domestically.
- France was the third-largest buyer, importing EUR 209 mn of Russian fossil fuels, all in the form of LNG. However, not all of this gas is consumed domestically — a study shows that some LNG entering through the Dunkerque terminal is subsequently delivered to Germany.
- Belgium was the fourth-biggest importer, importing EUR 158 mn of Russian LNG, while Romania, in fifth place, purchased EUR 74 mn natural gas via pipeline.
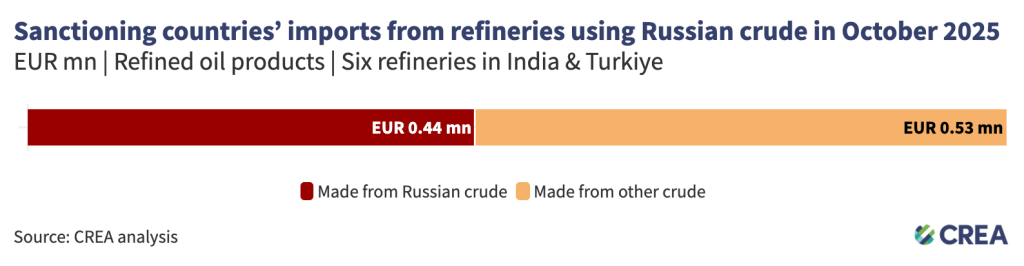
- In October, the EU, Australia, the UK and the US imported EUR 971 mn of refined products from six Indian and Turkish refineries using Russian crude. An estimated EUR 443 mn of these products were refined from Russian crude.
- While there was an 8% month-on-month reduction in sanctioning countries’ imports from the six Indian and Turkish refineries using Russian crude in October, the decrease was led chiefly by the EU and UK, who recorded monthly reductions of 9% and 73%. By contrast, Australia’s imports in October saw a 140% increase to EUR 93 mn and US imports also recorded a 17% increase to EUR 126.6 mn. Both of these are yet to announce a ban on oil products made from Russian crude.
- Australia’s imports originated chiefly from the Jamnagar and New Mangalore refineries in India, while the US’s came from the former as well as the two Tupras owned refineries in Turkiye.
How are oil prices changing?
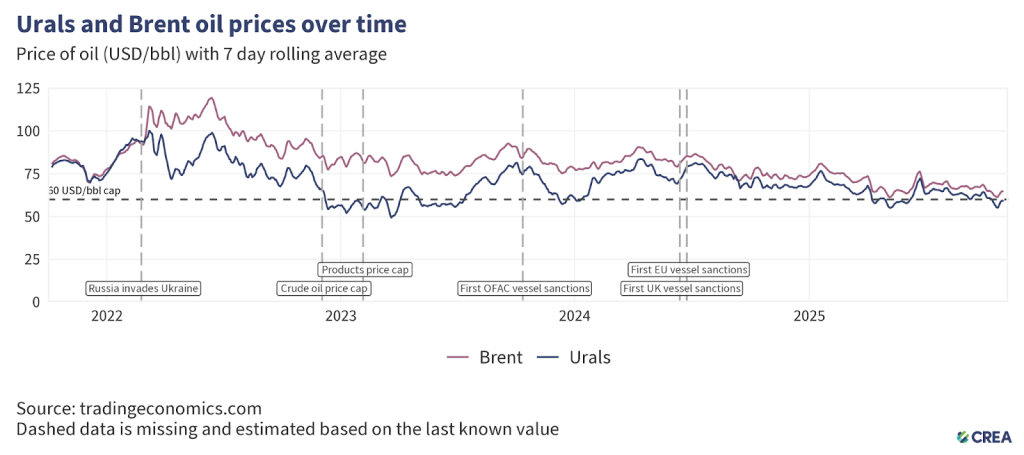
- In October 2025, the average price of Russia’s Urals crude fell by 4% to USD 59 per barrel, remaining above the new price cap of USD 47.6 per barrel.
- The lower price cap introduced by the EU, UK, Canada, Norway, Switzerland, and Australia took effect on 3 September. A transitional exemption remained in place until 18 October 2025, allowing the execution of contracts that (i) were signed before 20 July 2025 and (ii) complied with the previous USD 60 cap when concluded.
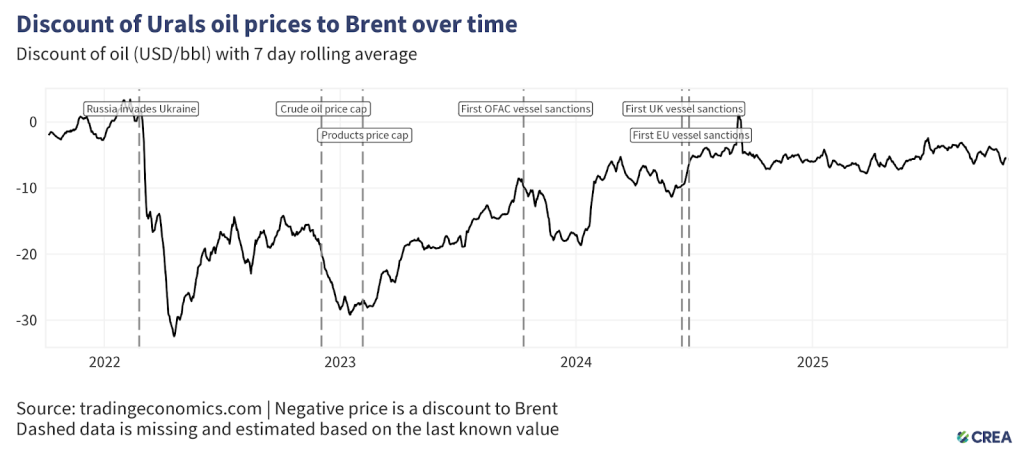
- In October, the discount on Urals crude narrowed by 4% month-on-month, averaging USD 4.92 per barrel below Brent.
- This discount may also have been impacted by the implementation of the agreed lower price cap level of USD 47.6 per barrel.
G7+ tankers regaining hold on Russian oil after Western sanctions
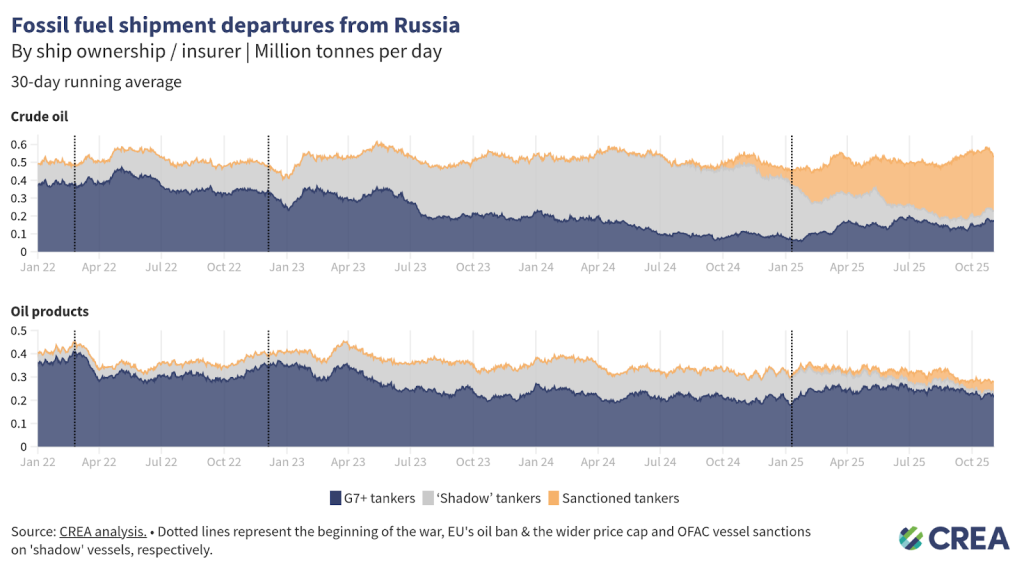
- In October, G7+ tankers transported 38% of Russian crude oil exports, while non-sanctioned ‘shadow’ tankers accounted for 18%. The largest share, 44%, was carried by sanctioned ‘shadow’ tankers.
- For oil products, dependence on G7+ tankers is even greater, transporting 79% of Russian refined products. Sanctioned ‘shadow’ vessels carried 15% of total Russian refined oil products, while non-sanctioned ‘shadow’ tankers accounted for only 6% of volumes.
‘Shadow’ tankers pose significant risks to ecology & impact of sanctions
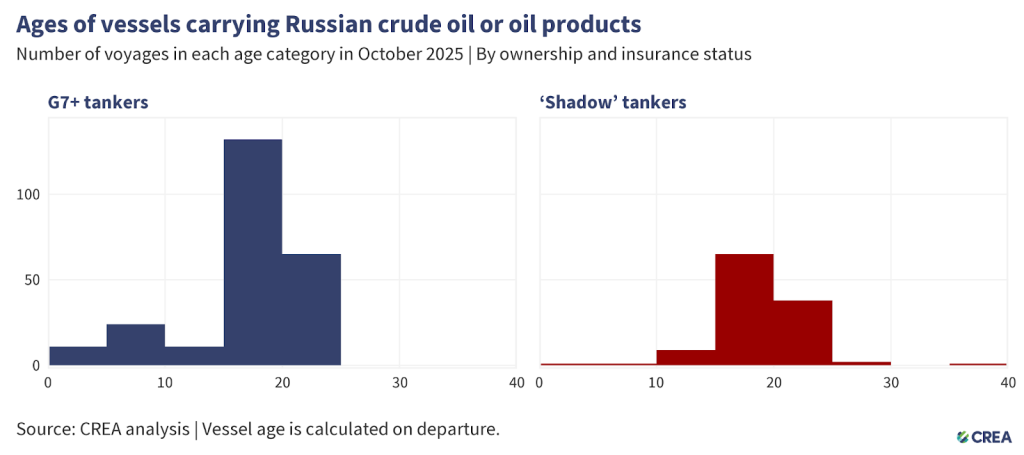
- In October 2025, 360 vessels exported Russian crude oil and oil products, of which 117 were ‘shadow’ tankers. Forty-one ‘shadow’ tankers were at least 20 years or older.
- Older ‘shadow’ tankers transporting Russian oil through EU waters pose environmental and financial risks due to their age, poor maintenance, and inadequate protection and indemnity (P&I) insurance. In the event of an oil spill or accident, coastal states may face significant cleanup costs and damage to their marine ecosystems.
- The cost of cleanup and compensation resulting from an oil spill from tankers with dubious insurance could amount to over EUR 1 bn for coastal country’s taxpayers.
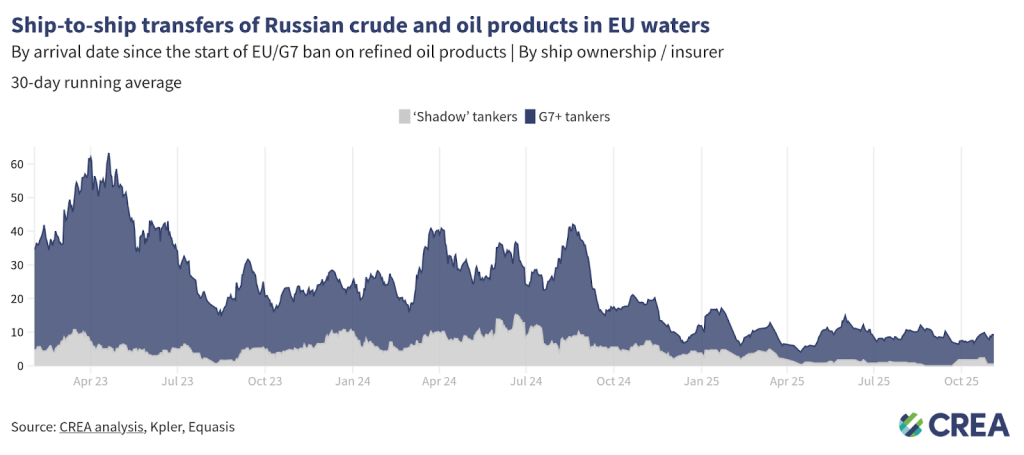
- In October 2025, an estimated EUR 112 mn worth of Russian oil was transferred daily via ship-to-ship (STS) transfers in EU waters — a 35% month-on-month increase. G7+ tankers conducted 80% of these transfers, while the rest involved ‘shadow’ vessels, which are often uninsured or registered under flags of convenience.
How can Ukraine’s allies tighten the screws?
Russia’s fossil fuel export revenues have fallen since the sanctions were implemented, subsequently constricting Putin’s ability to fund the war. However, much more should be done to limit Russia’s export earnings and constrict the funding of the Kremlin’s war chest. This includes lowering the oil price cap for crude and oil products, increasing monitoring and enforcement of sanctions, and banning unsanctioned fossil fuels such as LNG and pipeline fuels that are legally allowed into the EU.
Lowering the oil price cap
- Since 3 September 2025, two different levels of the price cap have been applied to Russian crude oil. The EU, UK, Canada, Norway, Switzerland, and Australia have set a price cap of USD 47.6 per barrel on Russian crude. Meanwhile, the US still sticks to the USD 60 per barrel cap.
- The cap on refined oil products remains unchanged by this division. Since more members of the original price-cap coalition are now following the lowered cap, CREA is now modeling the effects of full enforcement of it.
- A lower price cap of USD 30 per barrel (still well above Russia’s production cost, which averages USD 15 per barrel) would have slashed Russia’s oil export revenue by 40% (EUR 160 bn) from the start of the EU sanctions in December 2022 until the end of October 2025. In October alone, a USD 30 per barrel price cap would have slashed Russian revenues by 36% (EUR 3.24 bn).
- Lowering the price cap would be deflationary, reducing Russia’s oil export prices and inducing more production from Russia to offset the drop in revenue.
- In October 2025 alone, full enforcement of the USD 47.6 per barrel price cap would have reduced revenues by approximately 15% (EUR 1.36 bn).
Restrict the growth of ‘shadow’ tankers & tighten regulations targeting the refining loophole
- Frequent sanctioning of Russian ‘shadow’ vessels has shifted Russian oil back to tankers owned or insured in G7+ countries. Nonetheless, Russian ‘shadow’ tankers still hold sway on the transport of Russian crude oil. In addition, many sanctioned vessels continue to deliver oil to ports globally, with EU and UK sanctions in particular frequently violated. Sanctioning countries must align their vessel lists and enforcement paradigms for a magnified effect on their operations.
- Maritime coastal states should intensify efforts to monitor, inspect, and detain ‘shadow’ fleet vessels that lack legal passage rights, such as those unflagged, unlawfully idle, or posing security risks. Authorities must enforce and improve environmental and navigation laws within their territorial waters, investigating and boarding suspicious vessels when justified. Crews involved in criminal activity should face prosecution, with noncompliant ships and personnel subject to international arrest warrants.
- In its 18th sanctions package, the EU has banned the imports of ‘oil refined from Russian crude’. The regulation bans imports from countries that are ‘net importers’ of crude oil. Net export status does not preclude the import and refining of Russian-origin crude, especially in jurisdictions with flexible or opaque crude sourcing practices. To close this enforcement gap, the exemption should be applied at the refinery level, not the national level. Refined petroleum products should be subject to import restrictions if produced at facilities that have processed Russian crude within the past six months, regardless of the final product’s declared origin or the host country’s net export position.
- The current grace period provides Russia as well as traders buying oil refined using Russian crude with excessive time to adjust supply chains and maintain oil revenue. A shorter 60-day wind‑down period, focused on high‑risk refined products like diesel and jet fuel, would reduce Russia’s fiscal gains and limit circumvention opportunities. It would also give the EU sufficient time to secure alternative suppliers.
- The exemption of countries including the UK, US, Canada, Norway, and Switzerland creates an opportunity for oil products refined from Russian crude to be re-exported to the EU. This gap should be closed to ensure the sanctions are comprehensive and watertight. The EU should work with its partners to encourage them to also ban the importation of oil products from refineries running on Russian crude.
Stronger enforcement & monitoring of the price cap
- Despite clear evidence of violations, there is a need for stronger enforcement of penalties by agencies against shippers, insurers, and vessel owners. This information must be shared widely in the public domain. Penalties against violating entities increase the perceived risk of being caught and serve as a deterrent.
- Penalties for violating the price cap must be significantly harsher. Current penalties include a 90-day ban on vessels from securing maritime services after violating the price cap, a relatively minor sanction. If found guilty of violating sanctions, vessels should be fined and banned in perpetuity.
- The G7+ countries should ban STS transfers of Russian oil in G7+ waters. STS transfers undertaken by old ‘shadow’ tankers with questionable maintenance records and insurance pose environmental and financial risks to coastal states and support Russia logistically in exporting high volumes of crude oil. Coastal states should require oil tankers suspected of being ‘shadow’ tankers transporting Russian oil through their territorial waters to provide documentation showing adequate maritime insurance. Upon failing to do so, having been identified as a ‘shadow’ tanker, they should be added to the OFAC, UK, and European sanctions list. This policy could limit Russia’s ability to transport its oil on ‘shadow’ tankers, which are not required to comply with the oil price cap policy.
- To strengthen the integrity of maritime operations, it is imperative that the International Maritime Organization (IMO) revises its guidelines to enhance transparency regarding maritime insurance. The IMO should mandate that flag states require shipowners and insurers to publicly disclose key financial information, including insurer solvency data, credit ratings from recognized agencies, and audited financial statements. Maritime authorities of coastal states should be legally able and encouraged to detain tankers that fly false flags which therefore pose environmental and security threats.
Relevant reports:
- Iran, Russia and the New Zealand insurer that kept their sanctioned oil flowing
- Russia’s budget crisis explained
- Climate damage caused by Russia’s war in Ukraine
- How Russia circumvents sanctions
- Vasyl Myroshnychenko: Does Australia still stand with Ukraine?
- Sanctioned Russian ‘shadow’ tankers in Australian oil product supply chains
- U.S. hits top Russian oil companies Rosneft and Lukoil with sanctions
- Trump grants Hungary one-year exemption from Russian energy sanctions
- ‘Loophole’ in sanctions allowing Russian oil to be imported to Australia through port part-owned by Macquarie Bank
| Note on methodology: This monthly report uses CREA’s fossil shipment tracker methodology. The data used for this monthly report is taken as a snapshot at the end of each month. The data provider revises and verifies data on trades and oil shipments throughout the month. We subsequently update this verified data each month to ensure accuracy. This might mean that figures for the previous month change in our updated subsequent monthly reports. For consistency, we do not amend the previous month’s report; instead, we treat the latest one as the most accurate data for revenues and volumes. Russia’s daily revenues for commodities used in this report are derived as an average, using CREA’s pricing methodology. CREA’s estimates of the impact of a revised and lowered price cap have been updated since February 2025. These numbers are a more accurate representation of the revenue losses Russia would incur. Our earlier numbers severely underestimated the impact of a lower price cap due to a bug that we identified that mislabelled commodities in our model. |