Russia’s monthly fossil fuel export earnings drop 5% to lowest level in 2024
Key findings
- Russia’s monthly fossil fuel export revenues saw a 5% month-on-month drop to EUR 664 mn per day.
- In June 2024, the EU was the largest importer of Russian LNG, purchasing 54% of Russia’s total exports, followed by China (22%) and Japan (18%).
- Belgium, Spain, and France imported exclusively LNG from Russia in June. Belgium was the second-largest overall importer of Russian fossil fuels, buying EUR 223 mn, followed by Spain with EUR 182 mn and France with EUR 151 mn.
- A lower price cap of USD 30 per barrel (still well above Russia’s production costs that average USD 15 per barrel) would have slashed Russia’s revenue by EUR 58 bn (25%) since the sanctions were imposed in December 2022 until the end of June 2024. A USD 30 per barrel price cap would have slashed Russian revenues by EUR 3.23 bn (25%) in June alone.
- Since introducing sanctions until the end of June 2024, thorough enforcement of the oil price cap policy would have slashed Russia’s revenues by 8% (EUR 19.52 bn). In June alone, full enforcement of the price cap would have slashed revenues by 10% (approximately EUR 1 bn).
- In June 2024, the EU announced its 14th sanctions package that has for the first time targeted 27 specific vessels contributing to Russia’s warfare against Ukraine. These vessels are subject to a port access ban and a ban on service provision.
| EU imports of Russian gas surge by 27% in the first half of 2024, sending EUR 8.7 bn to Kremlin coffers |

| Despite the European Union’s concerted efforts to reduce reliance on Russian natural gas following Russia’s full-scale invasion of Ukraine, EU imports from Russia surged by 27% year-on-year in the first half of 2024 and sent EUR 8.7 bn in revenues to Russia. The spike has deepened the EU’s dependency on Russian gas. In the first six months of this year, imports from Russia have made up 20% of the EU’s total natural gas intake (including transshipment operations), a rise of 4 percentage points from last year. Despite some EU countries seeking sanctions against Russian LNG, there has been a 9% year-on-year increase in the bloc’s LNG imports in the first half of the year. Russian LNG comprises 43% of the EU’s total Russian gas imports this year. The remainder of the EU’s imported natural gas from Russia arrived via transit through Ukraine and the TurkStream pipeline, with imports increasing significantly. Gas imports entering the EU through the TurkStream pipeline rose by 64%, while imports via Ukraine increased by 30% year-on-year. |
Trends in total export revenue

- In June 2024, Russia’s monthly fossil fuel export revenues saw a 5% month-on-month drop to EUR 664 mn per day.
- Revenues from seaborne crude oil were EUR 227 mn per day — at the same level as the previous month.
- A marginal drop in the price of Russian crude oil also saw revenues from crude oil via pipeline drop by 3% to EUR 84 mn per day.
- A similar trend was witnessed in Russian revenues from exports of seaborne oil products, which saw a 5% month-on-month decrease to EUR 209 mn per day.
- In June, Russian LNG export revenues decreased 9% to EUR 34 mn per day, and revenues from pipeline gas dropped 11% month-on-month to EUR 49 mn per day.
- Russian revenues from coal exports saw a 14% month-on-month drop to EUR 59 mn per day.
Who is buying Russia’s fossil fuels?
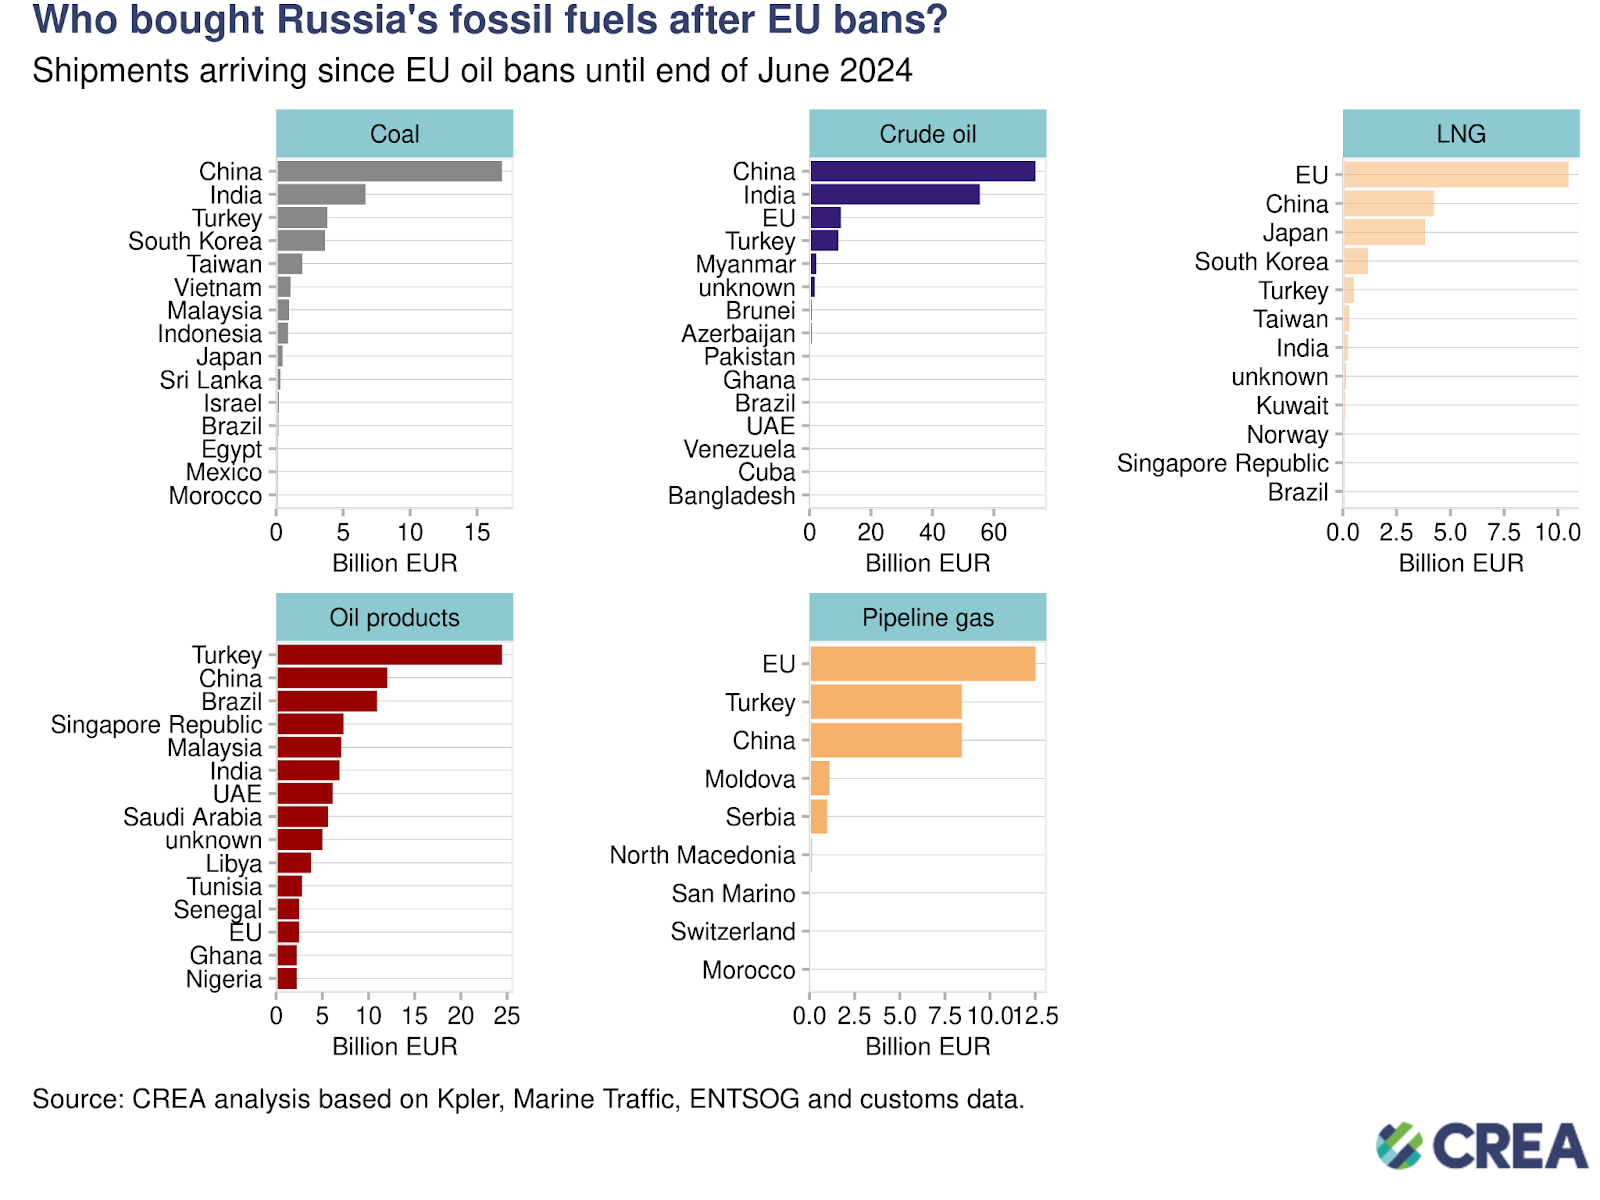
- Coal: From 5 December 2022 until the end of June 2024, China purchased 45% of all Russia’s coal exports followed by India (18%) and South Korea (10%).
- Crude oil: China has bought 47% of Russia’s crude exports, followed by India (35%), the EU (7%), and Turkey (6%).
- LNG: The EU was the largest buyer, purchasing 50% of Russia’s LNG exports, followed by China (20%) and Japan (18%).
- Oil products: Turkey, the largest buyer, has purchased 24% of Russia’s oil product exports, followed by China (12%) and Brazil (11%).
- Pipeline gas: The EU was the largest buyer, purchasing 39% of Russia’s pipeline gas, followed by Turkey (29%) and China (26%).

- China was the largest buyer of Russian fossil fuels in June, accounting for 43% (EUR 5.9 bn) of Russia’s monthly export earnings from the top five importers. Crude oil comprised 67% (EUR 3.9 bn) of China’s imports from Russia.
- India was the second-largest buyer of Russian fossil fuels this month. Almost 80% of India’s imports (valued at EUR 2.6 bn) comprised crude oil.
- Turkey’s imports were the third highest, comprising 18% (EUR 2.4 bn) of Russia’s total export earnings from the top five importers. Most (46%) of Turkey’s imports from Russia were oil products and 38% seaborne crude oil. CREA and CSD’s recently published investigation suggests that European entities may have imported Russian oil products mixed or re-exported from oil storage terminals in Turkey.
- The EU was the fourth largest buyer of Russian fossil fuels in June, their imports accounting for 12% (EUR 1.6 bn) of the top five purchasers. Pipeline gas comprised the largest share of the EU’s purchases of Russia’s fossil fuels (40%) followed by LNG (38%).
- Brazil bought EUR 613 mn of Russia’s fossil fuel exports, mostly oil products.

- The EU has granted an exemption for Russian crude oil imported through the southern branch of the Druzhba pipeline to Hungary, Slovakia, and the Czech Republic. Russian pipeline gas and LNG also remain unsanctioned.
- In June, the top five largest Russian fossil fuel importing countries in the EU paid Russia EUR 920 mn. Due to the sanctions’ exemptions, Member States can continue buying Russian fossil fuels.
- Slovakia was the largest importer of Russian fossil fuels within the EU, importing fossil fuels worth EUR 282 mn. Imports included crude oil via pipeline valued at EUR 149 mn and gas valued at EUR 82 mn.
- In June, Belgium, Spain, and France exclusively imported LNG. Belgium was the second-largest importer of Russian fossil fuels, at EUR 223 mn, followed by Spain at EUR 182 mn, and France at EUR 151 mn.
- Italy purchased Russian pipeline gas worth EUR 133 mn, making it the fifth-largest buyer in the EU.
How are oil prices changing?

- In June, the average Urals spot price dropped 5% month-on-month but remained significantly above the crude oil price cap, trading at USD 67.93 per barrel.
- The East Siberia Pacific Ocean (ESPO) prices and Sokol blends of Russian crude oil, primarily associated with sales to Asian markets, dropped by 4%.

- In June, the Urals grade crude oil was traded at an average discount of USD 14.04 per barrel compared to Brent crude oil.
- The discounts on the ESPO grade and Sokol blends remained relatively stable and modest at USD 4.26 per barrel and USD 5.59 per barrel, respectively.
- Throughout this period, vessels owned or insured by the G7+ countries continued to load Russian oil in all Russian port regions where average exported crude oil prices remained above the price cap level. These cases call for further investigation by enforcement agencies for breaches of sanctions.
Russia remains highly reliant on the European and G7 shipping industry

- In June 2024, 36% of Russian seaborne crude oil and its products were transported by tankers subject to the oil price cap. The remainder was shipped by ‘shadow’ tankers and was not subject to the oil price cap policy.
- 82% of Russian seaborne crude oil was transported by ‘shadow’ tankers, while tankers owned or insured in countries implementing the price cap accounted for 18%.
- ‘Shadow’ tankers transporting oil products handled 36% of Russia’s total volume of products in June 2024. The remaining volume was shipped by tankers subject to the price cap policy.
- For the first time, the EU has targeted specific vessels contributing to Russia’s warfare against Ukraine, which are subject to a port access ban and a ban on service provision. The EU announced in its 14th sanctions package that it has added 27 new vessels to the sanctions list. CREA is evaluating this policy and its impact on the ability of the 27 tankers to continue transporting Russian oil.
‘Shadow’ tankers pose significant risks to ecology & impact of sanctions

- In June 2024, 289 vessels exported Russian crude oil and oil products, of which 158 were ‘shadow’ tankers, with an average age of 17 years. The oldest of these ‘shadow’ tankers was 37 years old, and 30% of these vessels were at least 20 years old.
- Older ‘shadow’ tankers transporting Russian oil and petroleum products across EU Member States’ Exclusive Economic Zones, Territorial Waters, or various maritime straits raise environmental and financial concerns due to their questionable insurance coverage. Their coverage potentially lacks sufficient Protection & Indemnity (P&I) insurance to cover the cost in the event of an oil spill or catastrophe. In case of accidents, EU coastal countries may bear the financial brunt of the cleanup, not to mention the repercussions of damage to their marine ecology.
- The cost of cleaning up and compensation resulting from an oil spill from tankers with dubious insurance could amount to over one billion euros for the coastal country’s taxpayers.

- In June 2024, Russia’s total crude oil and petroleum product exports, valued at EUR 735 mn, underwent ship-to-ship (STS) transfers in EU waters.
- 63% of these transfers were facilitated by tankers covered by G7+ insurance. STS transfers of Russian oil severely undermine sanctions by allowing Russia to evade sanctions and price caps by splitting the cargo to multiple buyers and mixing lower-priced Russian oil with non-Russian oil.
- ‘Shadow’ tankers, with an average age of 17, conducted ship-to-ship transfers totaling EUR 269 mn in EU waters.
How can Ukraine’s allies tighten the screws?
Russia’s fossil fuel export revenues have fallen since the sanctions were implemented, subsequently constricting Putin’s ability to fund the war. However, much more should be done to limit Russia’s export earnings and constrict the Kremlin’s war chest. This includes lowering the oil price cap, increasing monitoring and enforcement of sanctions, and banning unsanctioned fossil fuels such as LNG and pipeline fuels that are legally allowed into the EU.

- A lower price cap of USD 30 per barrel (still well above Russia’s production cost that averages USD 15 per barrel) would have slashed Russia’s revenue by EUR 58 bn (25%) since the sanctions were imposed in December 2022 until the end of June 2024. A USD 30 per barrel price cap would have slashed Russian revenues by EUR 3.23 bn (25%) in June alone.
- Lowering the price cap would be deflationary, reducing Russia’s oil export prices and inducing more production from Russia to make up for the otherwise drop in revenue.
- Since introducing sanctions until the end of June 2024, thorough enforcement of the price cap would have slashed Russia’s revenues by 8% (EUR 19.52 bn). In June 2024 alone, full enforcement of the price cap would have slashed revenues by 10% (approximately EUR 1 bn).
- Sanctioning countries must prevent Russia’s growth in ‘shadow’ tankers immune to the oil price cap policy. Sanction-imposing countries should ban the sale of old tankers to owners registered in countries that do not implement the oil price cap policy. This would help limit the increase of ‘shadow’ tankers observed since Russia invaded Ukraine.
- Russia’s reliance on tankers that are owned or insured in G7+ countries provide the Price Cap Coalition with adequate leverage to lower the price cap and implement better monitoring and enforcement, which would considerably lower Russia’s oil export revenues.
- G7+ countries must plug the refining loophole by banning the importation of oil products produced from Russian crude oil. This would enhance the impact of the sanctions by disincentivizing third countries from importing large amounts of Russian crude and helping cut Russian export revenues. Banning the imports of oil products from refineries that process Russian crude oil would also lower the price of Russian oil as they would struggle to find buyers or expand their market.
- Enforcement agencies overseeing the sanctions must take proactive measures against violating entities, including insurers registered in price cap coalition countries, shippers, and vessel owners.
- Despite clear evidence of violations, agencies must do more to enforce penalties against shippers, insurers, or vessel owners, and this information must be shared widely in the public domain. Penalties against violating entities increase the perceived risk of being caught and serve as a deterrent.
- Penalties for violating the price cap must be significantly harsher. Current penalties include a 90-day ban on vessels from securing maritime services after violating the price cap, a mere slap on the wrist. If found guilty of violating sanctions, vessels should be fined and banned in perpetuity.
- Sanctions enforcement bodies must continue to sanction ‘shadow’ tankers as doing so hinders Russia’s ability to transport its oil above the price cap. CREA estimates that OFAC’s sanctioning of ‘shadow’ tankers has widened the discount Russia offers buyers of its oil and cut Russia’s crude oil export revenues by 5% (EUR 512 mn per month).
- The lack of proper monitoring and enforcement and rising oil prices have increased Russia’s export revenues to fund its war against Ukraine.
- The G7+ countries should ban STS transfers of Russian oil in EU/G7 waters. STS transfers undertaken by ‘shadow’ tankers pose environmental and financial risks to coastal states and support Russia in logistically exporting high volumes of crude oil. Coastal states should require ‘shadow’ tankers transporting Russian oil through their territorial waters to provide documentation showing adequate maritime insurance. If ‘shadow’ tankers fail to do so, they should be added to the OFAC, OFSI, and European sanctions list. This policy could limit Russia’s ability to transport its oil on ‘shadow’ tankers, exempt from complying with the oil price cap policy.
Relevant reports:
- Ukraine’s road to recovery
- Taiwan’s imports of Russian coal rises despite state-owned Taipower stopping imports
- Quantitative analysis of an EU ban on transshipment of Russian LNG
- What is India’s role in boosting Russia’s war economy?
| Note on methodology Update, 10 October 2023 – We now use Kpler to estimate seaborne exports from Russia and other countries. This change increases our tracker’s estimate of exports from Russia to the world by EUR 77.8 bn (+18% increase) and the exports to the EU by EUR 12.4 bn (+2.8% increase).We have also changed how we receive protection and indemnity (P&I) insurance information about ships to obtain data from known P&I providers directly and from Equasis. This ensures we have recorded the correct start date for a ship’s insurance.Find out more details on the changes in our methodology explained in our article about the migration from automatic identification system (AIS) data providers to the Kpler dataset.Data used for this monthly report is taken as a snapshot at the end of each month. Data on trades and shipments of oil are revised and verified by the data provider through the month. We subsequently update this verified data each month to ensure accuracy. This might mean that figures for the previous month change in our updated subsequent monthly reports. For consistency we do not amend the previous month’s report, and instead treat the latest one as the most accurate data for revenues and volumes. |