Despite a surge in pipeline gas demand, Russian export revenues continue downward spiral to end the year
By Isaac Levi, Europe-Russia Policy & Energy Analysis Team Lead; Petras Katinas, Energy Analyst; Panda Rushwood, Data Scientist; and Vaibhav Raghunandan, Europe-Russia Analyst and Research Writer
Key findings
- Russia’s monthly fossil fuel export revenues fell by 8% (EUR 58 mn per day) compared to November. Russia’s revenues from fossil fuel exports have been falling steadily since September 2023.
- Belgium’s import volumes of Russian LNG rose 57% in December, a rise that can be attributed to a concurrent rise in Belgian exports (+248%), and gas consumption (+10%). In the same period, Belgium’s LNG exports to Germany rose 10%.
- India’s monthly crude oil imports from Russia declined by 11%. This drop may have been due to ongoing payment challenges and sanctions of shipments in November.
- Bulgaria’s import volumes of Russian crude oil saw a 32% month-on-month increase as they are approaching the end of their exemption to the EU import ban.
- 64% of Russian crude oil was shipped by ‘shadow’ tankers, whereas tankers owned or insured in countries which implement the price cap policy transported 35% in December. ‘Shadow’ tankers, responsible for transporting oil products, chemicals, and liquefied petroleum gas (LPG), handled 38% of the total volume, while the rest were transported by tankers subject to the price cap policy.
- Houthi attacks in Red Sea shipping channels did not impede Russian oil tankers. In December, there was a 3% month-on-month increase in the number of Russian tankers crossing the Suez Canal.
- A price cap set at USD 30 per barrel would have significantly impacted Russia’s revenue, reducing earnings by EUR 37 bn (25%) from when sanctions were imposed in December 2022 until the end of December 2023.
- Considering the entire period of sanctions enforcement until the end of December, strict adherence to the price cap would have led to a 9% reduction in Russia’s revenues, amounting to EUR 13.06 bn.

Trends in total revenue
- Russia’s monthly fossil fuel export revenues saw a month-on-month drop of 8% (EUR 58 mn per day) in December.
- Monthly revenues from pipeline crude dropped by 7% (EUR 5 mn per day) and revenues from seaborne crude oil decreased by 10% (EUR 20 mn per day).
- There was a month-on-month drop of 17% (EUR 36 mn per day) in seaborne oil products.
- Russia’s revenues from LNG exports decreased by 3% (EUR 1.4 mn per day). At the same time, export revenues from fossil gas via pipeline increased by 23% (21 mn per day).
- Russian revenues from coal exports fell by 31% (EUR 15 mn per day).

- Russia’s seaborne oil export revenues declined by 14% (EUR 56 mn per day) in December. There was a month-on-month drop in seaborne crude oil export earnings of 10% (EUR 20 mn per day).
- December saw a 34% (EUR 25 mn per day) decrease in earnings from fuel oil and slurry.
- Russia’s export earnings from gasoil and diesel marginally increased by 2% (EUR 2 mn per day) in December.
- Export revenues from gasoline, kerosene, and naphtha decreased by 28% (EUR 13 mn per day).
Who is buying Russia’s fossil fuels?

- Coal: China has imported 40% of all Russian coal exports since 5 December 2022. They are followed by India (20%) and South Korea (13%).
- Crude oil: China is the largest buyer of Russian crude oil, purchasing 45%, followed by India (33%), the EU (7%) and Turkey (5%). Since the EU’s ban on crude oil from Russia on 5 December 2022, the EU’s imports of crude oil have arrived via sea to Bulgaria and via pipeline for the Czech Republic, Slovakia and Hungary.
- LNG: The EU was the largest buyer, purchasing 49% of Russia’s LNG exports, followed by China (22%) and Japan (18%). No sanctions are imposed on Russian LNG shipments to the EU.
- LPG: Turkey was the largest buyer, purchasing 55% of Russia’s LPG exports, followed by the EU (34%). The EU 12th sanctions package includes a prohibition on the import of Russian LPG, with a provision for grandfathering existing contracts for a maximum period of 12 months.
- Oil products: Turkey, the largest buyer, has purchased 24% of Russia’s oil products, followed by China (12%) and Brazil (10%). While the EU’s sanctions on seaborne Russian oil products were implemented on 5 February 2023, oil via pipeline is only partially sanctioned.
- Pipeline gas: The EU was the largest buyer, purchasing 37% of Russia’s pipeline gas, followed by Turkey (34%) and China (24%). No sanctions are imposed on Russian pipeline gas imports into the EU.

- Accounting for 33% (EUR 5.1 bn) of total imports, China was the largest importer of Russian fossil fuels in December. Turkey recorded the second highest imports, accounting for 25% (EUR 3.9 bn), while India was third with an 18% (EUR 2.8 bn) import share. The EU and Brazil contributed 18% (EUR 2.7 bn) and 6% (EUR 0.9 bn) to Russian fossil fuel exports, respectively.
- 75% (EUR 3.9 bn) of China’s total imports consisted of crude oil. Oil products, pipeline gas and coal comprised 9% (EUR 0.5 bn), 7% (EUR 0.47 bn) and 6% (EUR 0.35 bn), respectively.
- In December, China’s imports of Russian crude oil increased through different channels. Specifically, there was a 9% month-on-month increase in overall imports of Russian crude oil, a 15% increase in seaborne imports, and a 3% increase in pipeline imports. The primary product imported from Russia is ESPO grade.
- The quantity of Russian oil products entering China saw a substantial increase of 32%.
- Imports of natural gas from Russia to China have risen by 3% month-on-month. Gazprom reported that a new daily record for gas shipments was achieved in December.
- Turkey’s total imports from Russia consisted of oil products (31% worth EUR 1.2 bn), crude oil (20% worth EUR 0.8 bn), pipeline gas (44% worth EUR 1.7 bn) and coal (4% worth EUR 0.15 bn).
- While there was a modest 2% decrease in Turkey’s total imports of petroleum products in December, their imports from Russia decreased 10%. There were, however, notable increases in crude oil imports from Russia and a second unspecified source. Turkey’s crude oil imports from Russia surged 17%, while imports worldwide increased 27%.
- Turkey is constantly expanding its natural gas imports from Russia, with December seeing a notable 68% increase. This upsurge is closely tied to a seasonal rise of 27% in natural gas consumption.
- Crude oil accounted for 87% (EUR 2.5 bn) of India’s total fossil fuel imports from Russia. Oil products accounted for 8% (EUR 0.2 bn), and coal accounted for 5% (EUR 0.1 bn) of their total imports in December.
- While India’s monthly total crude oil imports remained consistent with November, imports from Russia declined by 11%. This drop in imports may have been due to ongoing payment challenges and sanctions of shipments in November.
- In December, all of Brazil’s imports of Russian fossil fuels consisted of oil products. Oil imports from Russia saw a 16% month-on-month surge, mirroring the rise in volume of total oil imports for the month. Russia’s contribution to Brazil’s oil imports rose through the year, escalating from 13% in January to 40% and staying at the same level in December. Brazil imports diesel and naphtha from Russia.
Note: CREA’s pipeline gas import data reflects physical flows of gas in the transmission system rather than contracted flows. It is possible for a country to physically import from Russia while not paying Russian suppliers for the gas and vice versa. We are reviewing the situation in Bulgaria after the long-term contract between ‘Bulgargaz’ and ‘Gazprom JPC’ expired and was not renewed to see whether gas reported as entering Bulgaria from Russia in the data was passing through the country in transit or being consumed domestically.
- Landlocked Central and Eastern European countries, as well as some Southern European countries received Russian fossil gas via pipeline through Ukraine and TurkStream in December 2023. Crude oil was obtained via the Druzhba oil pipeline. The EU has not banned fossil gas and crude oil via pipelines.
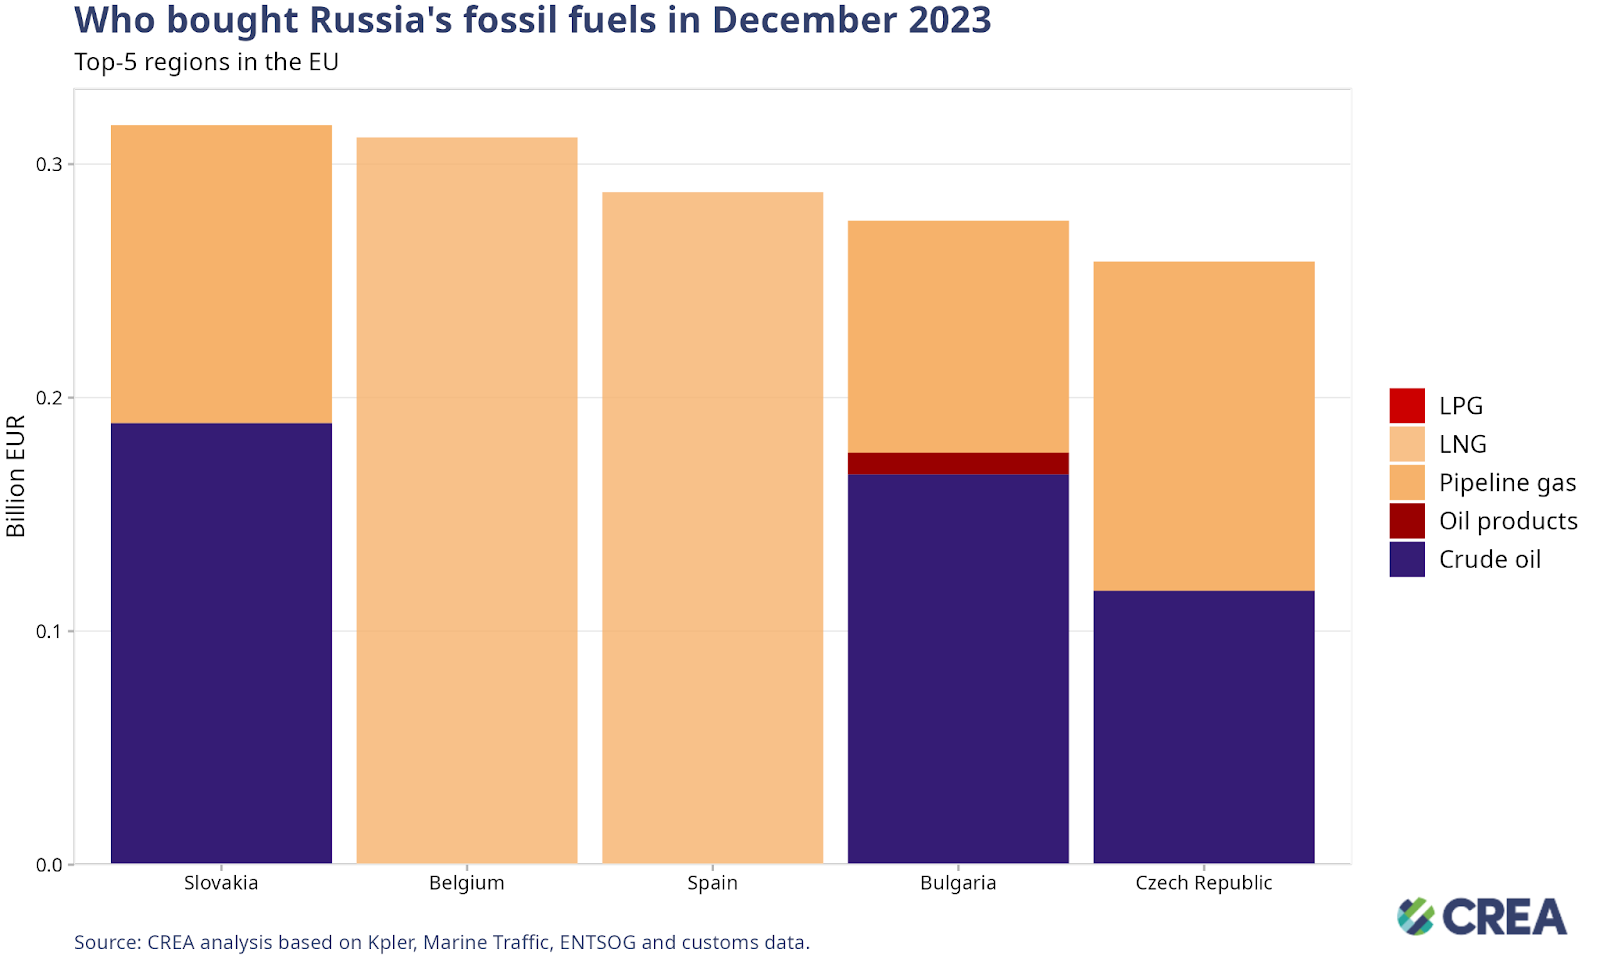
- Slovakia was the largest importer of Russian fossil fuels within the EU in December, importing fossil fuels valued at EUR 316 mn from Russia. Imports comprised crude oil and gas, delivered via pipelines, valued at EUR 189 mn and EUR 127 mn, respectively. Imported fossil gas volumes experienced a notable 20% month-on-month increase. This upswing can be attributed to a concurrent 34% surge in domestic consumption. Furthermore, there were increased imports to Austria (21%), and a substantial 83% increase in imports to the Czech Republic.
- Belgium was the second largest importer of Russian fossil fuels within the EU in December, mainly importing Russian LNG and oil products valued at EUR 311 mn and EUR 0.15 mn respectively. Belgium’s month-on-month LNG imports from Russia rose 57%, and was a significant reason for the 72% rise of their total LNG imports in December. The substantial growth can be attributed to various factors, including a remarkable upswing in re-exports — soaring by 248%. Furthermore, there was a 10% uptick in LNG re-exports to Germany, and an additional 10% boost in seasonal gas consumption.
- Spain imported EUR 288 mn worth of LNG from Russia in December. Despite logging a modest 2% overall increase in monthly LNG imports, Spain’s import volumes of Russian LNG surged by 41%. This increase can be attributed to increased natural gas consumption, which grew by a significant 15%. Enagaz data reveals that the primary contributors to this surge were conventional consumption, — a notable increase of 19% — and electricity generation, which rose by 9%.
- Having been exempted from the ban on Russian oil imports, Bulgaria imported EUR 167 mn worth of crude oil, EUR 9 mn of oil products and EUR 99 mn worth of gas via pipeline in December. Bulgaria’s import volumes of crude oil saw a 65% month-on-month increase. Imports from Russia, specifically, rose by 32% as they are approaching the end of their exemption to the EU import ban on Russian crude. This noteworthy surge can be partly attributed to a simultaneous 24% increase in their export of oil products.
- The Czech Republic was the EU’s fifth-largest importer of Russian fossil fuels in December, importing EUR 117 mn worth of crude oil and EUR 140 mn of pipeline gas.

- The port of Yarimca-Izmit in Turkey was the foremost destination for Russian fossil fuels in December. The port imported EUR 373 mn worth of Russian fossil fuels of which 54% (EUR 203 mn) was crude oil and 46% (EUR 170 mn) was oil products. The port imported 1.22 mn tonnes of fossil fuel imports in December, of which 81% (0.98 mn tonnes) was of Russian origin. Seventy nine percent (0.72 mn tonnes) of Yarimca-Izmit’s imports of crude oil in December came from Russia, and 87% (0.26 mn tonnes) of their total imports of oil products were from Russia.
- China’s port of Dongjiakou was the second highest importer of Russian fossil fuels (EUR 334 mn), of which 91% (EUR 329 mn) was crude oil. Dongjiakou imported 2.6 mn tonnes of fossil fuels in December of which 24% (0.63 mn tonnes) came from Russia. There was a 41% (0.44 mn tonnes) month-month decrease in their imports of fossil fuels from Russia. Twenty four percent (0.59 mn tonnes) of their total crude oil imports were from Russia.
- The port of Mersin in Turkey was the third highest importer of Russian fossil fuels (EUR 347 mn). Only Russian oil products were imported through this port. China’s port of Dongying was the fourth largest importer of Russian fossil fuels. Crude oil comprised 91% of the port’s Russian fossil fuel imports in December.
- Zeebrugge in Belgium was the fifth largest port importing Russian fossil fuels in December. The port’s imports from Russia consisted entirely of LNG. Over half of Zeebrugge’s total imports of LNG in December (1.12 mn tonnes) was from Russia (0.62 mn tonnes).
How are oil prices changing?

- In December, the average Urals Europe cost and freight (CFR) spot price was USD 59.8 per barrel, decreasing by 11% compared to November.
- The prices for the East Siberia Pacific Ocean (ESPO) and Sokol blends, primarily associated with Asian markets, fell by 7% in December. The average price for ESPO was USD 73.37 per barrel in December.
- Urals prices fluctuated around the specified price cap level (60 USD) for the entire month and ESPO prices remained far above the price cap for the entire month.
- Throughout this period, vessels owned or insured by G7 and European countries persisted in loading Russian oil at all port regions within Russia. These occurrences serve as compelling evidence of violations of the price cap policy.
Russia remains highly reliant on European and G7 shipping industry

- In December, 46% of Russian oil and its products were transported by tankers subject to the oil price cap. The remainder was shipped by ‘shadow’ tankers that are not subject to the price cap policy.
- 64% of Russian crude oil was transported by ‘shadow’ tankers, while tankers owned or insured in countries implementing the price cap accounted for 36%.
- ‘Shadow’ tankers transporting oil products, chemicals, and LPG handled 38% of the total volume of products. The remaining volume was shipped by tankers subject to the price cap policy.
- Tankers in the Pacific region were loaded with Russian oil at ports like Kozmino in Russia, where the ESPO pipeline ends and is connected to a refinery. Here, the ESPO crude oil grade is exported at prices that exceed the cap, as has been observed in customs data.
- Russia’s reliance on EU/G7 owned or insured vessels provides the Price Cap Coalition with adequate leverage to lower the price cap, implement better monitoring and enforcement that would considerably lower Russia’s oil export revenues.
- Houthi rebels in Yemen have been targeting shipping channels in the Red Sea — adding to the current conflict in the Middle East — leading to a 3% reduction in global ship traffic through the Suez Canal. Conversely, the number of ships from Russia in December rose by 3% compared to November.
How can Ukraine’s allies tighten the screws?

- Russia’s fossil fuel export revenues have fallen since sanctions were implemented, showing the impact they have had on lowering Putin’s ability to fund the war. However, much more should be done to limit Russia’s export earnings and constrict the Kremlin’s war chest. This includes measures like lowering the oil price cap, increased monitoring and enforcement of sanctions and banning unsanctioned fossil fuels such as LNG and pipeline fuels that are legally allowed into the EU.
- Measures must be taken by sanctioning countries to prevent Russia’s growth in ‘shadow’ tankers that are immune to the oil price cap policy. Sanction imposing countries should ban the sale of old tankers to owners that are registered in countries that do not implement the oil price cap policy. This would help limit the growth of the ‘shadow’ tankers that we have been observing since Russia’s invasion of Ukraine.

- A price cap of USD 30 per barrel (still well above Russia’s production cost that averages USD 15 per barrel) would have slashed Russia’s revenue by EUR 37 bn (25%) since the sanctions were imposed in December 2022 until the end of December 2023. This month alone would have seen a reduction of EUR 2.65 bn or 24 % with a USD 30 per barrel price cap.
- Lowering the price cap would be deflationary, reducing Russia’s oil export prices and inducing more production from Russia to make up for the drop in revenue.
- Since the introduction of sanctions until the end of December, thorough enforcement of the price cap would have slashed Russia’s revenues by 9% (EUR 13.06 bn). In December alone, full enforcement of the price cap would have slashed revenues by 6% (approximately EUR 0.7 bn).
- Enforcement agencies overseeing the sanctions must take proactive measures against violating entities, including insurers registered in price cap coalition countries, shippers and vessel owners.
- Despite clear evidence of violation, there is very little information on enforcement agencies implementing penalties against shippers, insurers or vessel owners in the public domain. Penalties against violating entities increase the perceived risk of being caught.
- The Office of Foreign Assets Control (OFAC) should continue to sanction vessels that look to have violated the price cap policy. Other enforcement agencies, such as the Office of Financial Sanctions Implementation (OSFI), should ramp up investigations of entities that appear to have violated sanctions.
- Penalties for those found guilty of violating the price cap must be significantly harsher. Current penalties include a 90-day ban of vessels from securing maritime services after violating the price cap, a mere slap on the wrist. Vessels should be fined and banned in perpetuity if they are found guilty of violating sanctions.
- The lack of proper monitoring and enforcement and rising oil prices have increased Russia’s export revenues to fund its war against Ukraine.
Relevant reports:
- Russia’s shadow trade hit by stronger sanctions enforcement
- Gas infrastructure investments continue to rise despite transition
- Oil drilling boom proves Russia’s resilience to sanctions
- Bulgaria replacing Russian crude with oil from Kazakhstan, Iraq, Tunisia.
- One year of sanctions: Russia’s oil export revenues cut by EUR 34 bn
| The monthly update on Russian fossil fuel exports and sanctions was prepared by Isaac Levi, Europe-Russia Policy & Energy Analysis Team Lead, CREA; Petras Katinas, Energy Analyst; Panda Rushwood, Data Scientist; and Vaibhav Raghunandan, Europe-Russia Analyst and Research Writer. |
| Note on methodology: Update 2023-10-19 – We now use Kpler to estimate seaborne exports from Russia and other countries. This change increases our tracker’s estimate of exports from Russia to the world by EUR 77.8 bn (+18% increase) and the exports to the EU by EUR 12.4 bn (+2.8% increase). We have also changed how we receive protection and indemnity (P&I) insurance information about ships to additionally attain data from known P&I providers directly as well as from Equasis. This is to make sure that we have recorded the correct start date for a ship’s insurance. Find out more details on the changes in our methodology that are explained in our article about the migration from automatic identification system (AIS) data providers to the Kpler dataset. |