Russian export revenues dropped to lowest figures since July, despite an upsurge in LNG and pipeline gas
By Isaac Levi, Europe-Russia Policy & Energy Analysis Team Lead; Petras Katinas, Energy Analyst; Panda Rushwood, Data Scientist; and Vaibhav Raghunandan, Europe-Russia Analyst and Research Writer
Key findings
- Russia’s fossil fuel export revenues fell by 7% (EUR 51 mn per day) month-on-month in November 2023, the lowest since July 2023.
- Storms in the Black Sea basin saw Russia’s seaborne oil export revenues decline by 12% (EUR 55 mn per day).
- Revenues from liquefied natural gas (LNG) exports increased by 5% (EUR 2.5 mn per day) month-on-month, while exports from fossil gas via pipeline increased by 25% (18 mn per day).
- France imported LNG worth EUR 316 mn from Russia. Fueled by the start of the heating season, France’s natural gas consumption rose by 79% in November compared to the prior month. This led to an 11% month-on-month increase in LNG imports. Imports from Russia surged by a disproportionate 137%, with 57% of these imports transshipped at the Montoir LNG terminal before reaching final destinations.
- Turkey’s month-on-month imports of pipelined Russian gas increased 68% (EUR 457 mn) in November due to increased gas consumption.
- Enforcing the price cap on Russia’s oil exports would have led to a 14% reduction in oil export revenues (approximately EUR 1.6 bn) in November alone. Since the implementation of sanctions in December 2022 to the end of November 2023, strict adherence to the price cap would have resulted in a 12% reduction in Russia’s revenues, totalling EUR 16.7 bn.
- A price cap of USD 30 per barrel would have slashed Russia’s revenues by EUR 4.9 bn or 41% in November 2023 alone. If this price cap had been established in December 2022 and paired with full enforcement, when the sanctions were originally implemented, Russia’s income would have been reduced by 40% (EUR 56 bn).
- 65% of Russian crude oil was shipped by “shadow” tankers, whereas tankers owned or insured in countries which implement the price cap policy transported 35%. “Shadow” tankers, responsible for transporting oil products, chemicals, and liquefied petroleum gas (LPG), handled 38% of the total volume, while the rest were transported by tankers subject to the price cap policy.

Trends in total revenue
- Russia’s month-on-month fossil fuel export revenues fell by 7% (EUR 51 mn per day).
- Monthly revenues from pipeline crude dropped by 5% (EUR 5 mn per day). While revenues from seaborne crude oil decreased by 21% (EUR 52 mn per day).
- Seaborne oil products saw a 2% drop (EUR 3 mn per day).
- Revenues from LNG exports increased by 5% (EUR 2.5 mn per day), while exports from fossil gas via pipeline increased by 25% (18 mn per day).
- Revenues from coal exports fell by 17% (EUR 9 mn per day) in November.
- Monthly revenue from LPG fell by 82% (EUR 2.8 mn per day).
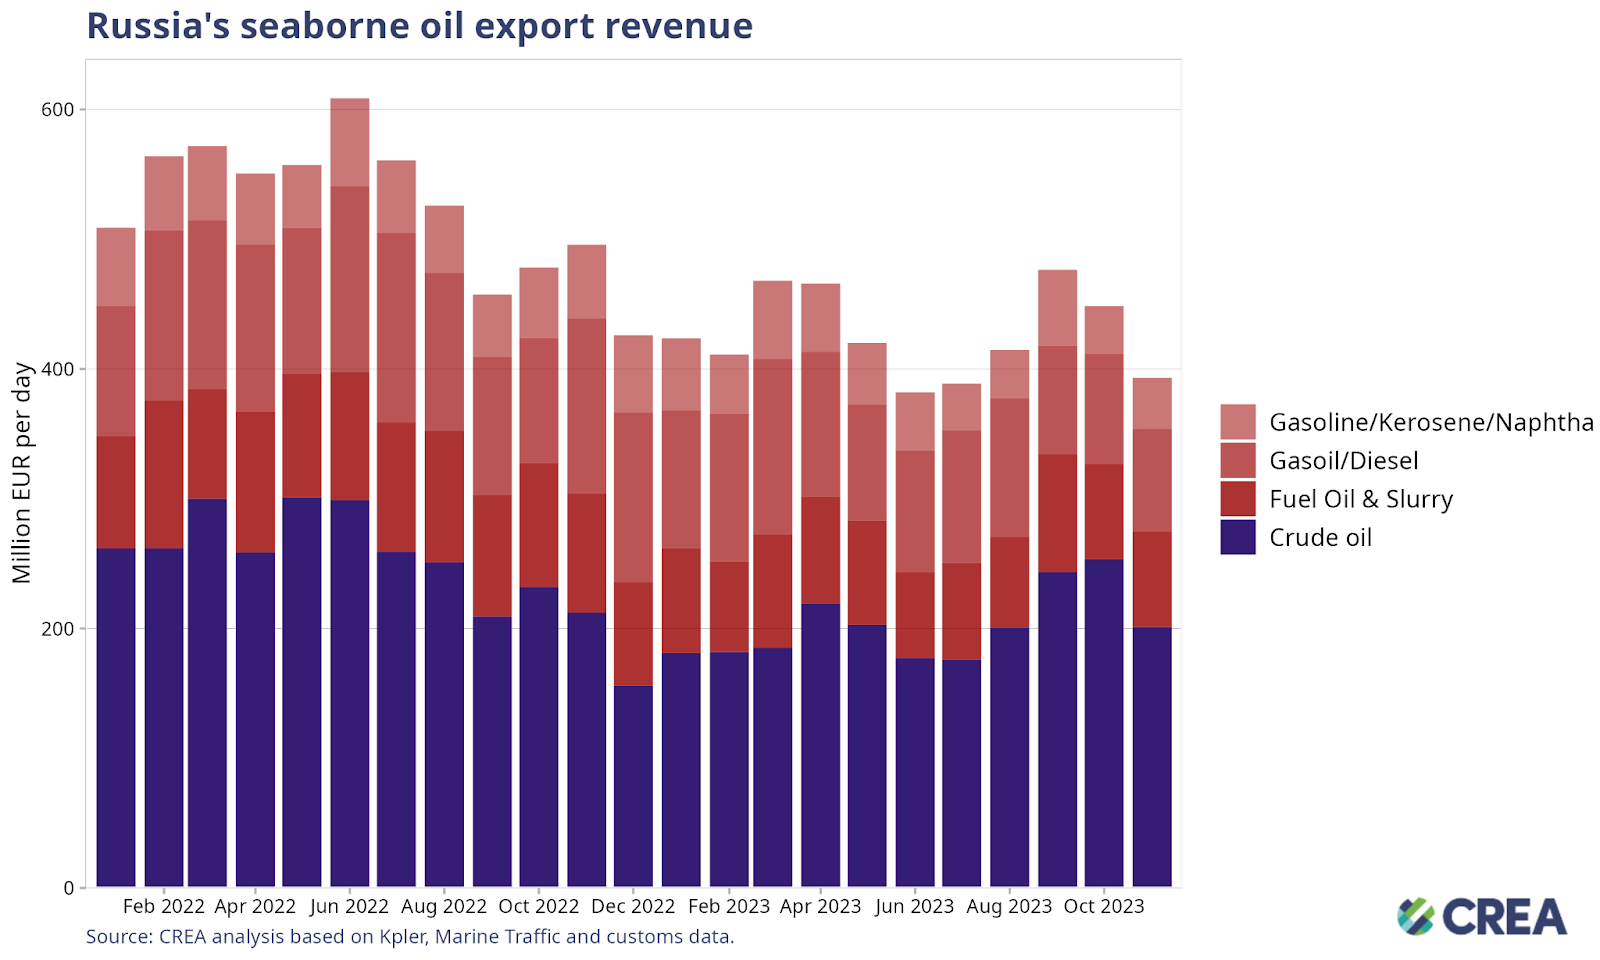
- Russia’s seaborne oil export revenues declined by 12% (EUR 55 mn per day) in November. The decrease in seaborne crude oil and petroleum product exports is linked to the November storm in the Black Sea basin which disrupted shipments and loading activities. In November, month-on-month oil exports from Russian ports in the Black Sea experienced a 21% decline — the lowest this year.
- Monthly seaborne crude oil export earnings decreased by 21% (EUR 52 mn per day) in November.
- There was a marginal 0.4% (EUR 0.3 mn per day) month-on-month increase in earnings from fuel oil and slurry.
- Russia’s export earnings from gasoil and diesel dropped by 7% (EUR 6 mn per day) in November.
- Export revenues from gasoline, kerosene, and naphtha increased by 7% (2.4 mn per day).
Who is buying Russia’s fossil fuels?
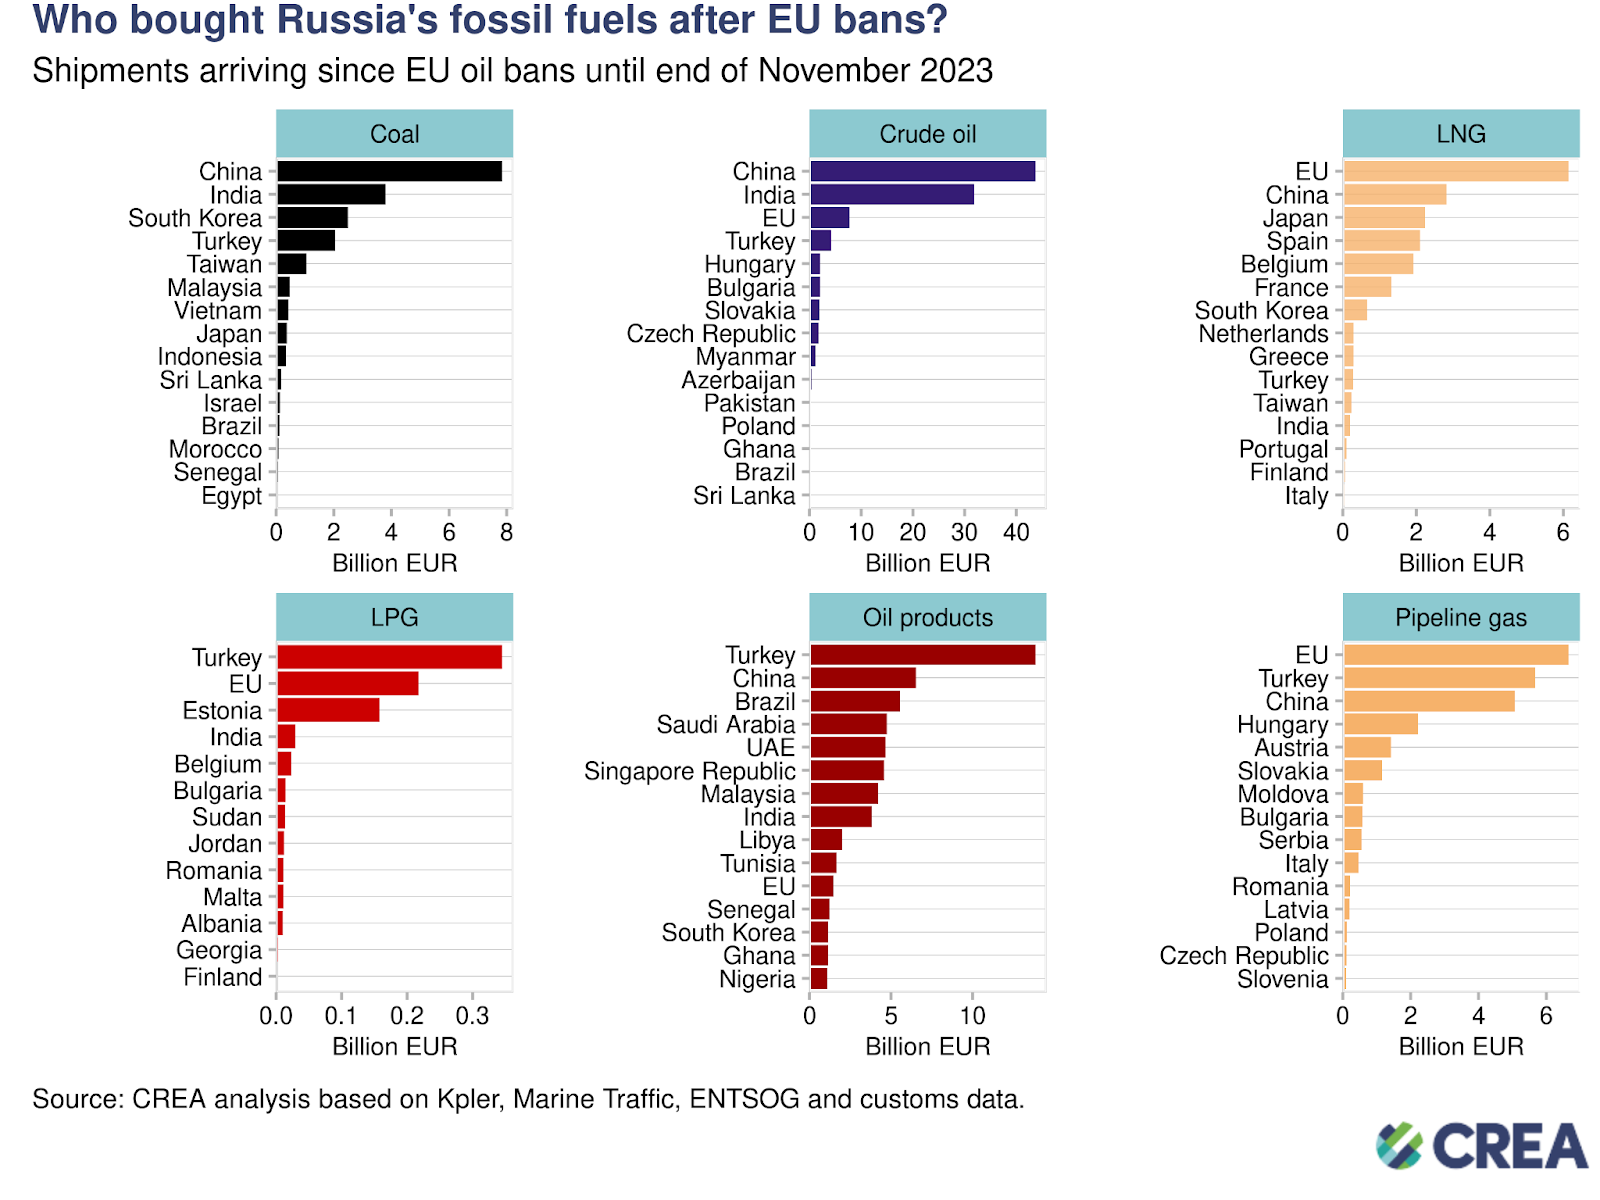
- Coal: China has imported 40% of all Russian coal exports since the EU’s ban on 5 December 2022. They were followed by India (20%) and South Korea (13%).
- Crude oil: China was the largest crude oil buyer, purchasing 45% of Russia’s crude oil, followed by India (32%), the EU (8%) and Turkey (4%). Since 5 December 2022, EU imports of crude oil have arrived via sea to Bulgaria and via pipeline for the Czech Republic, Slovakia and Hungary.
- LNG: The EU was the largest LNG buyer, purchasing 49% of Russia’s LNG exports, followed by China (23%) and Japan (18%). No sanctions are imposed on Russian LNG shipments to the EU.
- LPG: Turkey was the largest LPG buyer, purchasing 55% of Russia’s LPG exports, followed by the EU (35%). No sanctions are imposed by the EU on LPG imports from Russia.
- Oil products: Since the EU’s import ban on Russian crude oil, Turkey is the largest buyer purchasing 24% of Russia’s oil products, followed by China at 12%. While the EU’s sanctions on seaborne Russian oil products were implemented on 5 February 2023, oil via pipeline is only partially sanctioned. 1
- Pipeline gas: The EU was the largest buyer, purchasing 36% of Russia’s pipeline gas, followed by Turkey (31%) and China (28%). No sanctions are imposed on Russian pipeline gas imports into the EU.
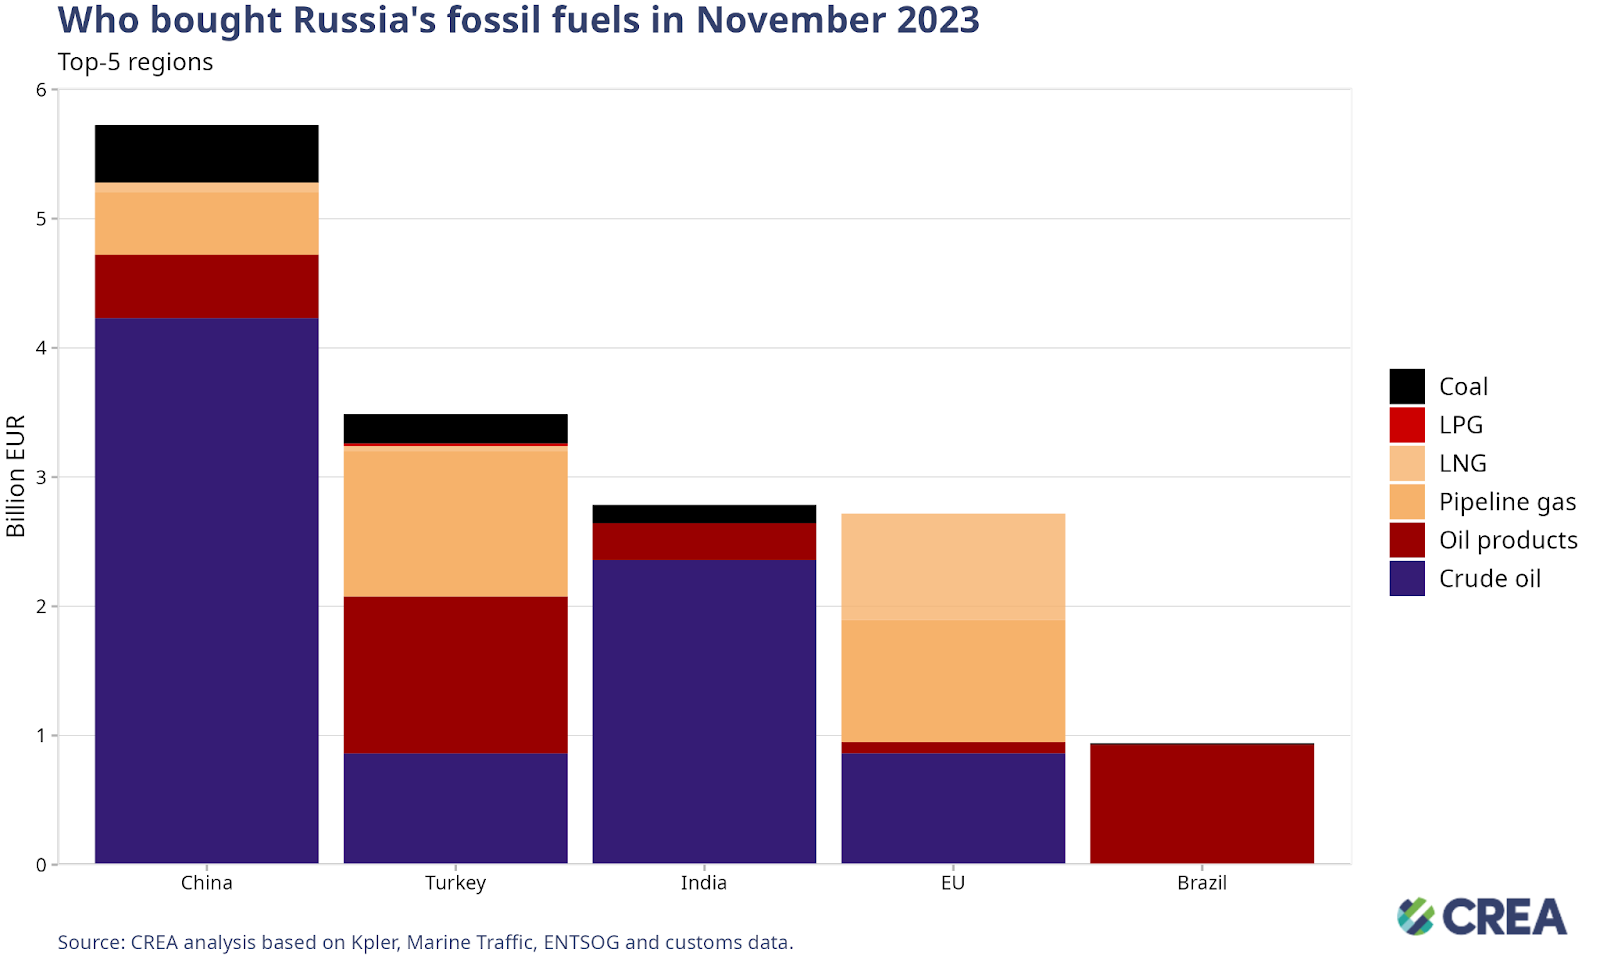
- Accounting for 36% (EUR 5.7 bn) of total imports, China was the biggest importer of Russian fossil fuels in November. In the same month, Turkey was second, accounting for 23% (EUR 3.5 bn), while India fell to third with an 18% (EUR 2.8 bn) import share. The EU and Brazil contributed 17% (EUR 2.7 bn) and 6% (EUR 0.9 bn) to Russian fossil fuel exports, respectively.
- Seventy four percent (EUR 4.2 bn) of China’s total imports consisted of crude oil. Pipeline gas and oil products comprised 9% each — EUR 0.48 bn and EUR 0.49 bn, respectively.
- There was a 5% month-on-month decline in China’s overall seaborne crude oil imports, amounting to 41.1 mn tonnes. Russian seaborne crude oil constituted 11% of China’s total volume of imported crude. 72% of China’s Russian crude oil imports are ESPO grade.
- China’s increased imports of Russian gas can be attributed to recent developments. In October, Gazprom and CNPC extended their gas contract via the Power of Siberia pipeline, facilitating additional supplies until 2023.
- Turkey’s total imports from Russia consisted of oil products, 35% (EUR 1.2 bn) and crude oil, 25% (EUR 0.9 bn), pipeline gas, 32% (EUR 1.1 bn) and coal , 7% (EUR 0.2 bn).
- In November, there was a moderate 2% growth in oil exports to Turkey, reaching 4.7 mn tonnes. Russian oil constituted 74% of Turkey’s total imports. There was a significant 69% month-on-month increase in volume of fossil gas imports from Russia. This can be attributed to seasonal variations, including a 35% surge in gas consumption.
- Crude oil accounted for 85% (EUR 2.4 bn) of India’s total fossil fuel imports from Russia. Oil products accounted for 10% (EUR 0.3 bn), and coal accounted for 5% (EUR 0.1 bn) of their total imports in November.
- In November, India’s total crude oil imports reached 17.7 mn tonnes, reflecting an 11% month-on-month decrease. 31% of India’s total crude oil imports in November came from Russia — the largest share from a single country. 70% of the Russian crude oil imported by India was Urals grade.
- In November, 30% (EUR 0.8 bn) of the EU’s purchases of Russian fossil fuels consisted of LNG. Crude oil accounted for 32% (EUR 0.86 bn), while pipeline gas and oil products made up 35% (EUR 0.95 bn) and 3% (EUR 0.09 bn), respectively.
- 99% (EUR 0.9 bn) of Brazil’s imports of Russian fossil fuels in November consisted of oil products. Brazil’s crude oil and petroleum imports totaled 2.9 mn tonnes in November, a 14% month-on-month increase. 46% of imports, exclusively in petroleum products, came from Russia. Diesel, in particular, represented 75% of the total imports of petroleum products from Russia.

- Landlocked Central and Eastern European and some Southern European countries received Russian fossil gas via pipeline through Ukraine and TurkStream in November 2023. Crude oil was obtained via the Druzhba oil pipeline. The EU has not banned fossil gas and crude oil via pipelines.
- Hungary was the top importer of Russian fossil fuels within the EU in November. There was a 6% month-on-month dip in Russia’s earnings from natural gas exports to Hungary, amounting to EUR 241 mn. Hungary’s 13% decrease in volume of fossil gas imports from Russia could be influenced by tax changes. This decline is posited to be a consequence of Bulgaria’s recent implementation of a fresh tax on Russian gas. Simultaneously, Russia experienced a 5% decline in revenues from oil exports to Hungary in November, totaling EUR 234 mn.
- Slovakia imported fossil fuels valued at EUR 416 mn from Russia in November. Imports comprised crude oil and gas, delivered via pipelines, valued at EUR 289 mn and EUR 126 mn, respectively.
- France imported EUR 316 mn worth of LNG from Russia. Fueled by cold weather, France’s natural gas consumption rose by 79% in November. This led to an 11% month-on-month increase in LNG imports, with a notable 137% rise in imports from Russia. Additionally, 57% of these imports underwent transshipment at Montoir LNG terminal before reaching their final destinations.
- Having been exempted from the ban on Russian imports, Bulgaria imported EUR 171 mn worth of crude oil, EUR 5 mn oil products and EUR 87 mn worth of gas via pipeline2 in November. CREA and the Center for the Study of Democracy’s (CSD) investigation published in December, following an initial investigation published in November, found that all shipments of Russian crude oil to Lukoil Neftochim Burgas refinery in Bulgaria were undertaken above the price cap between August and October 2023. Lukoil has exploited a legal loophole in the sanctions to create additional revenue from the sale of Russian oil within the EU’s borders — adding an extra USD 231 mn in export revenue for the Kremlin between August and October 2023.
- The Czech Republic was the EU’s fifth-largest importer of Russian fossil fuels in November 2023, importing EUR 166 mn worth of crude oil and EUR 73 mn of pipeline gas.
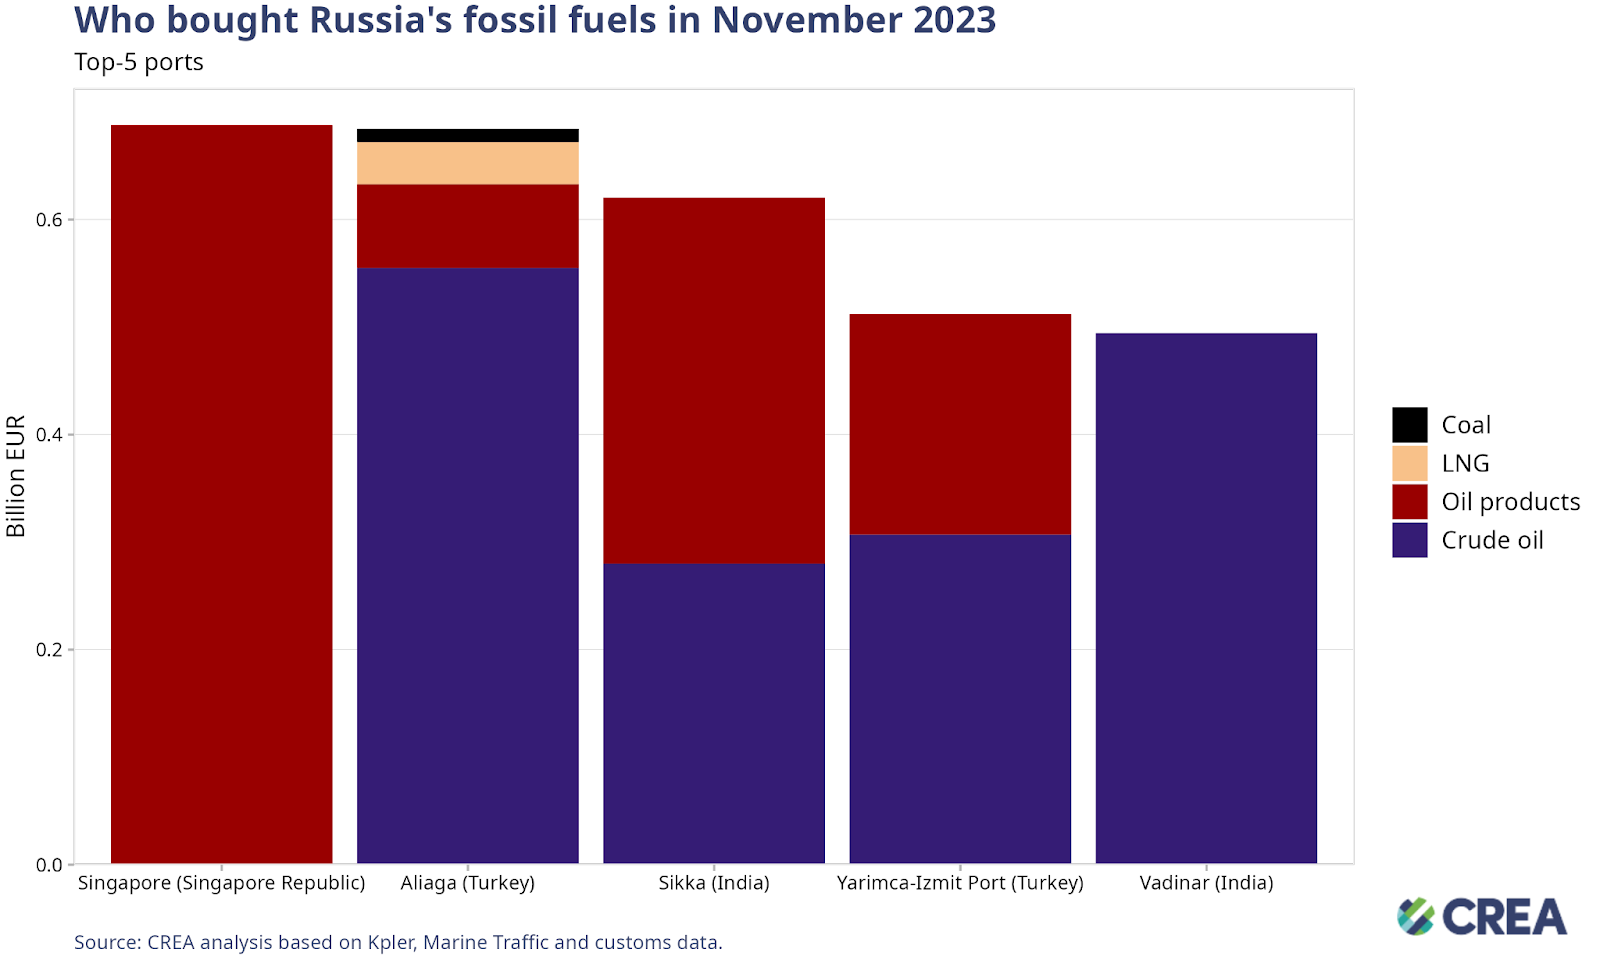
- The port of Singapore was the foremost destination for Russian fossil fuels in November 2023, with a value of EUR 687 mn. Imports from Russia comprised 7% (0.7 mn tonnes) of Singapore’s total fossil fuel imports in November. While logging a marginal decrease from last month, their imports in November were the fourth highest for the year. Singapore’s imports from Russia consisted entirely of oil products (dominated by 0.3 mn tonnes of fuel oil).
- Turkey’s port of Aliaga was the second highest importer of Russian fossil fuels (EUR 684 mn), of which 81% (EUR 555 mn) was crude oil. Of the 1.8 mn tonnes of crude imported by Aliaga in November, 67% (1.2 mn tonnes) came from Russia. 67% (1.3 mn tonnes) of Aliaga’s total fossil fuel imports for the month came from Russia — a month-on-month increase of 10% and the highest for the year.
- The port of Sikka in India was the third highest importer of Russian fossil fuels (EUR 620 mn) in November. Imports from Russia comprised 36% of Sikka’s total imports for November. Sikka imported 5.7 mn tonnes of crude in November, of which 28% (1.6 mn tonnes) came from Russia. 89% of oil products imported into Sikka in November (0.7 mn tonnes) came from Russia.
- 5% of the volume of fossil fuels imported at Yarimca-Izmit in Turkey were from Russia (0.8 mn tonnes valued at EUR 511 mn). Vadinar in India imported (494 mn) worth of fossils from Russia in November. 48% (1.8 mn tonnes) of Vadinar’s imports of fossil fuels in November were from Russia — all of which comprised crude oil.
How are oil prices changing?

- In November, the average Urals Europe cost and freight (CFR) spot price was USD 72.9 per barrel, decreasing by 12% compared with October.
- The prices for the East Siberia Pacific Ocean (ESPO) and Sokol blends, primarily associated with Asian markets, fell by 7% in November. The average price for ESPO was USD 78.5 per barrel.
- These prices consistently remained above the specified price cap level (60 USD) for the entire month.
- Throughout this period, vessels owned or insured by G7 and European countries persisted in loading Russian oil at all port regions within Russia. These occurrences serve as compelling evidence of violations of the price cap policy.
Russia remains highly reliant on European and G7 shipping industry

- In November, 45% of Russian oil and its products were transported by tankers subject to the oil price cap. The remainder was shipped by “shadow” tankers that are not subject to the price cap policy.
- 65% of Russian crude oil was transported by “shadow” tankers, while tankers owned or insured in countries implementing the price cap accounted for 35%.
- “Shadow” tankers transporting oil products, chemicals, and LPG handled 38% of the total volume of products. The remaining volume was shipped by tankers subject to the price cap policy.
- Tankers in the Pacific region were loaded with Russian oil at ports like Kozmino in Russia, where the ESPO pipeline ends and is connected to the refinery. Here, the ESPO crude oil grade is exported at prices that exceed the cap, as has been observed in customs data.
- Russia’s reliance on EU/G7 owned or insured vessels provides the Price Cap Coalition with adequate leverage to lower the price cap, implement better monitoring and enforcement that would considerably lower Russia’s oil export revenues.
How can Ukraine’s allies tighten the screws?

- Fossil fuel exports from Russia have fallen since sanctions were implemented, showing the impact they have had on lowering Putin’s ability to fund the war. However, much more should be done to limit Russia’s export earnings and constrict the Kremlin’s war chest. This includes measures like lowering the oil price cap, increased monitoring and enforcement of sanctions and banning unsanctioned fossil fuels such as LNG, LPG and pipeline fuels that are legally allowed into the EU.
- Measures must be taken by sanctioning countries to prevent Russia’s growth in “shadow” tankers that are immune to the oil price cap policy. Sanction imposing countries should ban the sale of old tankers to owners that are registered in countries that do not implement the oil price cap policy. This would help limit the growth of the “shadow” fleet that we have been observing since Russia’s invasion of Ukraine.
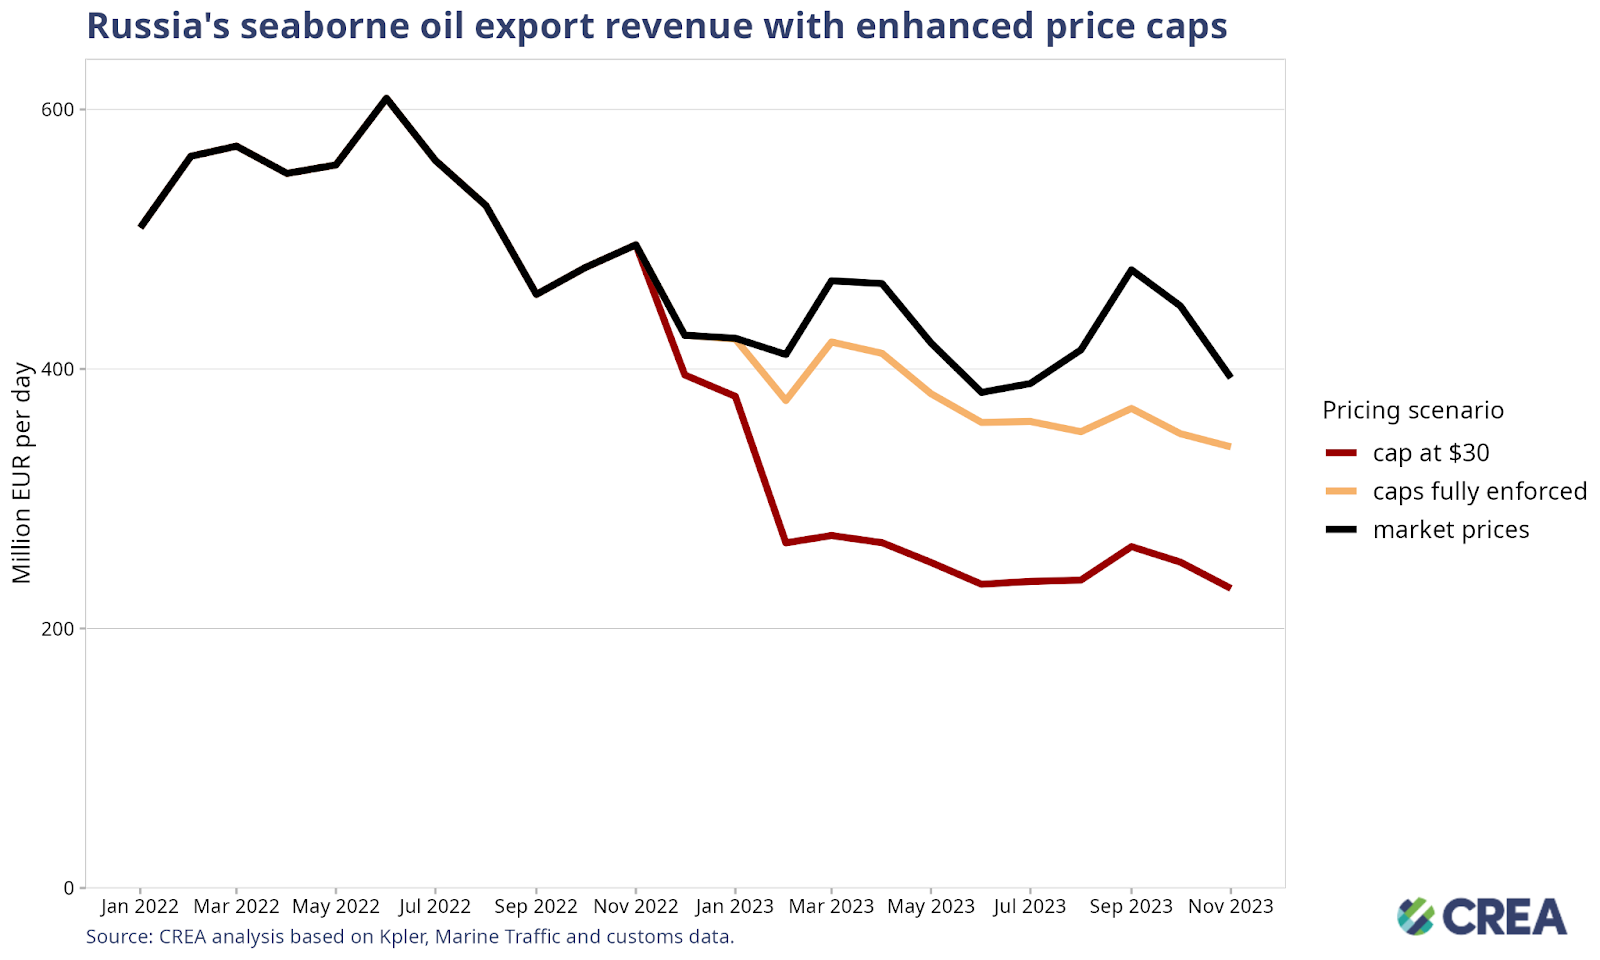
- A price cap of USD 30 per barrel (still well above Russia’s production cost that averages USD 15 per barrel) would have slashed Russia’s revenue by EUR 56 bn (40%) since the sanctions were imposed in December 2022 until the end of November 2023. This month alone would have seen a reduction of EUR 4.9 bn or 41% with a USD 30 per barrel price cap3.
- Lowering the price cap would be deflationary, reducing Russia’s oil export prices and inducing more production from Russia to make up for the drop in revenue.
- Since the introduction of sanctions until the end of November, thorough enforcement of the price cap would have slashed Russia’s revenues by 12% (EUR 16.7 bn). In November alone, full enforcement of the price cap would have slashed revenues by 14% (approximately EUR 1.6 bn).
- Enforcement agencies overseeing the sanctions must take proactive measures against violating entities, including insurers registered in price cap coalition countries, shippers and vessel owners.
- Despite clear evidence of violation, there is very little information on enforcement agencies implementing penalties against shippers, insurers or vessel owners in the public domain. Penalties against violating entities increase the perceived risk of being caught.
- The Office of Foreign Assets Control (OFAC) should continue to sanction vessels that look to have violated the price cap policy. Other enforcement agencies, such as the Office of Financial Sanctions Implementation (OSFI), should ramp up investigations of entities that appear suspicious of sanction violations.
- Penalties for those found guilty of violating the price cap must be significantly harsher. Current penalties include a 90-day ban of vessels from securing maritime services after violating the price cap, a mere slap on the wrist. Vessels should be fined and banned in perpetuity if they are found guilty of violating sanctions.
- The lack of proper monitoring and enforcement and rising oil prices have increased Russia’s export revenues to fund its war against Ukraine.
Relevant reports:
- One year of sanctions: Russia’s oil export revenues cut by EUR 34 bn
- EU’s blind spot for Russian LNG
- How far will OFAC go in sanctioning Russia’s shadow trade?
- How Europe failed to sap Russia’s energy profits
| The monthly update on Russian fossil fuel exports and sanctions was prepared by Isaac Levi, Europe-Russia Policy & Energy Analysis Team Lead, CREA; Petras Katinas, Energy Analyst; Panda Rushwood, Data Scientist; and Vaibhav Raghunandan, Europe-Russia Analyst and Research Writer |
| Note on methodology: Update 2023-10-19 – We now use Kpler to estimate seaborne exports from Russia and other countries. This change increases our tracker’s estimate of exports from Russia to the world by EUR 77.8 bn (+18% increase) and the exports to the EU by EUR 12.4 bn (+2.8% increase). We have also changed how we receive protection and indemnity (P&I) insurance information about ships to additionally attain data from known P&I providers directly as well as from Equasis. This is to make sure that we have recorded the correct start date for a ship’s insurance. Find out more details on the changes in our methodology that are explained in our article about the migration from automatic identification system (AIS) data providers to the Kpler dataset. |
- The EU’s 11th sanctions package bans crude flows via the northern branch of the Druzhba pipeline from Russia to Germany and Poland. Limited volumes of Russian crude continue to flow to the Czech Republic, Slovakia and Hungary via the southern branch of the Druzhba line. ↩︎
- CREA’s pipeline gas import data reflects physical flows of gas in the transmission system rather than contracted flows. It is possible for a country to physically import from Russia while not paying Russian suppliers for the gas and vice versa. We are reviewing the situation in Bulgaria after the long-term contract between “Bulgargaz” and “Gazprom JPC” expired and was not renewed to see whether gas reported as entering Bulgaria from Russia in the data was passing through the country in transit or being consumed domestically.2 ↩︎
- Our estimates are lower than those in October due to upgrades to our pricing model and changes in Kpler’s categorisation of some trades. ↩︎