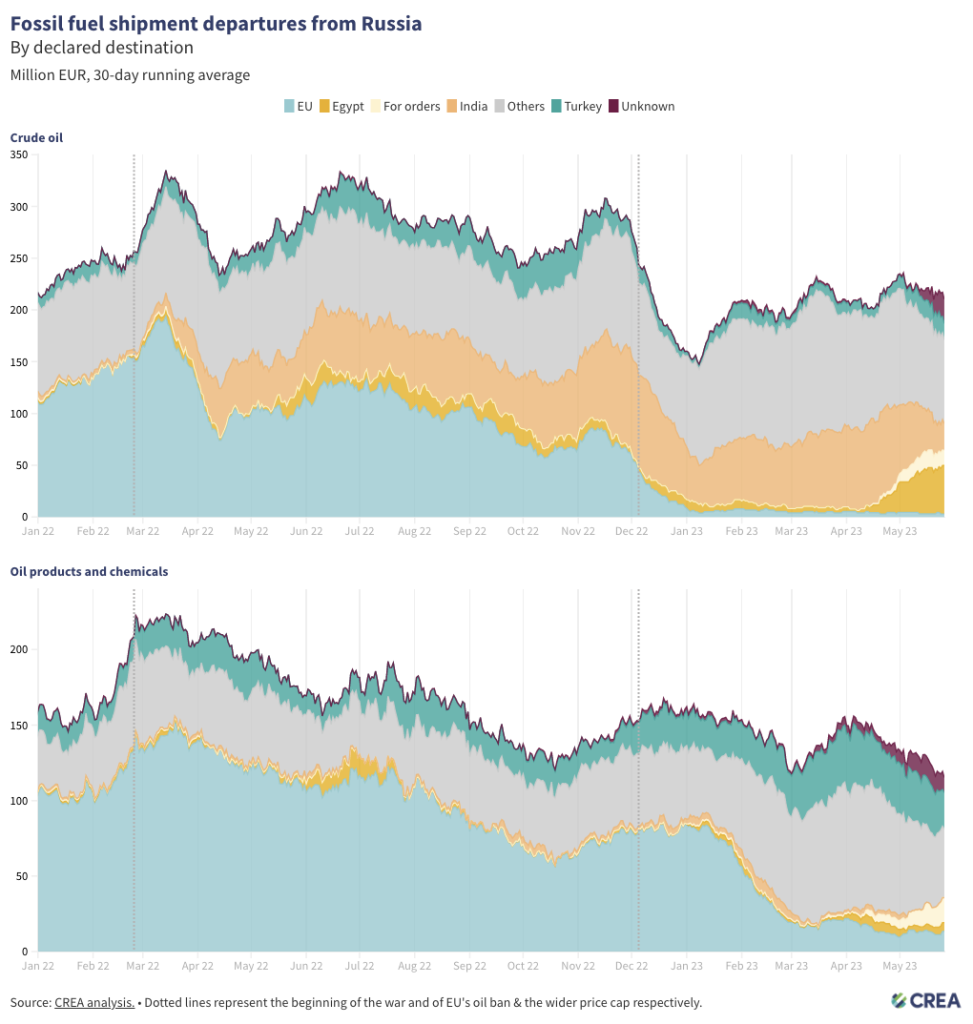
Russian crude and oil products&chemicals revenues remain high but have fallen from the beginning of May, as oil product export volumes continued to slide while prices and volumes for crude remained stable, close to but below the price cap level of USD 60 per barrel.
The amount of crude and oil products loaded on water continues to drop in the most recent week compared to the beginning of May, shipments to China fell compared to early May. The volume of outgoing crude oil and oil products&chemicals shipments has fallen in recent weeks, indicating falling export revenues. The amount of LNG on water remains high but slows from the prior week when the highest level since the start of the invasion was reached, signalling an ongoing glut.
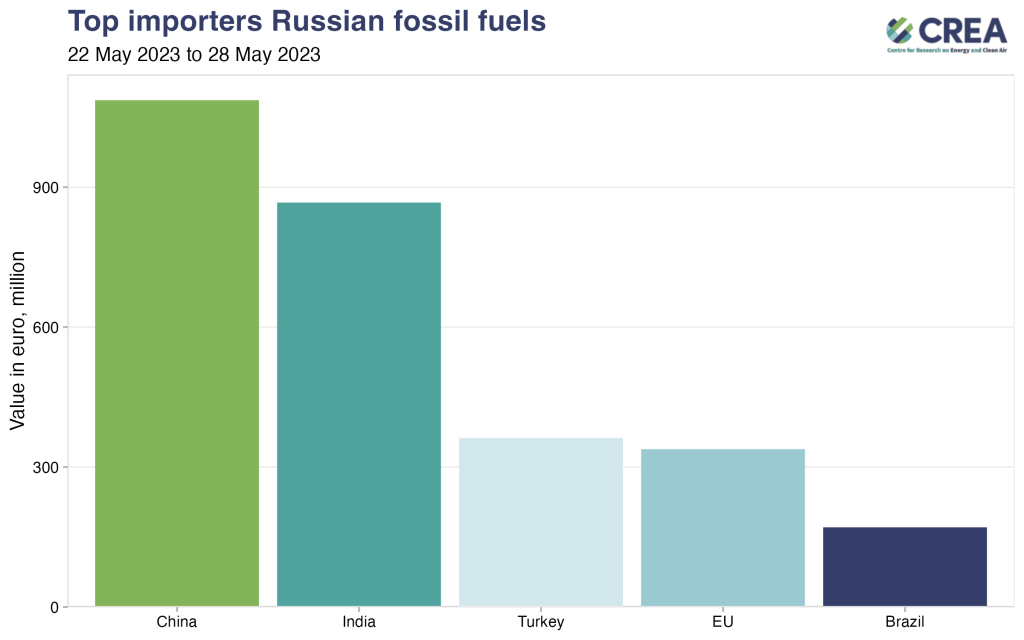
China was the largest importer of Russian fossil fuels, followed by India between 22 and 28 May. Turkey was the third largest importer followed by the EU and Brazil.
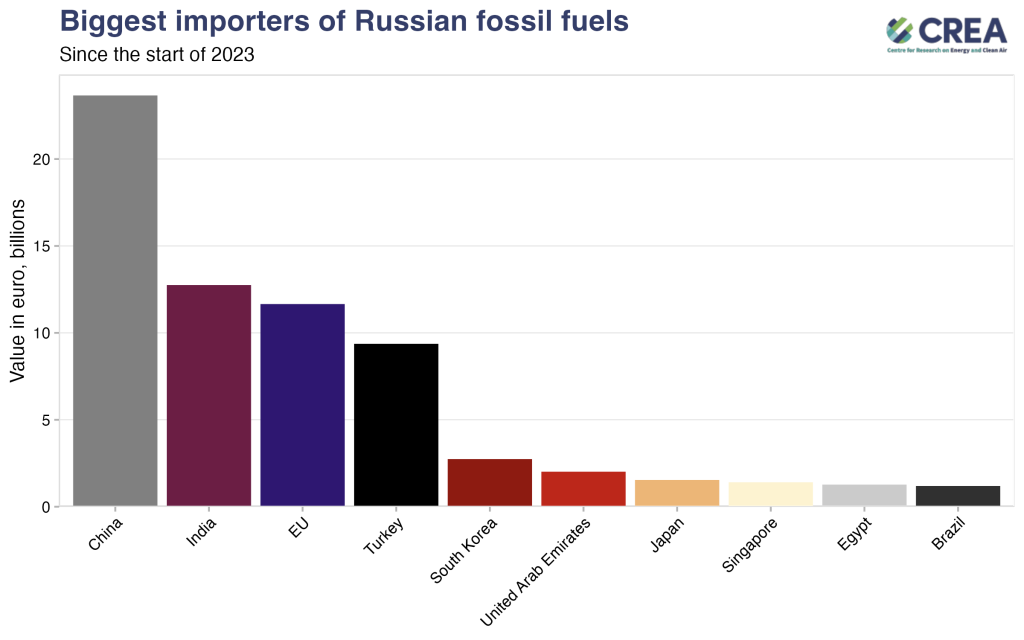
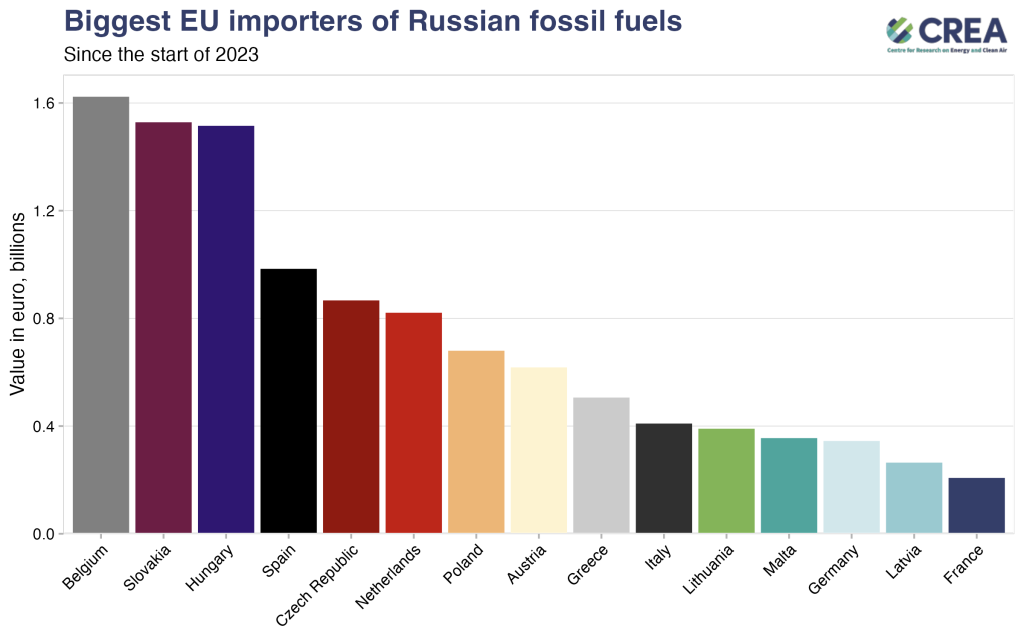
China remains the largest importer of Russian fossil fuels followed by India and then the EU since the start of 2023.
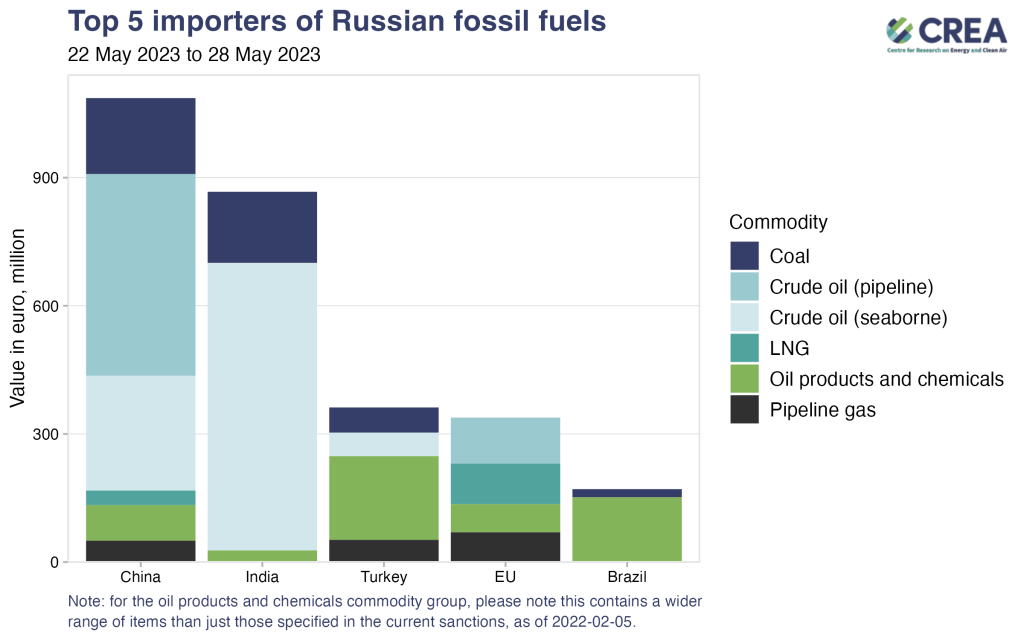
In the week between 22 and 28 May, China imported crude oil, coal, oil products&chemicals, pipeline gas and LNG from Russia. India imported mostly crude oil followed by coal and oil products&chemicals. Turkey imported mostly oil products&chemicals, coal, crude oil and pipeline gas too. EU imported pipeline crude oil, LNG and pipeline gas. Brazil imported mostly oil products&chemicals but also coal. The EU is shown as importing a small amount of oil products, but this is related to a ship-to-ship transfer event in Malta’s territorial waters for which the ultimate destination is not yet known.
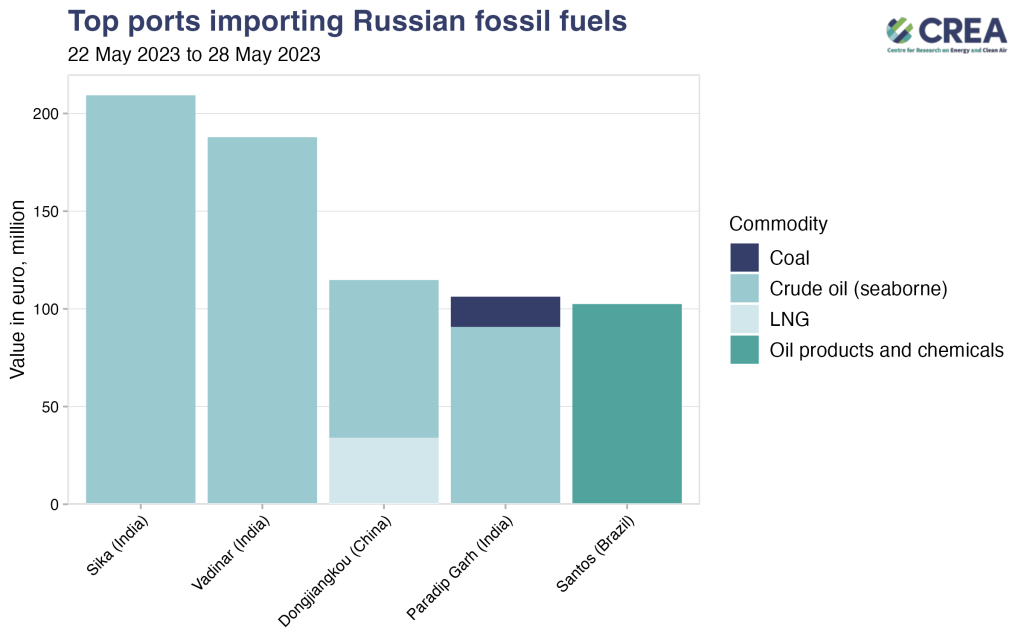
3 of the top 5 largest ports importing Russian fossil fuels were in India, importing large quantities of crude oil but also coal. The third largest port was in China importing crude oil and LNG. The 5th largest port importing Russian fossil fuels was in Brazil, purchasing only oil products&chemicals.
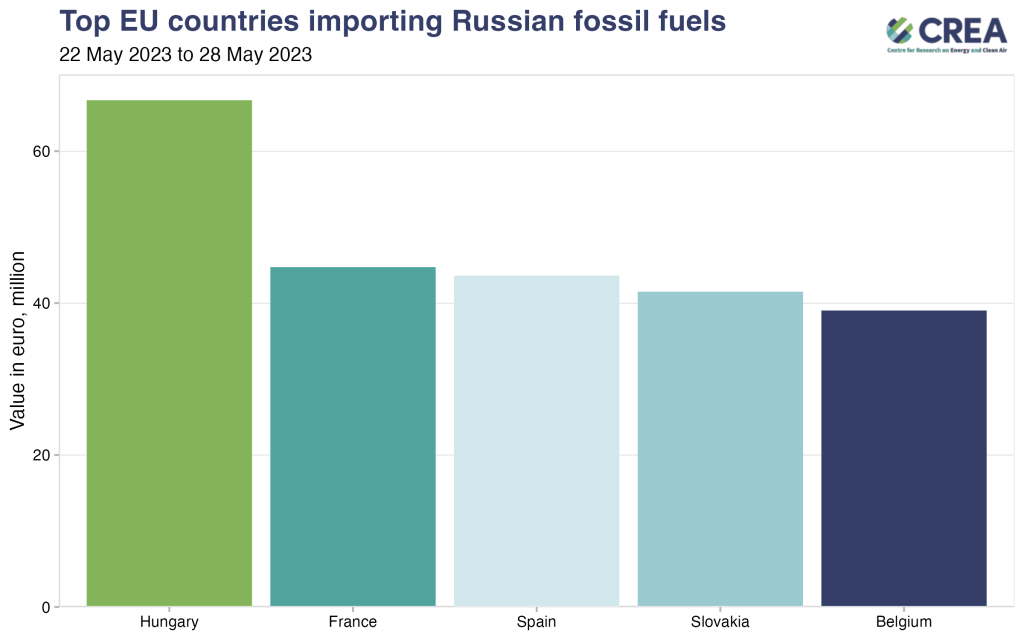
The top EU countries importing Russian fossil fuels between 22 and 28 May were Hungary, France, Spain, Slovakia and Belgium.
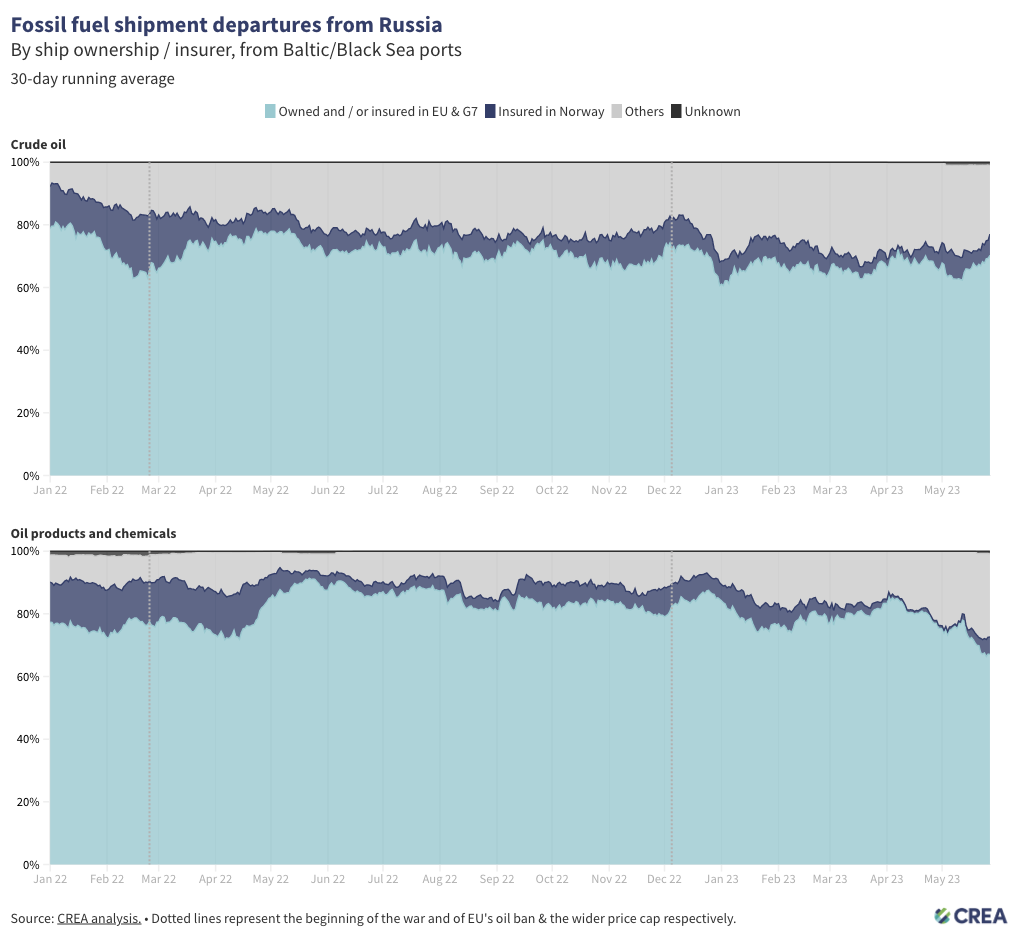
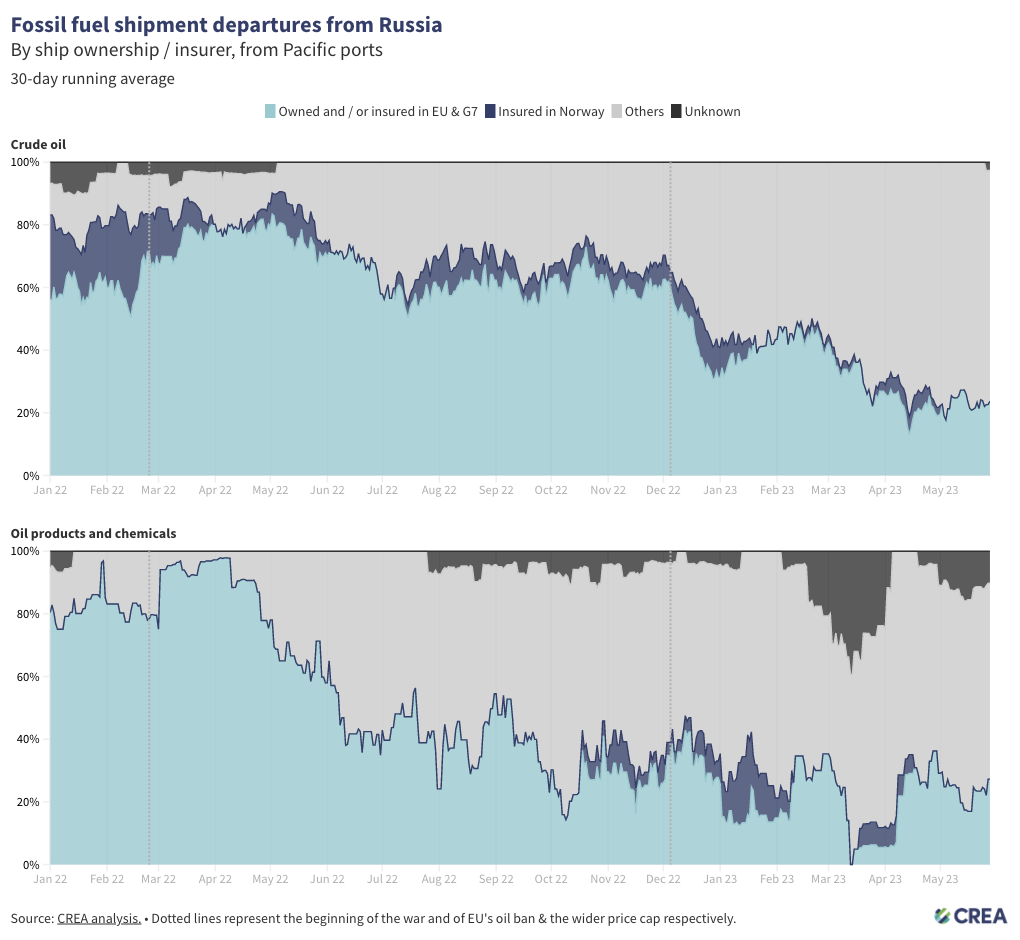
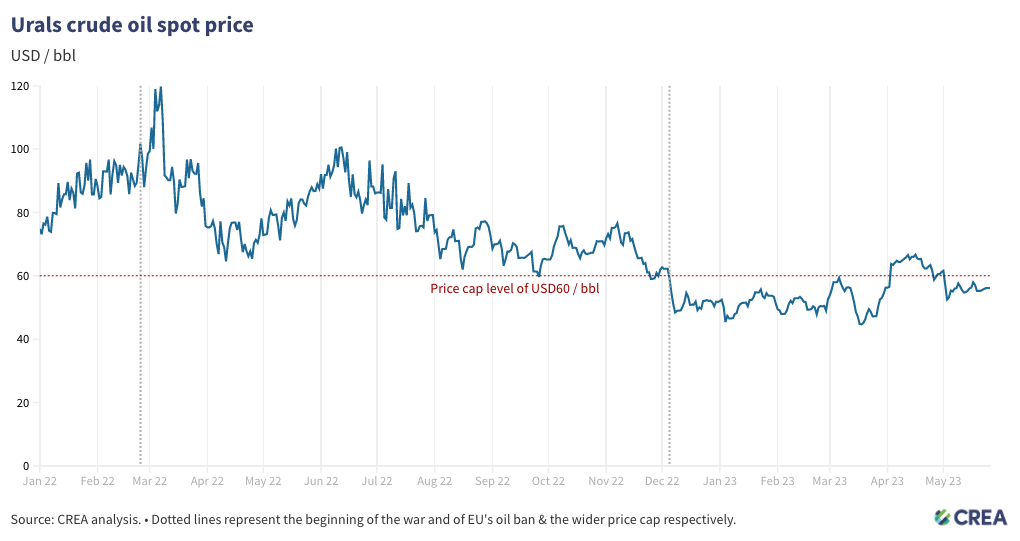
The share of tankers covered by the price cap in crude oil shipments out of Russia stayed around 55%. For oil products&chemicals, the coverage of the price cap coalition has fallen very slightly to around 60% from around 70% at the beginning of May. For crude oil, the coverage is relatively stable for shipments departing from Russia’s Baltic, Black sea ports and has slightly risen in the most recent week compared to the beginning of May. Urals crude prices remained below the price cap level of USD 60, after falling from April levels which were above the price cap level. The East Siberia–Pacific Ocean (ESPO) and Sokol prices, mainly applicable to Chinese and Japanese purchases, remain above the price cap level at around USD 65–67 whilst G7+ owned and / or insured tankers continue to lift Russian oil in Pacific ports.
Shipments in the last week

The weekly update of Russian fossil fuel exports was prepared by Isaac Levi, Energy Analyst, CREA; and Hubert Thieriot, Lead Data Scientist, CREA.
| Note on methodology: From 2023‑04‑03, our weekly snapshot values are no longer seasonally corrected, which may lead to some disparities between the preceding and following reports. We have also adjusted our time frame to show totals since the start of 2023 rather than the start of the invasion. Dates featured are the date the arrival of the shipment was captured by our algorithm. 80% of arrivals for shipments are found within 4 days of the arrival portcall in the specific port. For our oil products and chemicals commodity group, please note this contains a wider range of items than just those specified in the current sanctions, as of 2022‑02‑05. More information at: https://energyandcleanair.org/ |