War has added $468bn to the world’s fuel bill. The biggest oil producer is paying the most.
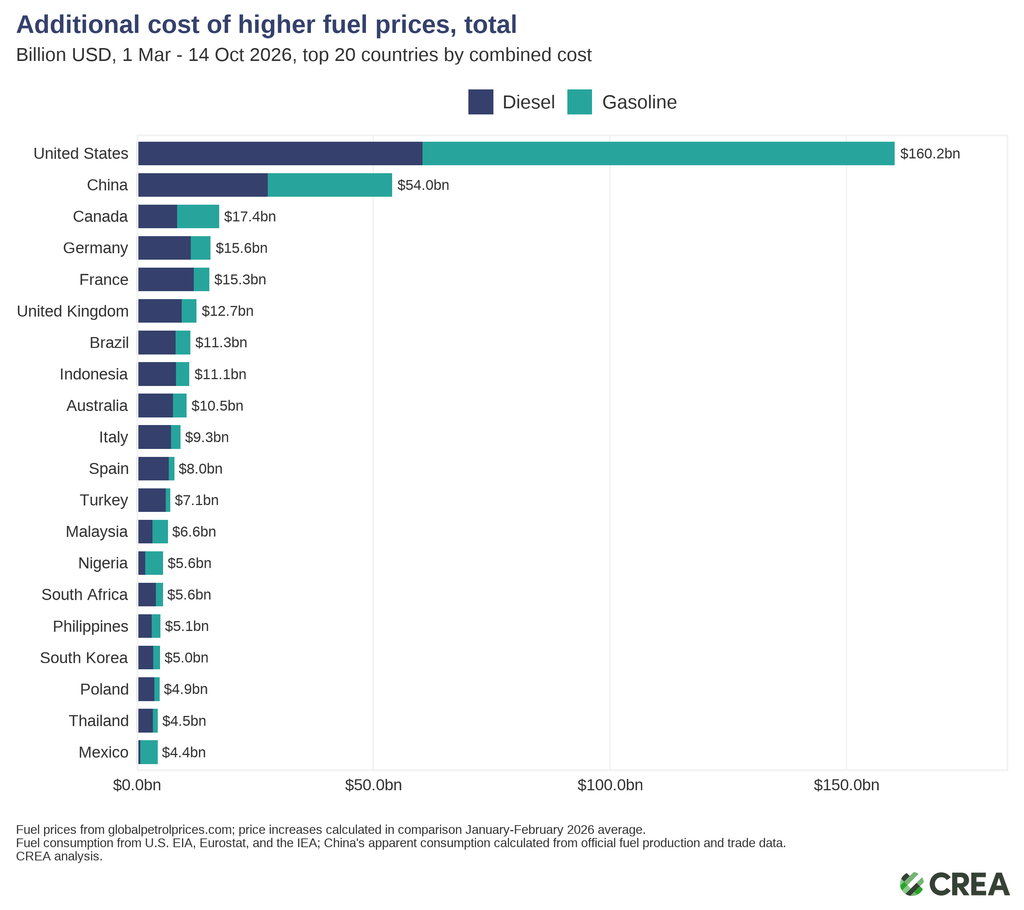
The US has faced a higher cost than any other country from the global Hormuz oil shock, with the crisis adding $160 billion to its fuel bill – around a third of the global total. Since the US and Israeli attacks on Iran began at the end of February, the world has paid an extra $468 billion for diesel and gasoline, equivalent to around $60 per person globally. Despite being the world’s largest oil producer, the US has faced an additional cost of $471 per person, the highest of any country.
This is because of America’s exceptional oil consumption due to high reliance on inefficient, oil-burning private vehicles and a slow transition away from petrol and diesel – leaving households, truckers and farmers particularly exposed to global fuel market shocks.
Other economies with high ownership and use of private cars, such as Canada and Australia, have also faced high costs per person.
American consumers have borne the brunt at the pump as the typical gasoline car driver has paid $440 more – assuming average mileage and fuel consumption – since the crisis began. US drivers that have managed to make the switch to EVs are now reaping the benefits, experiencing only an increase of $17 in charging costs since the beginning of March.
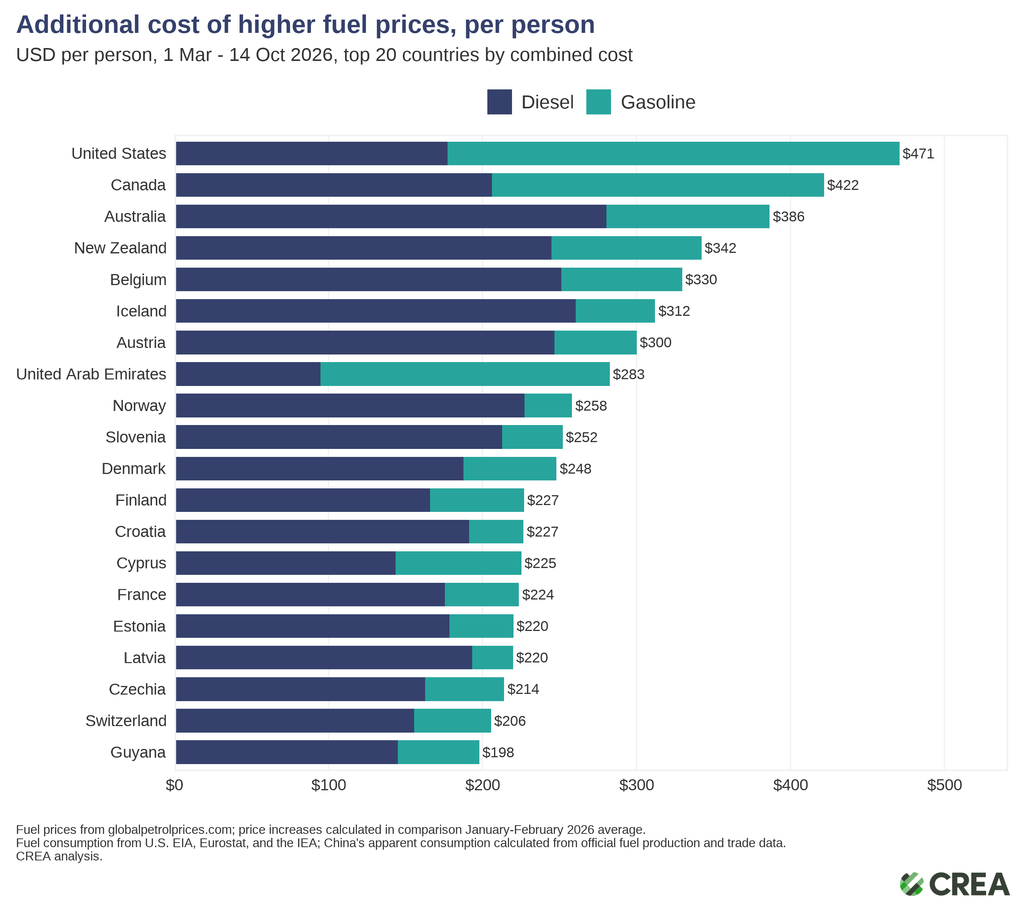
This is based on CREA analysis of gasoline and diesel prices and consumption in 169 countries, comparing the prices in January–February, before the disruption of shipments through the Strait of Hormuz, to realized prices at the pump from the beginning of March to the present.
At the national level, the biggest portion of the bill has landed on the US at $160 billion, a third of the total. China follows with $54 billion and Canada with $17 billion. Diesel is typically up by a third, with prices rising in 149 of 169 countries. Petrol is up by more than a fifth, rising in 148 of 170.
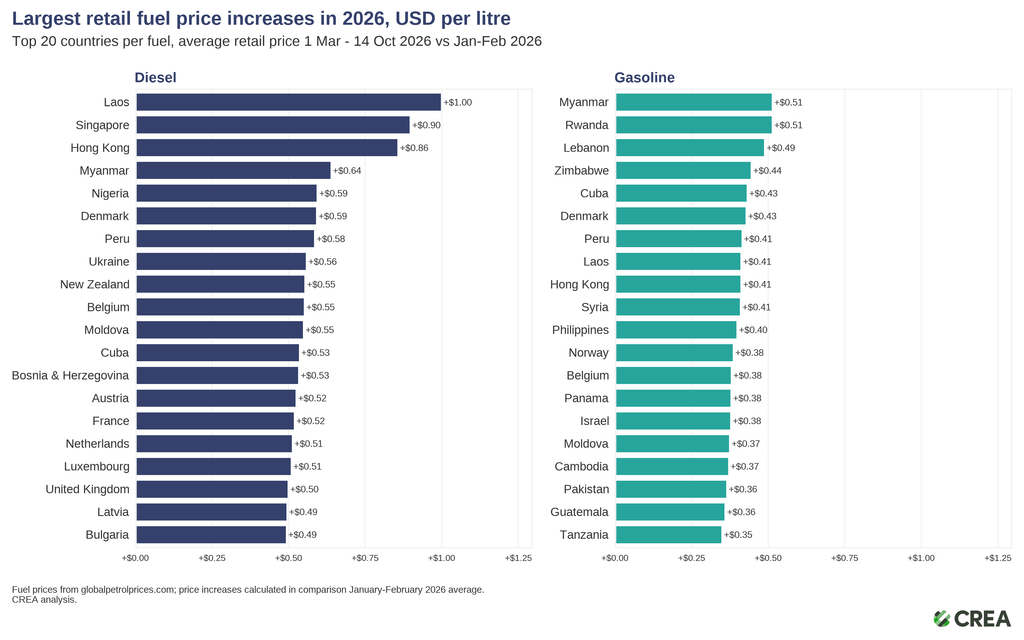
Fuel prices have risen for two reasons: increased price of crude oil, and a shortage of refining capacity. Refining capacity has shrunk as the disruptions to Hormuz traffic and Iran’s strikes on refineries have shut Gulf refining capacity off the market, and Ukraine’s counterattacks on Russia have affected refining capacity in the country.
The US produces more diesel than it needs, and has to export the surplus in order to produce enough gasoline and other fuels for the domestic market, as the ratio of different fuels produced in the refining process can only be changed to a very limited extent. Since the US needs the international market to absorb the excess diesel it produces and make refining profitable, it cannot isolate itself from international prices for refined fuels.
The increase in the price of fuels is not what makes the US stand out, however: price increases there are similar to other market economies. The reason that per capita costs in the US are so high is the high consumption of fuels per person and lack of progress in reducing reliance on oil.
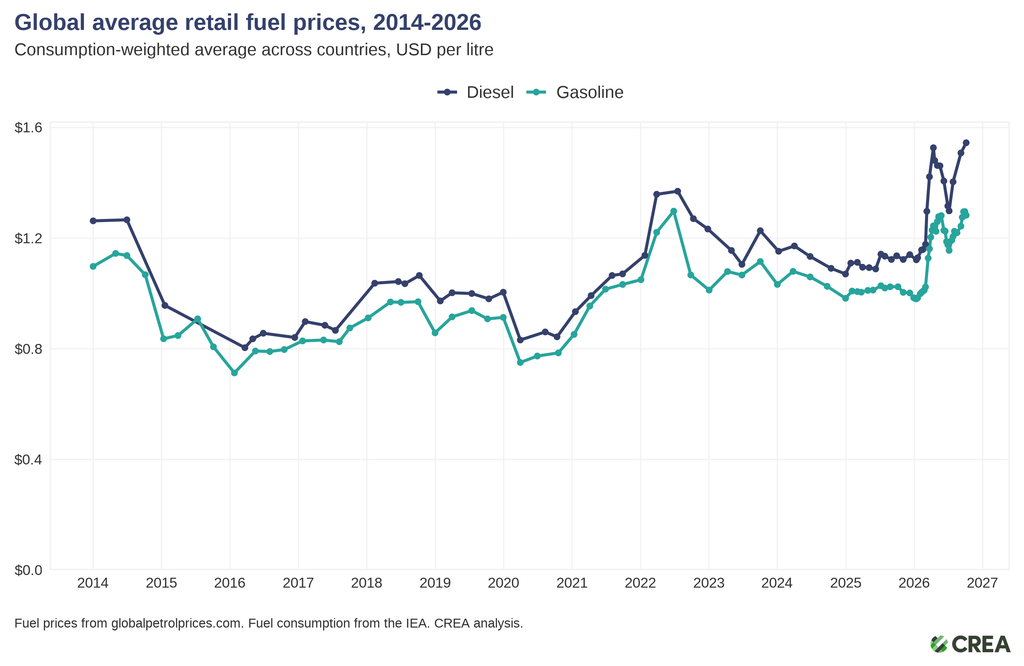
Globally, average diesel prices reached a new all-time high, while gasoline prices matched the spike that followed Russia’s invasion of Ukraine in 2022.
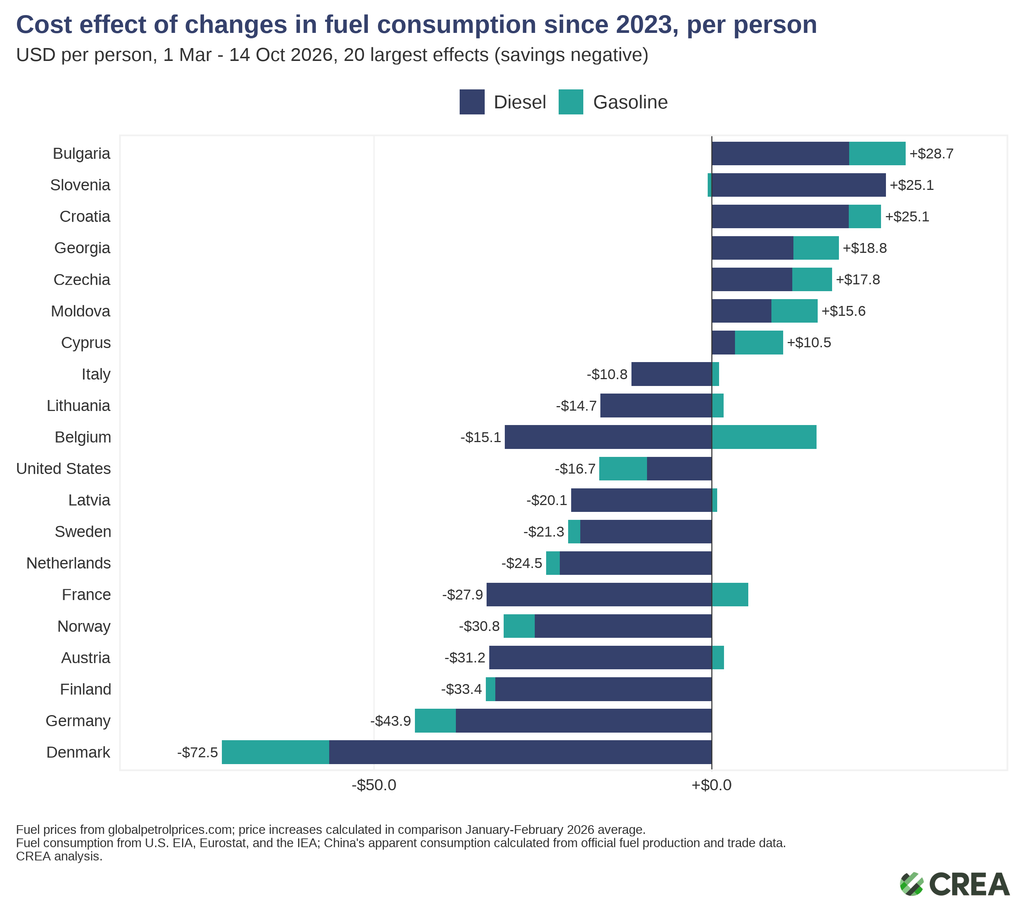
Countries that use less fuel now than before have softened the blow. Lower consumption since 2023 has saved China about $10.8 billion, nearly a fifth of its extra bill. Germany has saved $3.7bn, and Denmark $73 a head. America’s saving, $5.7bn, barely dents its bill. Pumping more oil, it turns out, is no substitute for needing less of it.
China’s gasoline and diesel consumption both peaked in 2023, with the shift to EVs, increase in the share of rail in both passenger and cargo transport, falling construction volumes, falling transport volumes of coal and heavy industry products all playing a role. The fall accelerated in 2026, as the share of EVs in new vehicle sales rose further and both individuals and businesses shifted to making more use of existing electric vehicles and increased rail travel.
In Denmark, both gasoline and diesel consumption have been falling steadily in the past years, with 2026 simply continuing the trend. Pure electric vehicles made up 81% of new vehicle sales in the first eight months of 2026, with 41% year-on-year sales growth. Electrification has driven declines in both gasoline and diesel — Denmark used to have a sizable fleet of diesel-burning private cars.
Other countries topping the chart of EV market share — Norway, Sweden, Finland, the Netherlands and Belgium, among others — also saw sizable fuel cost savings per person.
In Germany, both gasoline and diesel demand registered sharp drops in 2026 in response to the fuel price surge. Earlier years saw a slow falling trend, driven by gradual improvements in fuel efficiency and increase in the share of EVs, even as total road mileage increased. After the start of the Hormuz crisis, both heating oil and transport fuels saw major drops, with the fall in reported heating oil demand partially reflecting deferred purchases rather than genuine reductions in consumption. EVs, including plug-in hybrids, made up 37% of new vehicle sales in the first eight months of the year, with 40% year-on-year growth in sales. Heat pumps, a clean solution to replace oil and gas-fired heating, also saw 40% sales growth in the first half of the year.
The US lags far behind the leading economies in shifting to electrified transportation. The share of plug-in electric vehicles in new sales was 7.3% in the US in the first eight months of the year, compared with e.g. 57% in China, 32% in the EU and 98% in Norway. The share of EVs in US new vehicle sales contracted by 3%-points this year, while China saw an increase of 6%-points, the EU 7%-points and Norway of 1.4%-points.
Those US drivers that have made the switch are now reaping the benefits. An average EV driver in the US only faced an increase of $17 in charging costs since the beginning of March, due to the rise in consumer prices of electricity, while the driver of a gasoline-burning car paid $440 extra for fuel, assuming average mileage and fuel consumption.
About the data
Retail diesel, gasoline and LPG prices in USD per litre by country from GlobalPetrolPrices.com. The site covers about 170 countries for diesel and gasoline.
For the 33 European countries covered by Eurostat’s monthly oil statistics, gross inland deliveries of diesel and gasoline in March-October 2026 are scaled to the total ; months not yet published are estimated from the same month of 2025 and the latest year-on-year change.
For China, diesel and gasoline volumes are 2026 monthly apparent consumption (National Bureau of Statistics production minus net exports from China Customs) for March-August; September-October are estimated based on changes in June-August
For the United States, diesel and gasoline volumes are scaled the same way as in Europe by a monthly index from EIA data (product supplied, with biodiesel and renewable diesel added to distillate; finished gasoline includes ethanol). Other countries and LPG use 2023 levels. Population is from IEA World Indicators (2024).
For other countries, IEA World Energy Balances 2025, final energy consumption (total final consumption excluding non-energy use) of gas/diesel oil plus biodiesel, motor gasoline plus biogasoline, and LPG. 2023 is the latest year with complete country data.
| If you enjoy this kind of data-driven analysis of the most important current developments in global energy and air quality, subscribe to CREA INSIGHTS |