
CREA publishes EU CO2 emissions estimates before complete annual energy statistics are available. This includes estimated CO2 emissions per country, sector, and fuel type at a monthly resolution. Comparisons with external datasets and reconstructed historical estimates show broadly consistent trends and small revisions at our usual publication points, while also defining the limits of those checks.
CREA’s EU CO2 Emission Tracker combines the speed of early emissions estimates with the detail and continuity of a comprehensive energy dataset. It tracks how changes in coal, oil and gas consumption across countries and sectors affect EU emissions, using faster indicators where recent energy statistics are incomplete. As more complete monthly and annual data become available, they are incorporated into the same dataset, connecting timely analysis of current developments with a consistent view of longer-term emissions trends.
Waiting for every data source to be up-to-date would reduce the need for modelled estimates, but it would also delay vital information until after much of the public and policy debate has taken place. Publishing earlier allows journalists, policymakers, researchers and campaigners to assess progress, scrutinise policy outcomes and support accountability while decisions and interpretations are still being formed. CREA’s CO2 emissions data and publications promptly identify early emissions trends and highlight leaders and laggards in emissions reductions. The trade-off between timely publication and the risk of subsequent revisions is worthwhile only if the likely scale of revision is clear. For example, CREA’s estimated year-on-year trend revision was 0.21 percentage points for annual estimates and 0.40 percentage points for H1, and the data was available already in January.
For 2025 emissions estimates, our January 2026 analysis found that the EU’s CO₂ emissions fell by just 0.8% year-on-year. This means that the EU’s total fossil-fuel emissions were 4% above the pathway needed to meet climate targets and we can already share this information with relevant stakeholders in January.
At CREA, to assess the stability of our EU CO2 emissions estimates, we took a two-step approach. First, we compared CREA’s annual emissions estimates for 1990 to 2024 using our January 2026 dataset with nine external emissions data series for the European Union. Second, we reconstructed the information that would typically have been available at successive month-ends from 2020 to 2024, reran the same estimation method, and measured how the resulting early estimates changed as more source data became available. We compared each early estimate with a later, more mature estimate based on more complete data, referred to here as the reference estimate. Revisions are reported as a percentage of the reference estimate, regardless of whether the estimate increased or decreased. First-half estimates (H1) cover January to June.
Key findings for EU CO2 emissions predictions
CREA’s data compared to leading global emissions tracker — 1990–2024:
- Annual EU CO2 emission estimates from CREA and the world’s leading Global Carbon Budget (GCB) tracker from the Global Carbon Project differed by 2.02% on average in absolute terms.
- These datasets showed the same direction of annual change in 94.1% of the comparable years (32 of 34).
CREA data revisions for published estimates — 2020–2024:
- Annual EU CO2 emission estimates, at the earliest January publication point, had a typical revision of 0.23% and a maximum of 0.55% across the five years tested, 2020–2024. All five were within 1% of their later reference estimate.
- H1 estimates, at a September publication point, had a typical revision of 0.39% and a maximum of 0.54%. Again, all five were within 1% of their reference estimate.
- Across the five years tested in the reconstruction analysis, updates to CREA’s estimates never changed whether emissions were reported as increasing or decreasing, for either annual or first-half results.
- At the publication point, the typical revision to CREA’s estimated year-on-year trend was 0.21 percentage points for annual estimates and 0.40 percentage points for H1, as compared to their later reference. The maximum change 0.53 and 0.69 percentage points, respectively.
These results provide evidence that CREA’s early EU-wide estimates are sufficiently stable to support broad conclusions about the direction and approximate scale of change in the years tested. They do not prove that the estimates are accurate, capture every source of uncertainty or guarantee the same performance in future conditions.
Timely estimates involve a trade-off
CREA’s EU CO2 emissions tracker estimates fossil-fuel CO2 emissions for the EU27. It derives fossil-fuel consumption mainly from Eurostat energy data and applies Intergovernmental Panel on Climate Change (IPCC) emission factors. For recent periods affected by reporting delays or missing observations, it uses faster indicators such as power generation, gas flows, and industrial production, together with statistical projections and other documented assumptions.
As reported monthly and annual energy data become available, they replace or constrain the early estimates. Some revision is therefore expected. A revision is not, by itself, evidence of a mistake; it is part of the process of producing an estimate before all inputs are complete. The relevant questions are how large the revisions have been, how quickly they have declined, and whether they would materially change the conclusions drawn at the time of publication.
The full approach is described in the CREA EU CO2 Tracker methodology.
External datasets show the same broad long-term picture
We compared CREA’s annual EU CO2 emission estimates with nine well-regarded external datasets drawn from emissions inventories, energy balances, and near-real-time datasets. The comparison covers a fixed EU27 geography from 1990 to 2024, where the series overlap. Because the datasets differ in scope and method, the purpose is to test broad consistency rather than to identify one series as the truth.
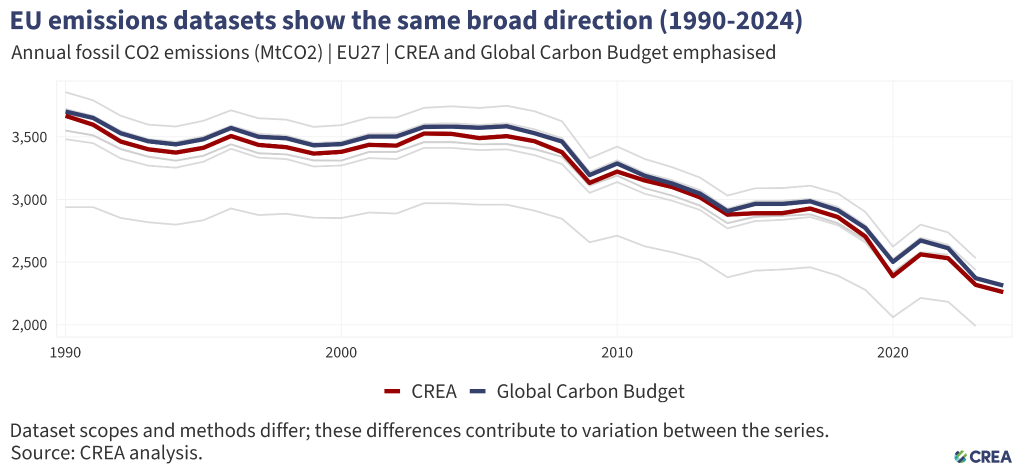
Figure 1 — Annual fossil CO2 emissions for the EU27 comparing CREA’s database with other sources
Note: CREA and the Global Carbon Budget are demarcated in bold. Grey lines show Climate Watch, the United Nations Framework Convention on Climate Change (UNFCCC), the Potsdam Institute for Climate Impact Research (PIK), the IEA-derived balance estimate, PRIMAP Energy and Industry, and PRIMAP excluding the mineral industry.
We use the Global Carbon Budget (GCB) as the closest lead comparison because it provides a long-running, documented series on coal, oil, and gas with a scope similar to CREA’s. Across 35 matched annual EU estimates, the mean absolute difference was 2.02%. In 2024, CREA estimated EU CO2 emissions at 2,261 million tonnes of CO2 (MtCO2), compared with 2,313 MtCO2 in GCB, a difference of 53 MtCO2 (2.27%).
While the scope differs across the datasets in this comparison — and therefore the absolute values — the trend in CREA’s annual fossil CO2 emissions closely mirrors that of the others.
The direction of annual change is particularly consistent
For policy and public debate, whether emissions are rising or falling is often at least as important as the precise level. CREA and GCB showed the same direction of annual change in 32 of 34 comparable years, or 94.1%. Across the other long-running series, agreement on direction ranged from 87.5% to 96.7%.
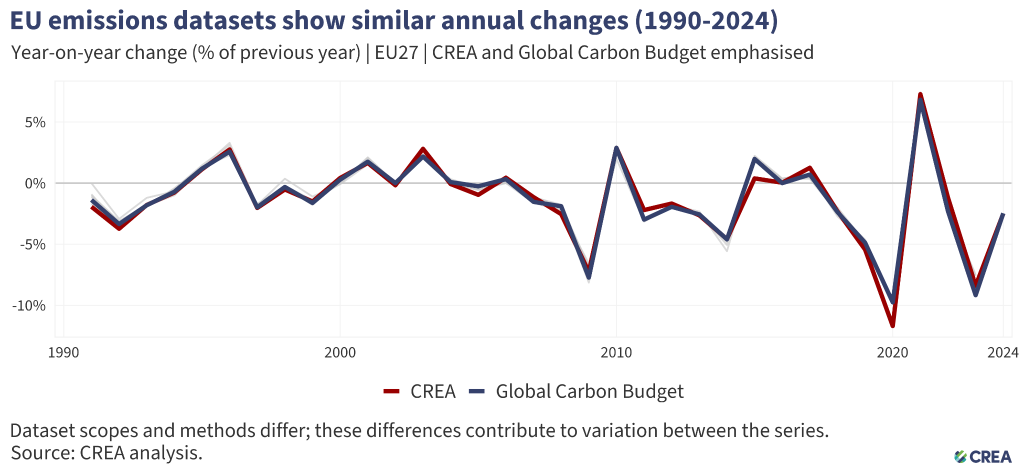
Figure 2 — Year-on-year change in annual CO2 emissions for the EU27 comparing CREA’s database with other sources, 1990-2024
Note: CREA and the Global Carbon Budget are demarcated in bold. The other external series are shown in grey, but many are difficult to distinguish because their estimates closely overlap.
The similarity of trends across multiple datasets measuring changes in annual EU CO2 emissions provides useful evidence that CREA is identifying the same broad historical movements as datasets produced by different methods. It is not a measure of accuracy, but rather stability and reliability. Two datasets can move in the same direction while differing in their magnitude of change, and several external datasets share underlying energy statistics or accounting conventions.
Why do CREA and the Global Carbon Budget data differ
The GCB dataset has been published and refined by the Global Carbon Project over many years, with a documented methodology and source metadata. We have chosen to represent the GCB data in our charts as a visual comparison because its fossil-fuel categories can be aligned relatively closely with CREA’s, not because agreement with GCB proves that either estimate is correct.
The most important differences arise from how the two datasets define and classify emissions. CREA focuses on emissions from fossil-fuel combustion, while the Global Carbon Budget also includes some emissions from industrial processes and non-energy uses of fossil fuels — for example, during manufacturing, through the use of products such as solvents, or when products are incinerated. The datasets also treat international aviation differently, particularly before 2010. In addition, the net calorific values (NCV) and emission factors used to estimate emissions likely differ between the two datasets. These differences affect the absolute estimates, even where the overall trend is similar.
We account for these differences where the published data allow, but some components cannot be separated consistently across the full historical series. The comparison should therefore be understood as a check of broad consistency, not a strictly like-for-like validation or evidence that either dataset represents the true value. Further details on how the datasets were aligned are provided in the appendix.
Historical revisions are small at routine publication points
To measure how CREA’s EU CO2 emissions data fluctuates when it is revised, we reconstructed monthly data availability for 2020–2024 using typical publication delays and ran the same version of CREA’s estimation method for each historical month-end. Each annual or H1 estimate was then compared with a later reference estimate produced using information available at the end of January two years after the reporting year.
The reference estimate is mature and stable, but it is not treated as final, error-free or the true value. As source coverage increases over time, a smaller proportion of CREA’s estimates are based on our modelled data, and this analysis attempts to measure the revision as we replace this modelled data.
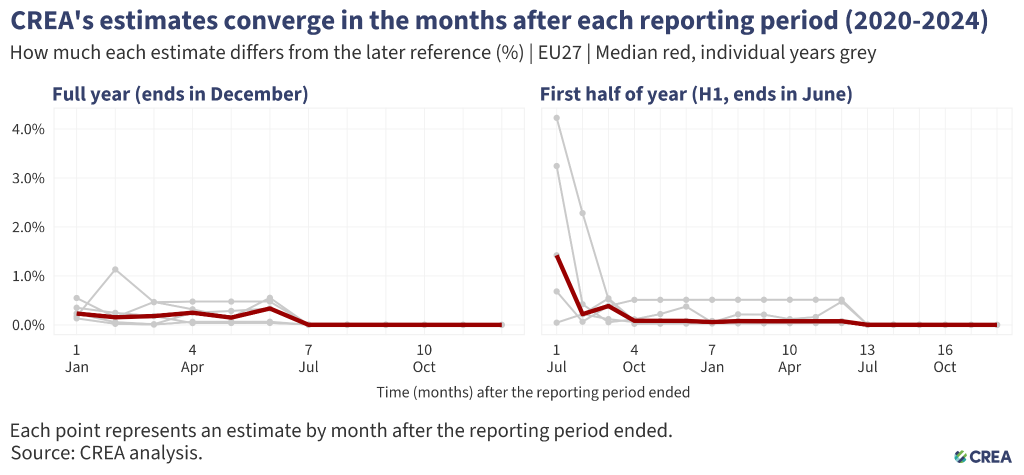
Figure 3 — Absolute difference between each reconstructed estimate and its later reference estimate, as a percentage of the reference estimate, 2020-2024
Note: Grey lines show individual reporting years from 2020 to 2024; the bold line shows the median. Each series represents the revisions (as compared to its much later reference dataset) in the period from the first estimate we create for it. Each point in the series is that many months from that first estimate. See ‘Revision analysis’ in the appendix for more details.
At CREA’s routine publication points, all five annual estimates and all five H1 estimates were within 1% of their reference estimate. The median revision was 0.23% for annual estimates published in January and 0.39% for H1 estimates published in September. The largest revisions at those points were 0.55% and 0.54%, respectively.
Revisions do not necessarily decline smoothly every month because different sources arrive on different schedules and can move an estimate in either direction. Under a conservative definition that requires the estimate to remain below a threshold thereafter, annual estimates stayed within 1% from March and within 0.5% from July. H1 estimates stayed within 1% from the planned September publication point and within 0.5% from July of the following year.
Revisions did not change the reported direction of the trend
At publication, the typical change (as compared to the reference dataset) to the estimated year-on-year trend was 0.21 percentage points for annual estimates and 0.40 percentage points for H1. The largest changes at these publication points were 0.53 and 0.69 percentage points, respectively.
For each of the five years tested, we compared estimates produced at successive month-ends with the later reference estimate. None of these comparisons changed whether emissions were reported as increasing or decreasing. Three first-half estimates were revised by at least two percentage points, but even these revisions did not reverse the reported direction of year-on-year change — and these occurred before a typical September publication point.
This suggests that the broad direction of CREA’s EU-wide trend was robust to the observed revisions during 2020–2024. It does not mean revisions are always immaterial. When the underlying change is close to zero, even a comparatively small revision can materially affect its size or potentially its sign.
When early estimates require more caution
The historical results are most directly relevant to EU-wide annual and H1 EU27 estimates produced under conditions resembling the five years tested. Early estimates require more caution when:
- the estimated change is small and close to zero;
- an economic or energy-system shock breaks the historical relationship between emissions and the faster proxy indicators;
- major sources are delayed, missing or revised in ways not represented by their typical publication schedules;
- the estimation method, reporting coverage, or composition of EU emissions changes materially; or
- a conclusion depends on a precise estimate for a given country, sector, or fuel because the revision analysis presented here tests only the EU27 total.
This validation period includes the COVID-19 disruption and the 2022 European energy crisis, but these five years cannot represent every future condition. We reconstructed what data would likely have been available at each point in time using typical publication schedules, rather than a complete archive of the data as it was originally published. In addition, this analysis used the input datasets as they are now, not as they were published at the time — if a source later revises a value after it was originally published, the newer value will appear in the reconstructed data. The results may therefore understate or otherwise differ from revisions observed in a fully archived real-time dataset.
We consider these conditions when developing each analysis, not only when interpreting the results afterwards. Where these checks indicate greater uncertainty, we narrow or qualify the conclusions and avoid reporting detail that the available evidence cannot support.
Quality checks continue as we develop the tracker
These results provide a baseline for ongoing quality control rather than a one-off endorsement. Changes to CREA’s EU CO2 emissions model are compared with the previous version and with external datasets. Before annual and H1 publication, historical revision performance can be rerun to check whether early estimates remain within the expected range and whether any deterioration warrants investigation.
Publishing the methods, comparisons and limitations makes the quality claim testable. It also helps define the appropriate level of caution: early estimates are useful for understanding broad, current developments. At the same time, later data remain preferable when a conclusion depends on very small changes or precise totals.
What these checks show
For 2020–2024, CREA’s annual and H1 EU CO2 estimates changed little between their regular publication dates and the later reference estimates, and later revisions did not reverse the reported direction of change. Across the longer historical record, CREA also shows broadly similar levels and annual movements to several external datasets, particularly the Global Carbon Budget.
Together, these checks support using the early estimates to assess the broad direction and approximate scale of current EU emissions trends. They do not turn a timely modelled estimate into a final statistic. CREA will continue to revise the data as more complete sources arrive and to state clearly when the evidence is less stable or a conclusion is sensitive to small differences.
Appendix
How the comparisons were made
External dataset comparison
The external comparison of annual EU CO2 emissions uses CREA’s estimate, available as of 31 January 2026, and covers 1990–2024 using the current 27 EU member states throughout the historical series. Monthly CREA estimates were summed to calendar years and expressed in MtCO2. External observations were matched by year and geography only where both series reported a value; missing observations were not interpolated.
The nine external series analysed were Climate Watch, UNFCCC, PIK, Global Carbon Budget 2025, an IEA energy-balance-derived estimate, Carbon Monitor Europe, Carbon Monitor excluding bunkering fuel, PRIMAP Energy and Industry, and PRIMAP Energy and Industry excluding mineral industry. The headline comparison retains each dataset’s published scope rather than forcing it to match all of the sectors that are included in CREA’s estimated CO2 emissions. This means differences in international transport, industrial processes and other boundaries remain part of the comparison.
The percentage difference is calculated relative to the external estimate. Trend agreement records whether both datasets rise, fall, or remain unchanged between consecutive years. It measures agreement in direction, not the magnitude of the change. The separate GCB fuel diagnostic applies the alignment described in the main text.
Revision analysis
The revision analysis covers EU27 totals for 2020–2024. It holds the estimation method constant and changes which daily, monthly, and annual source observations are treated as available at each historical month-end. To simulate the available data at the time, for each historical month in this analysis, we used typical publication delays rather than an archive of the state of the data at the time. Annual totals are assessed from January to December of the following year, while H1 totals are assessed from July of the reporting year to December of the following year.
For each year, the reference is the estimate using data available at the end of January two years later. Revisions are expressed as a percentage of that reference. The ‘settled’ thresholds require the largest revision across the five years to remain below the threshold at every subsequent observed month, so they describe these historical observations rather than guaranteeing a date on which the data is considered settled.
Differences between CREA’s and GCB datasets
CREA’s dataset and GCB differ in scope, which can make a direct comparison difficult.
For the fuel-level component, we combine CREA’s coal and coke estimates into a single coal category, compare gas directly, and exclude cement production, flaring, and GCB’s ‘other’ category, which is not included in CREA’s data. International aviation is excluded from GCB national totals. In this analysis, CREA’s published total EU CO2 emissions data includes international aviation where available, but the separate international aviation series is reliable only from 2010 onward. We can therefore remove international aviation from CREA’s oil estimate only for the 2010–2024 portion of the comparison; the 1990–2009 comparison cannot be adjusted for this difference.
In addition, CREA estimates CO2 only from fossil-fuel combustion, whereas the Global Carbon Budget also captures the fraction of non-energy use that is actually oxidised. The GCB’s published fuel series does not identify these non-energy related emissions separately, so we cannot subtract them to reproduce CREA’s combustion-only scope estimates.
The values CREA uses for net calorific value (NCV) and emission factors to calculate CO2 emissions likely differ from the GCB’s values. This is due to the different approaches in the way that we have produced estimates for the NCV and emission factors.