By Qi Qin, China Analyst; Danny Hartono, Data Scientist; with contributions from Lauri Myllyvirta, Lead Analyst
April saw broad year-on-year improvements in PM2.5 and NO₂ across provincial capitals, but tighter standards exposed persistent PM2.5 non-compliance, while multi-pollutant pressure remained concentrated in northern industrial and transport-hub cities.

Aerial view of the Futuyu Great Wall surrounded by a sea of clouds and blooming peach blossoms in spring, Hebei, China, on 17 April 2026. Photo: Isabel Tung/Alamy.
Key findings
- Following the tightening of China’s annual PM2.5 standard from 35 to 30 µg/m³ in March 2026, the number of provincial capitals failing to meet the standard rose sharply from 6 in February to 17 by the end of April, with non-compliant cities concentrated not only in the Beijing-Tianjin-Hebei region but also across parts of the Northeast and Northwest.
- PM2.5 levels rose year-on-year in only three provincial capitals in April, compared with 18 in March. Weather strongly shaped PM2.5 outcomes, especially in northern cities.
- Several northern industrial or transport-hub cities showed consistently high pollution across more than one pollutant category. Zhengzhou, Lanzhou, Yinchuan, Xi’an, Taiyuan, and Shijiazhuang all ranked relatively high for PM2.5 and O₃. Tianjin, Xi’an, Taiyuan, and Lanzhou all ranked high for NO₂ and also appeared among the higher-ranking cities for PM2.5 and/or O₃.
- Many southern capital cities saw notable declines in ozone and PM2.5 simultaneously, including Chongqing, Guangzhou, Changsha, Hefei, Guiyang, and Shanghai.
- Low-pollution cities tended to be southern, coastal, high-altitude or less industrialised provincial capitals. Haikou, Lhasa, Guiyang, and Kunming ranked among the lower end for at least two pollutants, especially PM2.5 and NO₂.
- NO₂ declined year-on-year across all provincial capitals, but the drivers varied by city.
17 provincial capitals failed to meet the new annual PM2.5 standards
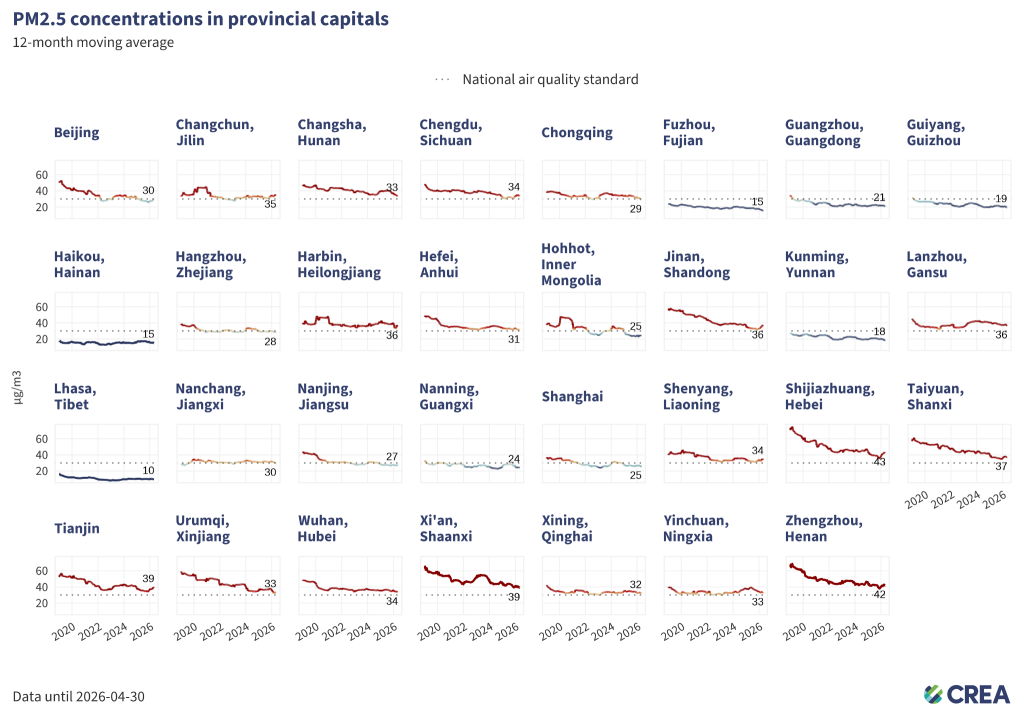
- As of the end of April, 17 of China’s 31 provincial capitals had 12-month average PM2.5 concentrations above the national annual standard of 30 µg/m³, meaning they failed to meet the standard. Starting this March, the new national standard for PM2.5 has been tightened from 35µg/m³ to 30 µg/m³.
- The cities with the highest PM2.5 levels were concentrated in the Beijing-Tianjin-Hebei surrounding area. Shijiazhuang (Hebei) recorded the highest levels at 43 µg/m³, followed closely by Zhengzhou (Henan) at 42µg/m³. Xi’an (Shaanxi) and Tianjin came next, both at 39 µg/m³.
- Provincial capitals that failed to meet the national PM2.5 standard were also clustered in the Northeast and Northwest, including Shenyang, Changchun, Harbin, Urumqi, Xining, Yinchuan, and Lanzhou. Other cities on the list included Jinan, Wuhan, Chengdu, Hefei, and Changsha.
PM2.5 levels rose year-on-year in three provincial capitals in April
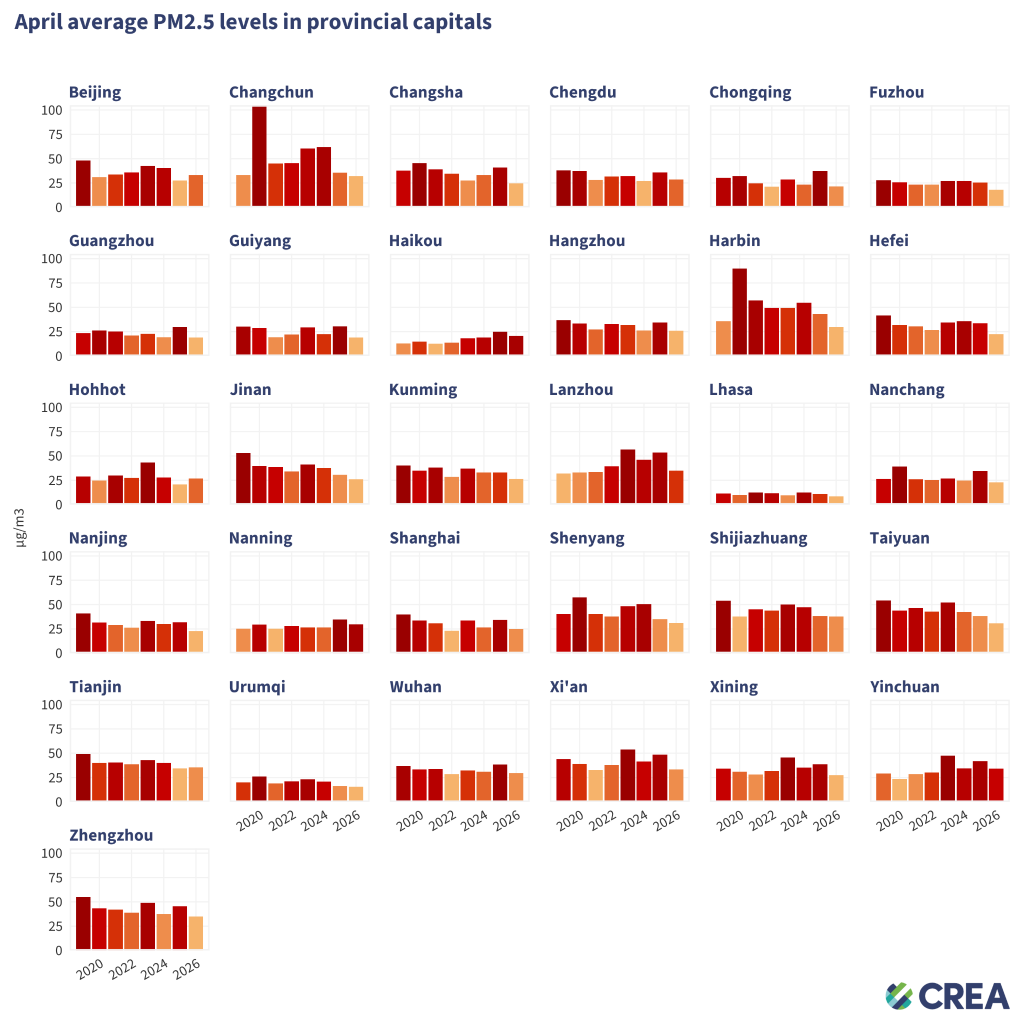
- Notable year-on-year increases were recorded in three capitals, namely Hohhot (+28%), Beijing (+20%), and Tianjin (+3%).
- The biggest year-on-year declines were recorded in Chongqing (-43%), Changsha (-39%), and Guiyang (-38%).
- Other notable declines included Guangzhou (-36%), Lanzhou (-35%), and Nanchang (-34%).
Six provincial capitals exceeded the annual ozone limit
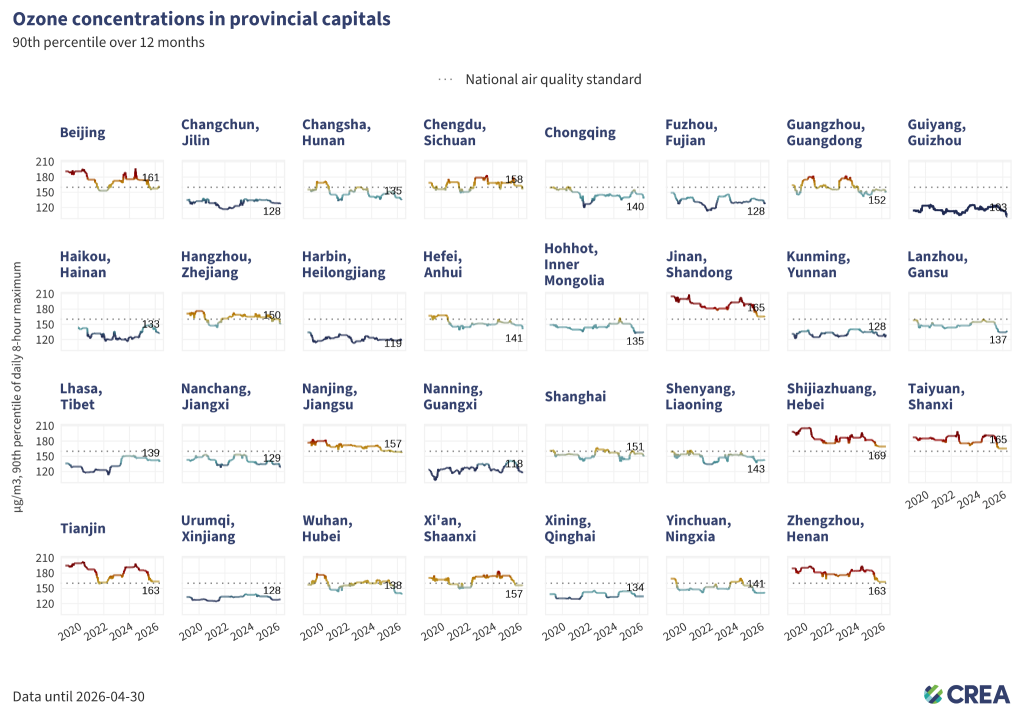
- As of the end of April 2026, six out of 31 provincial capitals recorded 12-month 90th percentile ozone concentrations above the national standard of 160 µg/m³.
- Cities with the highest ozone levels were still mainly located in the Beijing-Tianjin-Hebei surrounding area. Shijiazhuang (Hebei) recorded the highest level at 169 µg/m³, followed by Jinan (Shandong) and Taiyuan (Shanxi), both at 165 µg/m³, and Tianjin and Zhengzhou (Henan) at 163 µg/m³.
- Compared with the previous month, Changchun (Jilin), Hohhot (Inner Mongolia), Kunming (Yunnan), Lanzhou (Gansu), and Xi’an (Shannxi) saw slight increases in their annual ozone assessment values.
Ozone levels rose year-on-year in nine provincial capitals in April
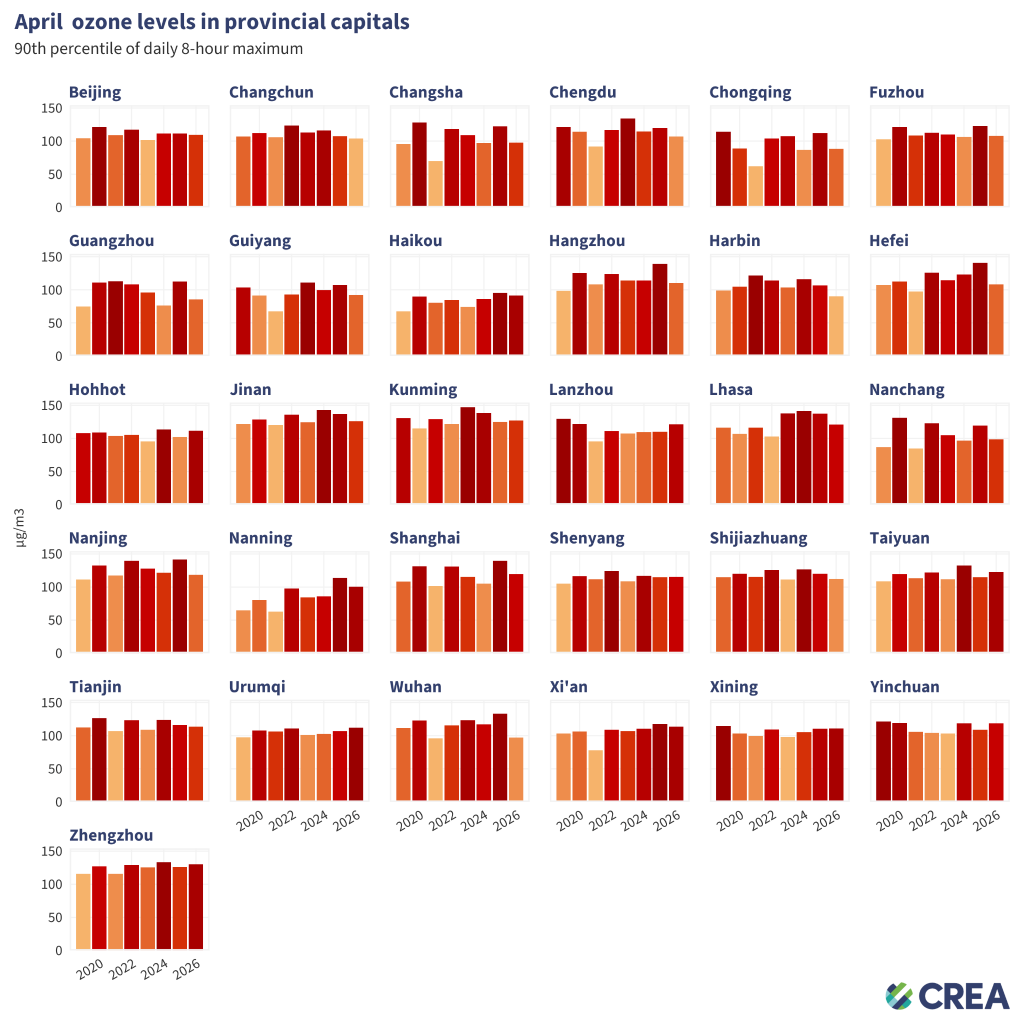
- Northwestern capital cities saw the largest year-on-year increase in ozone levels: Lanzhou (+10%), Yinchuan (+8.8%), and Hohhot (+8.6%).
- Hohhot (Inner Mongolia) saw increases in both PM2.5 (+28%) and ozone (+8.6%) levels.
- Many capital cities saw notable declines in ozone and PM2.5 simultaneously, including Chongqing, Guangzhou, Changsha, Hefei, Harbin, Guiyang, and Shanghai.
Multi-pollutant pressure concentrated in northern industrial hubs
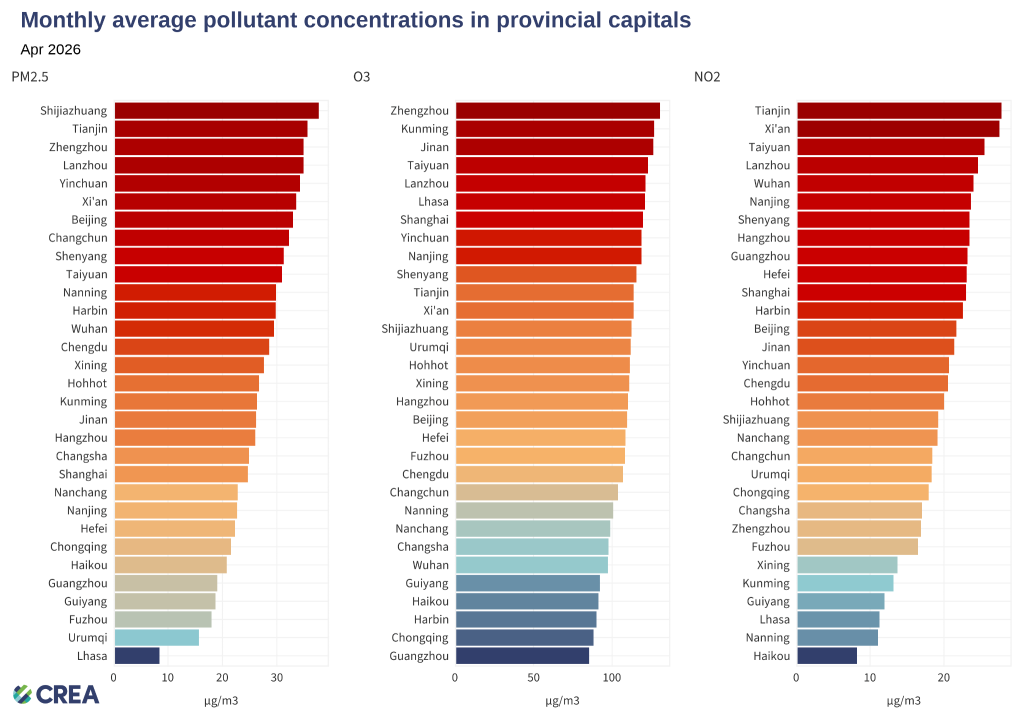
- Several northern industrial or transport-hub cities showed consistently high pollution across more than one pollutant. Zhengzhou, Lanzhou, Yinchuan, Xi’an, Taiyuan and Shijiazhuang all ranked relatively high for PM2.5 and O₃. Tianjin, Xi’an, Taiyuan and Lanzhou all ranked high for NO₂ and also appeared among the higher-ranking cities for PM2.5 and/or O₃ .
- Low-pollution cities tended to be southern, coastal, high-altitude or less industrialised provincial capitals. Haikou, Lhasa, Guiyang and Kunming ranked among the lower end for at least two pollutants, especially PM2.5 and NO₂.
Weather shaped pollution trends, but emissions pushed up PM2.5 and O₃ in some cities
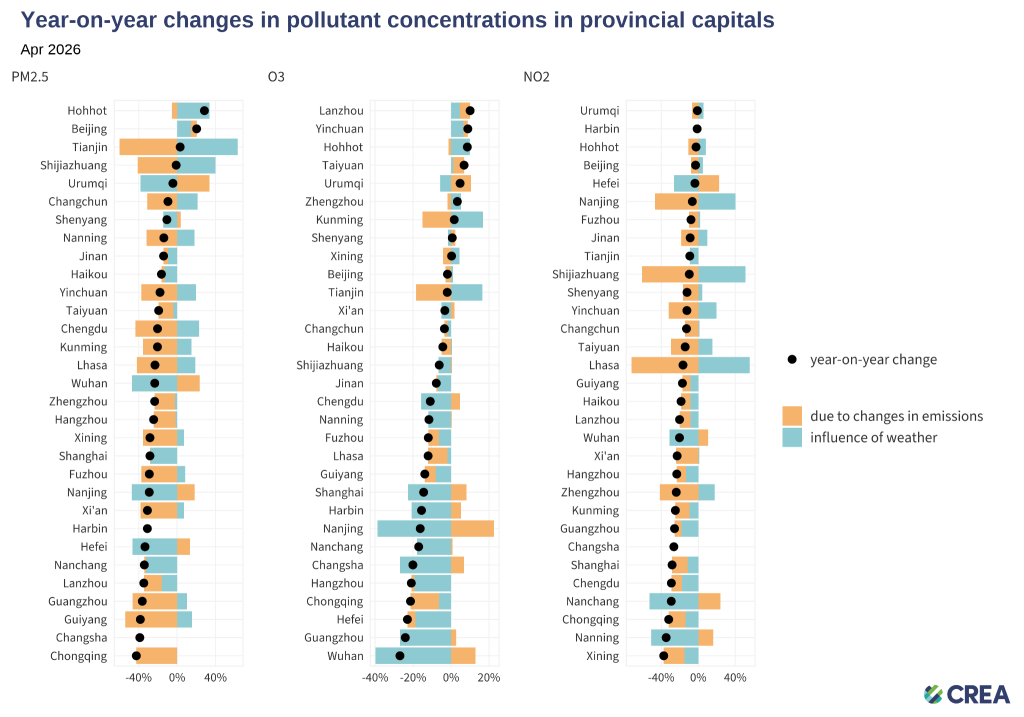
- Emission-driven increases were most visible for PM2.5 and O₃ in Urumqi, Wuhan, and Nanjing. These three cities saw some of the largest emissions-attributable increases in both pollutants: PM2.5 emissions effects rose by about 34% in Urumqi, 24% in Wuhan, and 18% in Nanjing, while O₃ emissions effects rose by about 11%, 13%, and 23%, respectively. However, favourable weather offset much of this increase in Wuhan and Nanjing, leading to overall year-on-year declines.
- Weather strongly shaped PM2.5 outcomes, especially in northern cities. Hohhot and Beijing recorded the largest total PM2.5 increases, with weather being a strong contributing factor in both cities. Tianjin and Shijiazhuang also show a clear weather effect: emissions-related PM2.5 declined sharply, but unfavourable weather largely offset those gains, resulting in only a small increase in Tianjin and a near-flat change in Shijiazhuang.
- NO₂ declined year-on-year across all provincial capitals, but the drivers varied by city.
Worst 7-day air pollution episodes by pollutant
PM2.5 (excluding sandstorms)
| City | Province | Dates | Average concentration | Highest daily concentration |
| Harbin | Heilongjiang | Mar 28 – Apr 03 | 119.5219 | 260.4488 |
| Sihua | Heilongjiang | Mar 28 – Apr 03 | 138.4387 | 299.288 |
| Jixi | Heilongjiang | Mar 27 – Apr 02 | 135.5379 | 266.9255 |
| Jilin | Jilin | Mar 26 – Apr 01 | 122.1554 | 242.3472 |
| Qitaihe | Heilongjiang | Mar 27 – Apr 02 | 120.8128 | 175.7083 |
Sandstorms (PM2.5 )
| City | Province | Dates | Average concentration | Highest daily concentration |
| Wuwei | Gansu | Apr 17 – Apr 23 | 40.3036 | 90.875 |
| Jinchang | Gansu | Apr 17 – Apr 23 | 35.4618 | 71.7727 |
| Zhangye | Gansu | Apr 17 – Apr 23 | 33.7289 | 68.6042 |
| Bayan Nur | Inner Mongolia | Apr 08 – Apr 14 | 33.5417 | 70.5625 |
| Zhongwei | Ningxia | Apr 14 – Apr 20 | 28.5444 | 138.5285 |
Ozone
| City | Province | Dates | Average concentration | Highest daily concentration |
| Dongying | Shandong | Apr 12 – Apr 18 | 173.4345 | 194.9583 |
| Chongzuo | Guangxi | Apr 06 – Apr 12 | 167.1786 | 180.25 |
| Zibo | Shandong | Apr 11 – Apr 17 | 166.0327 | 210.1875 |
| Pu’er | Yunnan | Apr 12 – Apr 18 | 157.2143 | 175.1875 |
| Zaozhuang | Shandong | Mar 26 – Apr 01 | 156.1179 | 185.225 |
NO2
| City | Province | Dates | Average concentration | Highest daily concentration |
| Yangzhou | Jiangsu | Mar 26 – Apr 01 | 43.3249 | 62.960 |
| Tianjin | Tianjin | Mar 26 – Apr 01 | 41.6382 | 59.7938 |
| Harbin | Heilongjiang | Mar 26 – Apr 01 | 40.3574 | 66.8439 |
| Rizhao | Shandong | Mar 26 – Apr 01 | 38.3647 | 50.1508 |
| Yulin | Shaanxi | Mar 26 – Apr 01 | 38.2423 | 57.6359 |
Unit: µg/m3
Relevant analysis by CREA:
- China’s air pollution control enters ‘deep water’ phase
- Why is China’s air pollution shifting west?
- China’s coal-to-chemicals growth risks climate goals
- Why China should get tougher on smog
- Carbon-intensive industries are worsening China’s ozone pollution