By Vaibhav Raghunandan, EU Russia Analyst & Research Writer; Lauri Myllyvirta, Lead Analyst; Panda Rushwood, Data Scientist
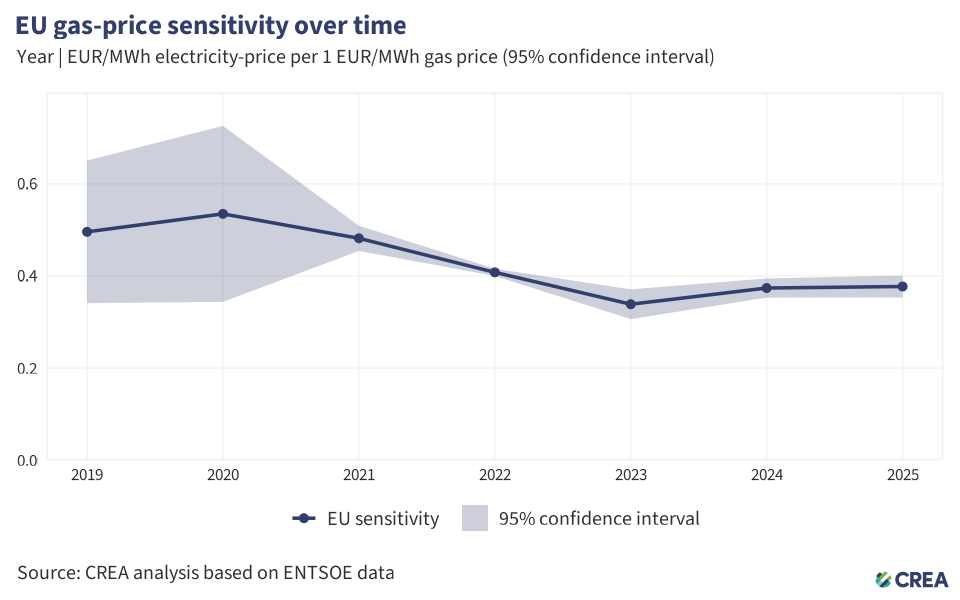
Figure 1 — EU gas price sensitivity over time
On 28 February 2026, the day Israel and the US launched their first strikes on Iran, European gas storage stood at 30% capacity, with nine of the 27 member bloc recording storage levels below the EU average.
Within two days of those first strikes, Dutch TTF prices rose by 68% to EUR 52.8/MWh — the highest levels in two years — as global markets reshuffled to accommodate for the loss of Qatar LNG from the supply chain. With Asian markets competing for cargoes that were usually picked up by Europe, US LNG exports to Asia doubled in volumes month on month in March, while deliveries to the EU dropped by 11%.1
While gas prices continue to fluctuate — linked almost directly to the social media movements of the White House — EU countries remain concerned about refilling gas storage levels. The bloc’s energy Commissioner recommended that countries fill their stocks steadily over the summer to ‘mitigate pressure on prices and avoid end-of-summer rush’ while the European Central Bank has clearly linked price instability to the bloc’s dependence on fossil fuels.
Despite the sharp rise in prices and fears over supplies, CREA analysis found that the bloc remains better protected from price sensitivity than in 2022 — the last energy crisis for the bloc in the aftermath of Russia’s full-scale invasion of Ukraine.
Based on energy demand and electricity generation trends recorded in 2025, the EU could save EUR 5.8 bn in 2026, simply due to clean energy deployment that displaces expensive gas through the year. This figure would be significantly higher if gas prices weren’t responsible for setting the price in many countries, due to the EU’s marginal pricing mechanism.
In 2025, every EUR 1/MWh rise in gas prices led to a EUR 0.37 per MWh rise in electricity prices — an 8% reduction from 2022. This is directly linked to decoupling from gas and investments in clean energy — whose share towards electricity generation in the EU grew by 14% in 2025, compared to 2022.
Every single EU Member State has seen their sensitivity to gas price movements reduce in 2025 when compared to 2019, while at the same time there has been, on average, a 28% increase in clean energy’s share in power generation.
Consumers in the five EU countries (Denmark, Finland, France, Sweden and Slovakia) with the highest clean energy share in their electricity mix will save up to EUR 8.5 bn on their bills this year, compared to those with the dirtiest energy mix (Poland, Italy, Greece, Estonia, the Netherlands). Their savings will be 58% more than the five countries still hooked on fossil fuels.
This estimation is based on consumption remaining the same this year, as in 2025, and accounting for higher prices and their sensitivity to them this year.
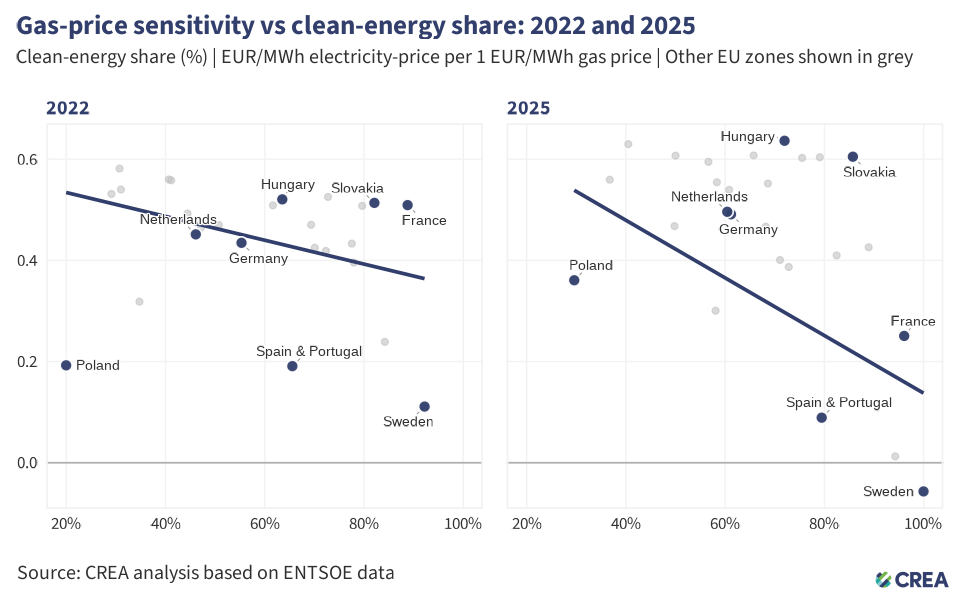
Figure 2 — Country wise gas price sensitivity and clean energy share over time
Sweden is the least sensitive to gas price shocks in their electricity market, based on data from 2025. On average, for every EUR 1 rise in the price of gas, Sweden records a mere EUR 0.04/MWh rise in wholesale electricity prices. While they are one of the nine countries currently with gas storage significantly below the EU average, their lack of reliance on the source for power — with 99% of their electricity met with clean energy — further insulates the electricity market from price shock.
Countries like Spain and Portugal — with harmonized electricity pricing, regulations and infrastructure as part of the Iberian Electricity Market (MIBEL) — have seen a 21% growth in clean energy in 2025, compared to 2022. This has largely been led by a 74% growth in solar, which contributed almost a fifth to its total power generation — equalling gas — in 2025.
In this same period of time, the two countries’ sensitivity to gas price shocks dropped by 53%. In 2025, for every EUR 1 rise in the price of gas, Spain and Portugal’s joint production zone saw a EUR 0.089 rise in price per MWh — the third lowest in the bloc.
France also recorded a sharp reduction in their sensitivity to gas prices, chiefly due to a growth in clean energy since 2022. An 8% growth in France’s share of clean energy towards power between 2025 and 2022, saw sensitivity to gas halved.
France’s reliance on nuclear energy, which also sets the marginal price domestically. Hydro power is the main source for flexibility and makes the country less reliant on gas for balancing load, thereby reducing the price spikes of the commodity on the market.
In sharp contrast, the Netherlands, despite recording a 31% increase in clean power generation, remains more sensitive to gas prices than 2022. A key reason for this anomaly in the Netherlands is that while solar and wind’s share in electricity is higher than the EU average, gas continues to be utilised as the single largest source for electricity in the country. Their sensitivity is also linked to being highly integrated in the European gas market — often as a price taker — and therefore susceptible to shocks transmitted by neighbours like Germany.
Furthermore, gas has traditionally played an outsized role in centralised electricity production in the Netherlands (22% of total), with clean energy sources, specifically solar, playing a bigger role in decentralised electricity generation. This means that while solar is utilised heavily through the daytime hours, other sources need to be ramped up in the evenings requiring flexibility that is provided by gas .
Poland, is another anomaly to the overall EU trend, registering significant growth in clean energy (+48% year-on-year since 2022) but also seeing their sensitivity to gas prices also remain relatively higher than in 2022. A key reason for this is Poland’s renewed push towards gas powered electricity to replace and reduce coal — which remains essential to over half the total electricity production in the country.
Poland’s redirection towards gas — rather than clean energy sources — has seen power generation from the commodity rise by 132% in 2025, compared to 2022. This increased dependency, which constituted 13% of the total in 2025, has meant that sensitivity to gas prices have also risen by 87% to EUR 0.36/MWh for every EUR 1 shift in the price of gas.
In Central Europe, Hungary’s electricity prices show a greater sensitivity to gas prices, compared to 2022, rising by 22% year-on-year. While clean energy generation has grown (+13%) in Hungary, the growth in solar (which doubled when compared to 2022, among the biggest shifts in the EU) has highlighted alack of grid connection capacity that has meant they are forced to rely on gas power to maintain stability.
Because European markets use a marginal pricing methodology, gas power often sets the baseline for all electricity — more so considering nuclear and solar have low baseloads and almost zero marginal costs.
In summary, clean energy’s ability to reduce sensitivity is best when it holds the single largest share in electricity generation and forms a major part of the baseload — therefore displacing gas as the price setter in the market.
| Methodology CREA analysed hourly European electricity-market data from 2019–2025 across a fixed set of 32 EU bidding zones. All source data (prices, load, generation, imports, gas, carbon, and FX) was harmonised to a common time basis and currency. Source-level cleaning, and filtered observations were applied to ensure consistent data quality. We then identified groups of bidding zones whose prices moved closely together and combined them into stable regions based on predefined thresholds for correlation, dispersion, and price divergence. Within these regions, we aggregated variables and applied limited winsorisation to reduce the influence of extreme observations. We then estimated how strongly electricity prices responded to gas prices, and how this relationship varied with clean-energy share. To do this, we used two complementary regression specifications based on hourly data with controls for demand, imports, carbon prices, and recurring time patterns. First, a single model was estimated separately for each year, allowing the gas-price effect to vary over time and with clean-energy share. Second, a single pooled model allowed the gas-price effect to vary across both regions and years, producing region-year–specific estimates of gas-price sensitivity. |