By Qi Qin, China Analyst; Danny Hartono, Data Scientist; with contributions from Lauri Myllyvirta, Lead Analyst
In March, seasonal factors pushed up power sector emissions while industrial emissions fell sharply; meanwhile, thermal power commissioning in the first two months of 2026 surged more than 400% year on year to a record high.
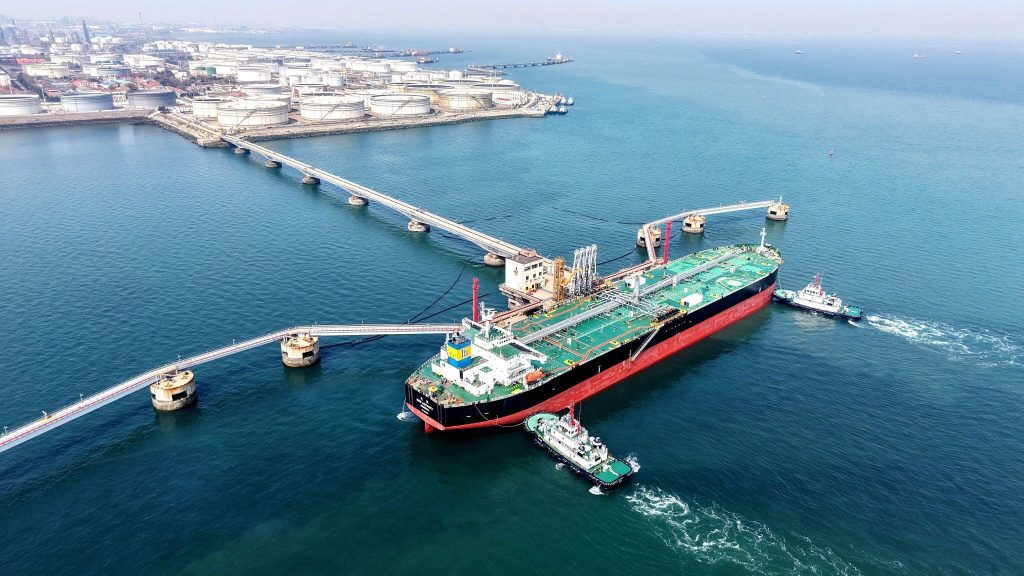
Imported crude oil tanker docked at the crude oil terminal of Qingdao Port, Shandong, March 2026. Photo: Alamy.
Key findings
- Weaker wind and nuclear output, combined with a low base a year earlier, drove a rebound in coal- and gas-fired generation in March, leading to a seasonal rise in power sector emissions.
- Shipping disruptions linked to the Strait of Hormuz closure reduced China’s oil and gas imports and put pressure on refining margins and fuel trade, while domestic fossil fuel output remained broadly stable.
- Weak steel demand and lower steel and cement output drove a sharp decline in industrial emissions.
- Thermal power commissioning in the first two months of 2026 surged over 400% to a record high.
- Solar cell output fell year on year, largely due to a high base and shifting export patterns, while strong demand from energy storage and exports drove a sharp rise in battery output.
- NEV production returned to growth in March but remained weak for the quarter overall, while exports of new energy passenger vehicles far outpaced those of conventional fuel vehicles.
Power sector emissions rise on seasonal factors
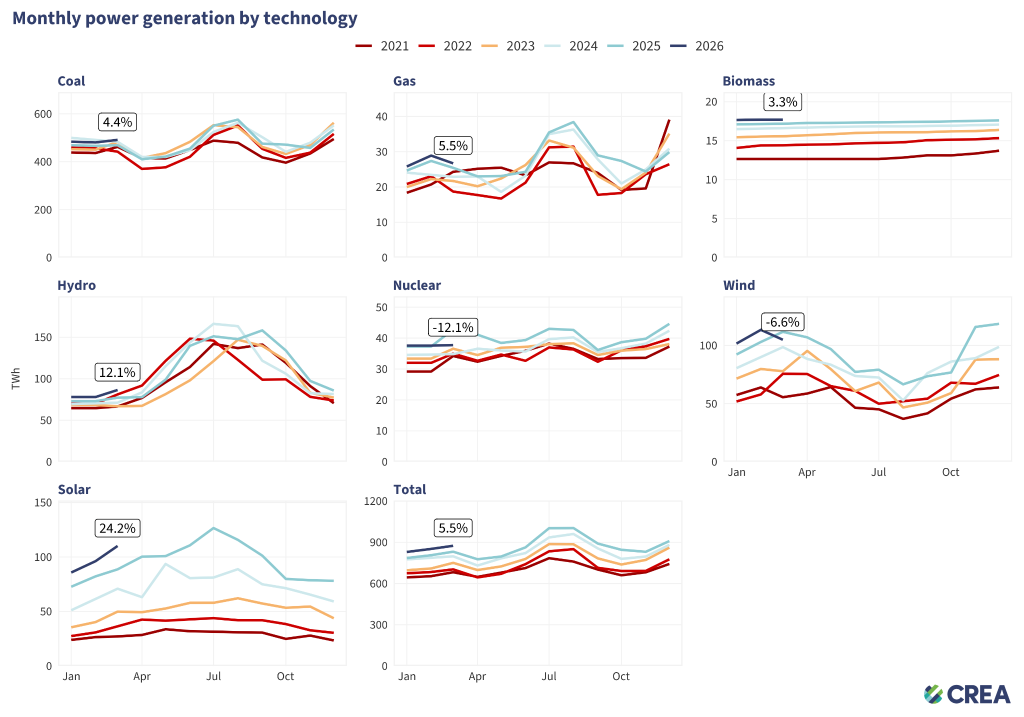
- In March, power generation by large-scale power producers rose 1.4% year on year, while total power generation* is estimated to have increased by 5.5%.
- Coal and gas power increased by 4.4% and 5.5%, respectively, due to weak output from wind and nuclear, and a low base in Q1 2025, which saw a 5% drop.
- Solar power generation* increased by 24.2%, while wind power* decreased by 6.6%.
- Hydro grew 12.1% and nuclear declined by 12.1%.
*This is a prediction based on the assumption that there wasn’t a major increase in wind and solar curtailment compared with the same period last year. The National Bureau of Statistics (NBS) underreports wind and solar generation, particularly from rooftop and smaller solar plants. Find CREA’s methodology for power generation here.
Oil and gas imports declined amid shipment disruptions
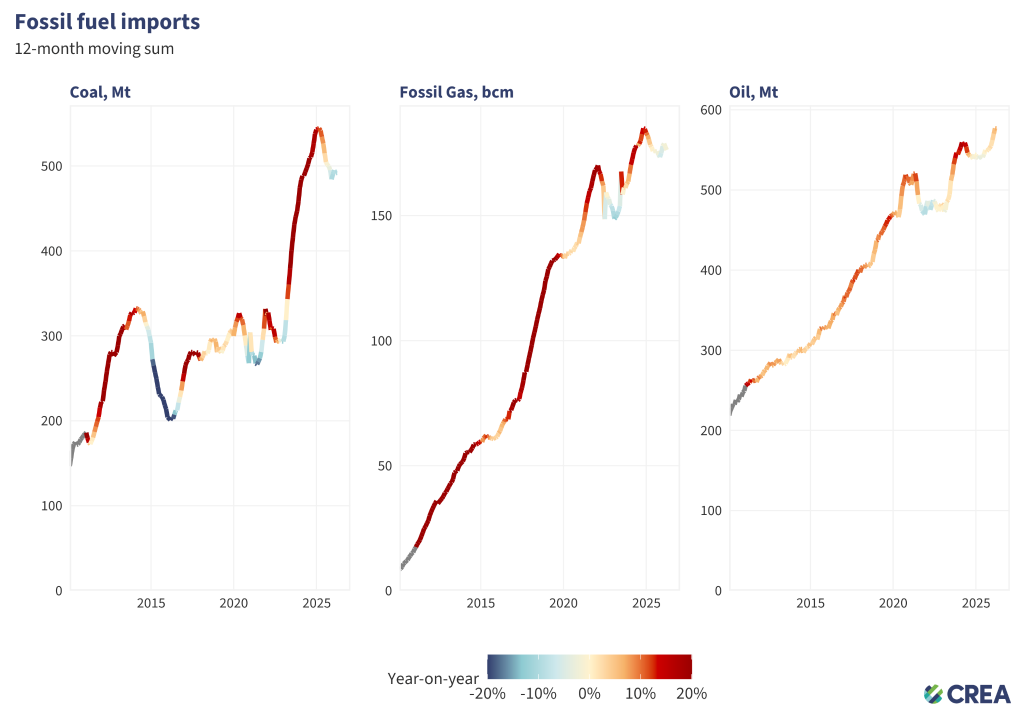
- China’s coal imports increased by less than 1% year on year in March 2026. For the first quarter as a whole, import volumes rose 1.3%, but the total import value fell 6% year on year.
- China’s crude oil imports fell 3% year on year in March, ending a run of year-on-year growth that had continued since June 2025. In the first quarter, crude oil imports were up 8.9% from a year earlier.
- Natural gas imports fell by around 11% year on year to their lowest level since October 2022, mainly due to disruption to Gulf shipments following the effective closure of the Strait of Hormuz. As a result, cumulative imports so far this year were about 4% lower than in the same period of 2025.
Fossil fuel output remains broadly stable, while refining and fuel trade come under pressure
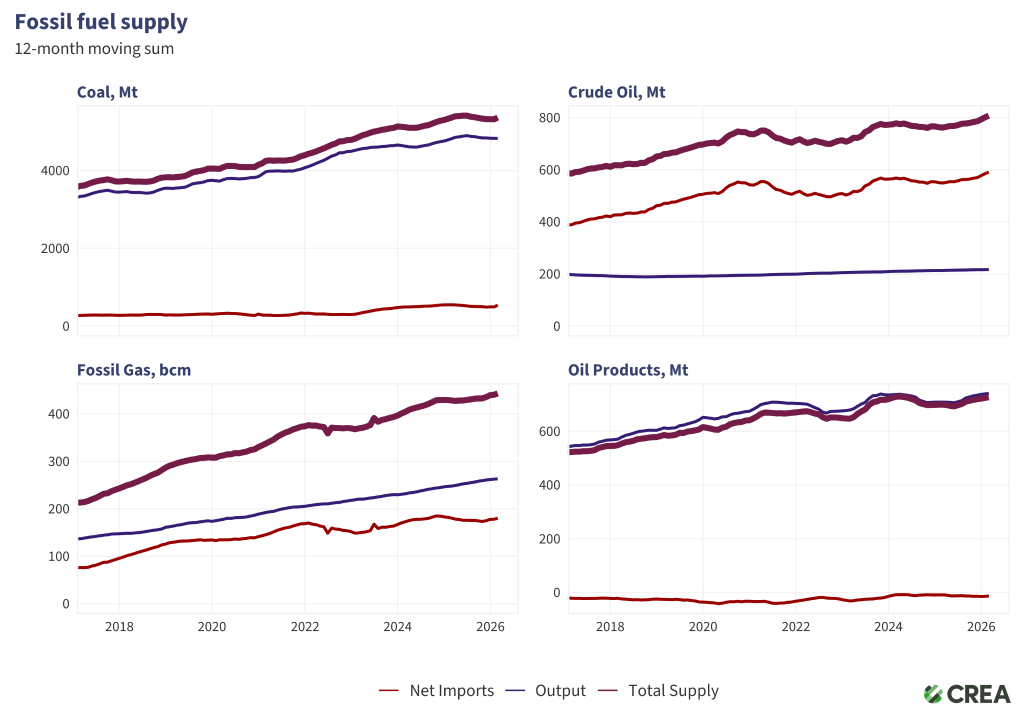
- Coal output was flat year on year in March 2026. In the first quarter, coal production rose 0.1% from a year earlier.
- Domestic natural gas production rose by 3% . Q1 output was also up 3% from a year earlier
- Crude oil production increased by 0.2%. Q1 output increased by 1.3%.
- Crude throughput at refineries rose just 1% year on year in the first quarter as a whole, but fell 2% in March after the closure of the Strait of Hormuz pushed up oil prices and squeezed refining margins. At the same time, refined product exports fell 12% while imports rose 19%. Following the Middle East crisis, China suspended refined fuel exports in March and extended the restriction into April, with limited exemptions for a small number of countries seeking assistance. As one of Asia’s key fuel exporters, the move has broader implications for regional fuel supply.
Industrial emissions fell sharply, driven by steel and cement
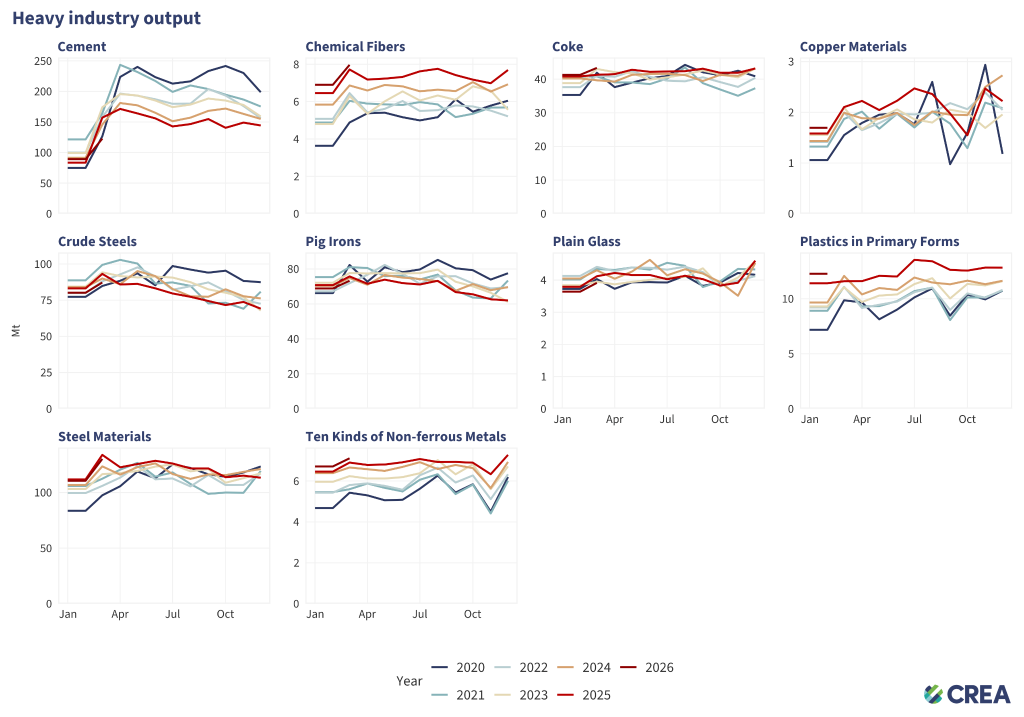
- In March, pig iron, crude steel, and steel product output declined 3.3%, 6.3%, and 2.3%, respectively.
- Cement output fell 21% year on year in March, reaching its lowest level for the same period since 2020. Q1 output was down 7.1% year on year, extending the decline in one of China’s most emissions-intensive industrial sectors.
- Chemical fibre and non-ferrous metal output both grew by 2.2%.
- Ethylene production, used as a key feedstock for plastics, grew by 6.8%. Sulfuric acid production, an important input for phosphate fertiliser production, grew by 6.2%.
The steel and cement industries are the largest CO2 emitters in China, when emissions from their electricity use are included. They are also bellwethers of real estate, infrastructure, and other fixed asset investments that play an outsized role in China’s emissions and economy.
Tangshan blast furnace activity nears multi-year high, while steel demand remains weak
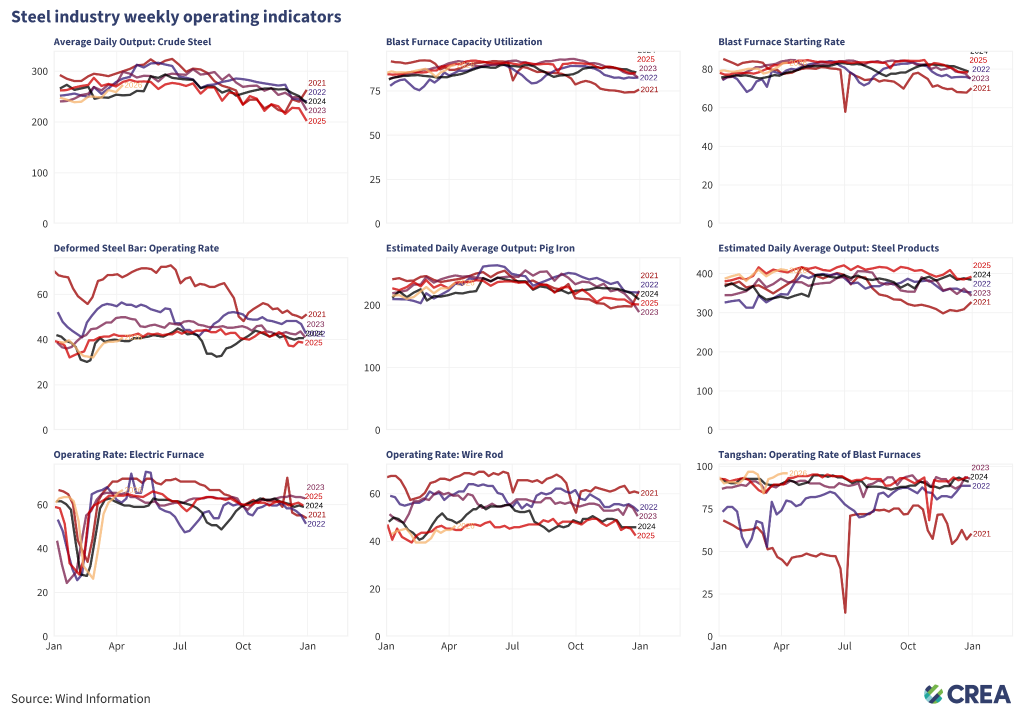
- In the first week of April, blast furnace for steel production activity strengthened further, with the starting rate rising to 83.2% and utilisation reaching 90% — both flat from a year earlier but the highest levels seen so far this year. Electric furnace operating rates also rose to 66.7%, slightly above the same period last year.
- Steel production showed little sign of a meaningful rebound in the first two weeks of April. Although inventories fell more sharply, steel demand still remained weak.
- The operating rate of blast furnaces in Tangshan, China’s ‘steel capital’ and a significant source of air pollution in Beijing, reached 96%, close to the highest level since 2021.
Hebei Province industrial output is a bellwether of national priorities: when air quality and emissions are the priority, it is the most tightly regulated area due to its impact on Beijing’s pollution levels.
Thermal power commissioning surged over 400% to a record high
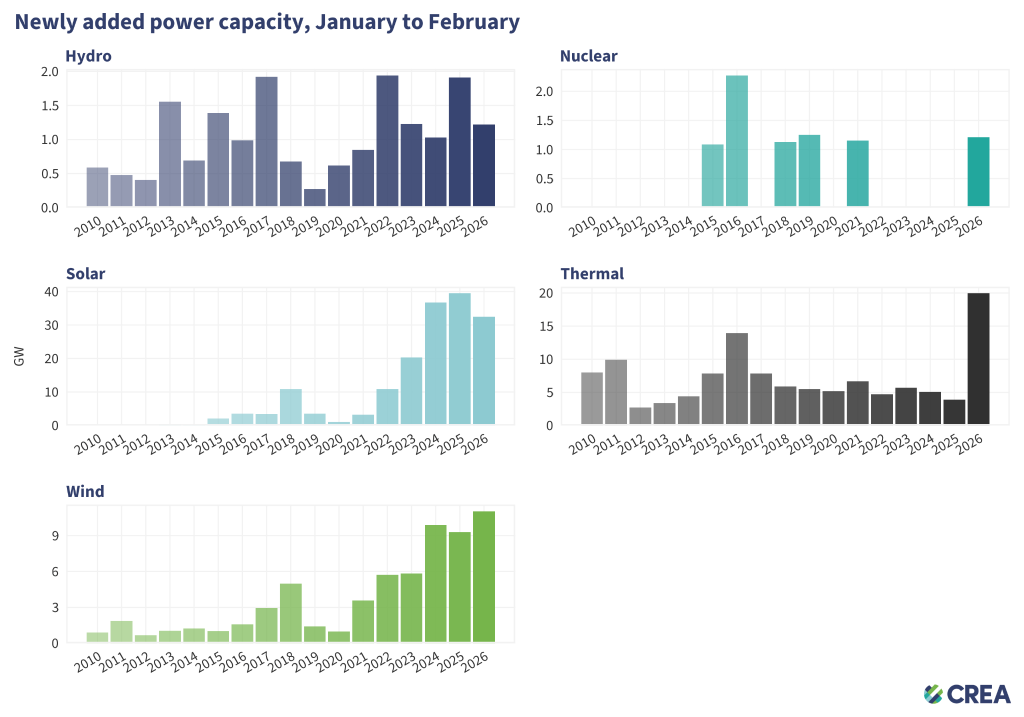
In the first two months of 2026, China added:
- 32.5 gigawatts (GW) of solar power capacity, down 18% from last year.
- 11 GW of wind power capacity, up 19% from last year.
- 20 GW of thermal power capacity, up 414% from last year.
- 1.2 GW of hydro power capacity, down 36% from last year.
- 1.2 GW of nuclear power capacity.
Read more:
Clean energy drove more than a third of China’s GDP growth in 2025
Why China is still building new coal–and when it might stop
Built to peak: Coal power expansion runs out of room in China
Large-scale clean energy bases took the lead in wind and solar installations
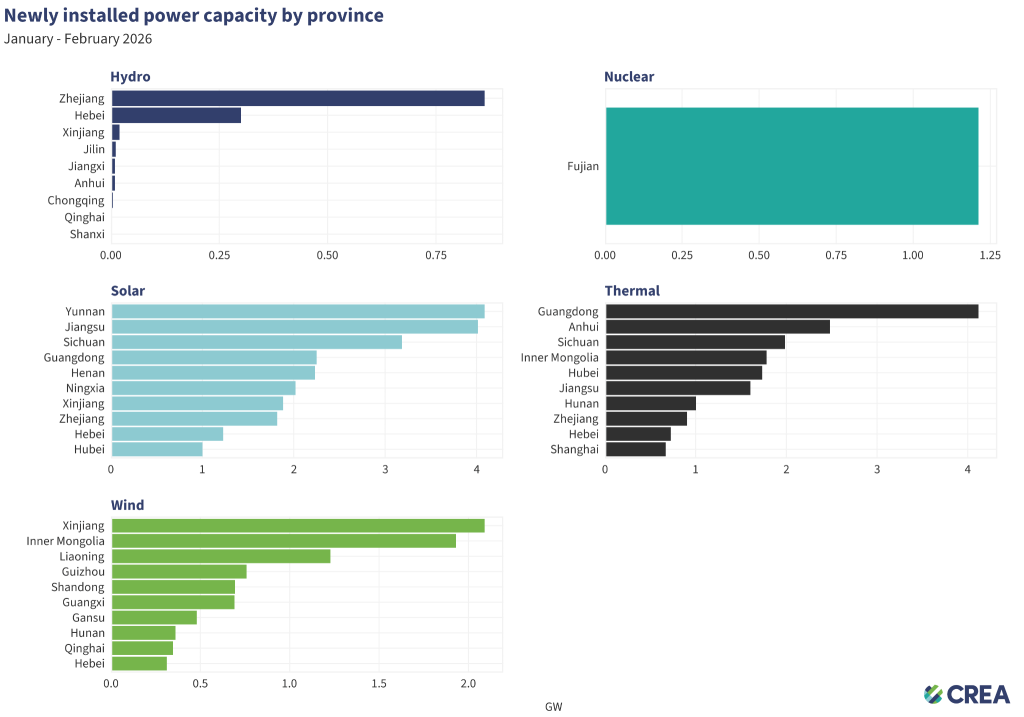
- Solar power installations are led by Yunnan, Jiangsu, and Sichuan. The strong showing of Yunnan and Sichuan is notable, as both are already major hydropower provinces and are set to host new hydro-wind-solar bases under the 15th Five-Year Plan.
- Xinjiang, Inner Mongolia, and Liaoning lead in wind development. These provinces are also part of the large-scale clean energy bases initiative under the 15th FYP.
- Thermal (coal) power additions accelerated in Guangdong, Anhui, and Sichuan. Guangdong has led the country in new thermal power capacity additions in recent years, and its coal-fired generation continued to rise in 2025. By contrast, coal generation declined in both Anhui and Sichuan despite the increase in new capacity.
Read more: China’s north cleans up its power mix as the south lags
Solar cell output declined amid a high base and shifting export patterns
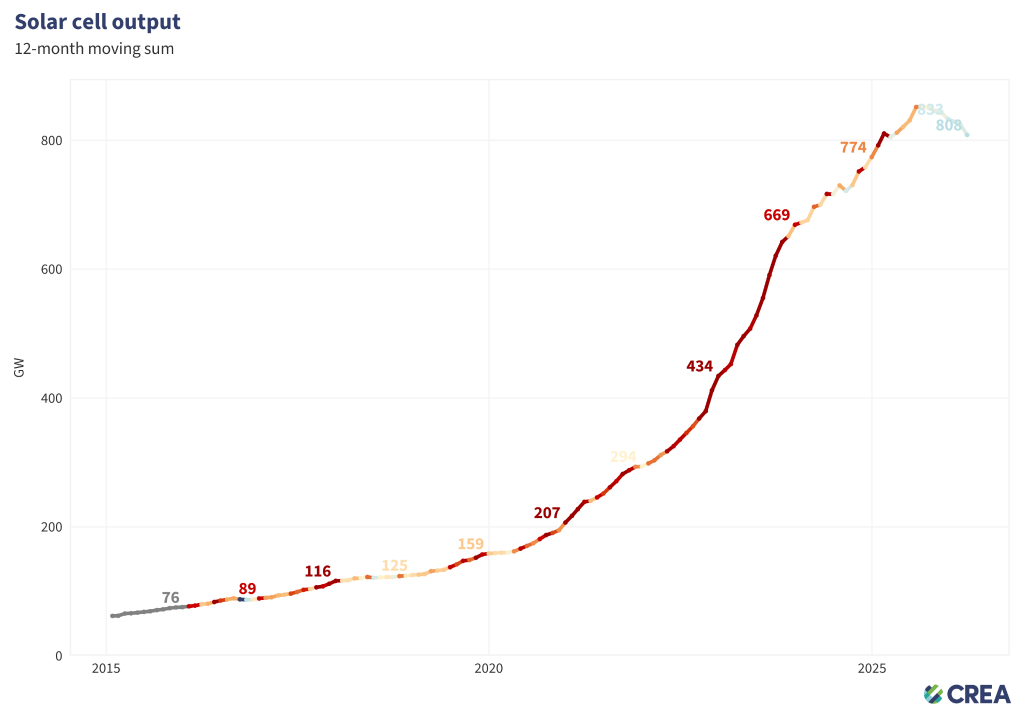
Solar cell output fell 12%, but from a base of frantic demand during the early 2025 rush. Output remained above 2024 levels, and China has been exporting more polysilicon and wafers instead of producing cells out of them — detailed exports data that has yet to be released will be required for a full picture.
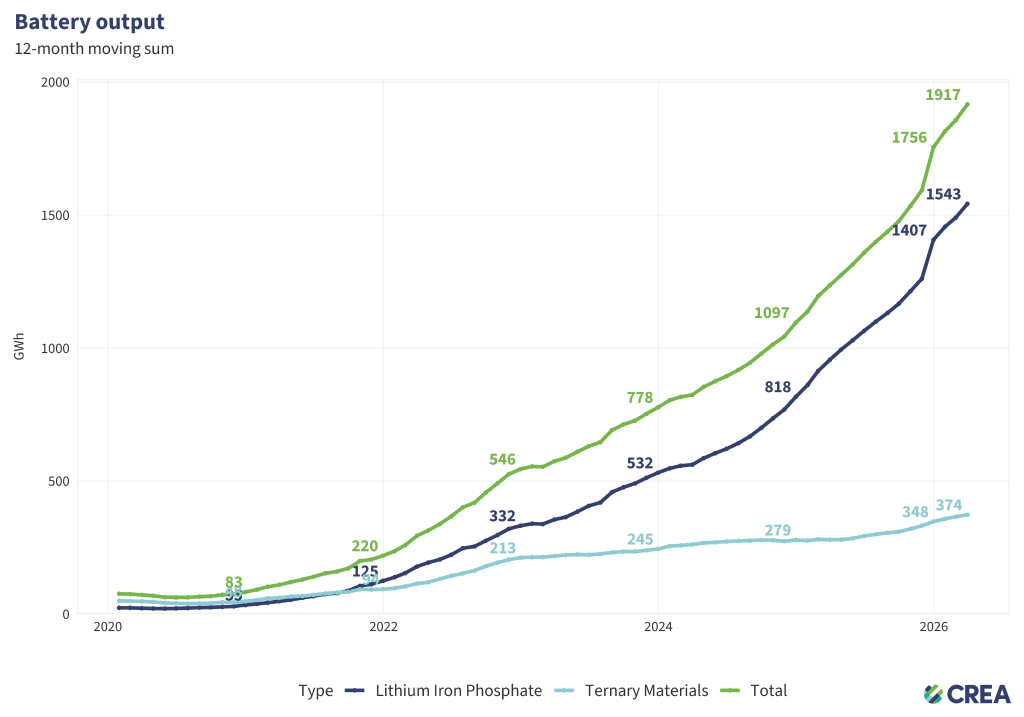
In March, total battery output reached 178 GWh, up 50% year on year, supported by strong demand from the energy storage sector and export.
NEV production edged up while exports accelerated
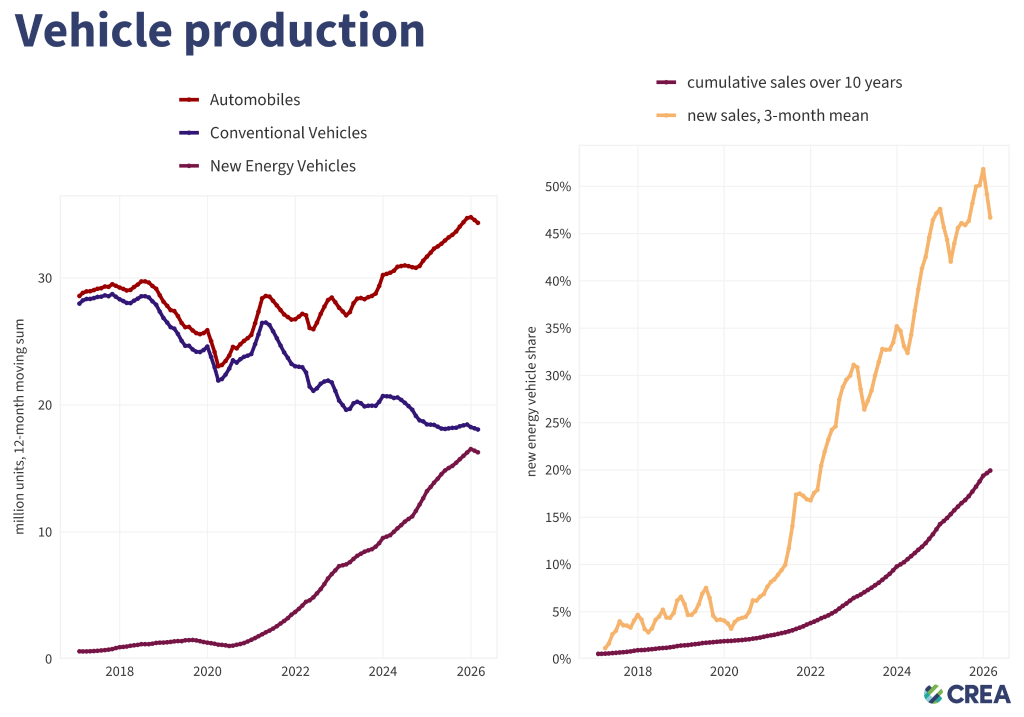
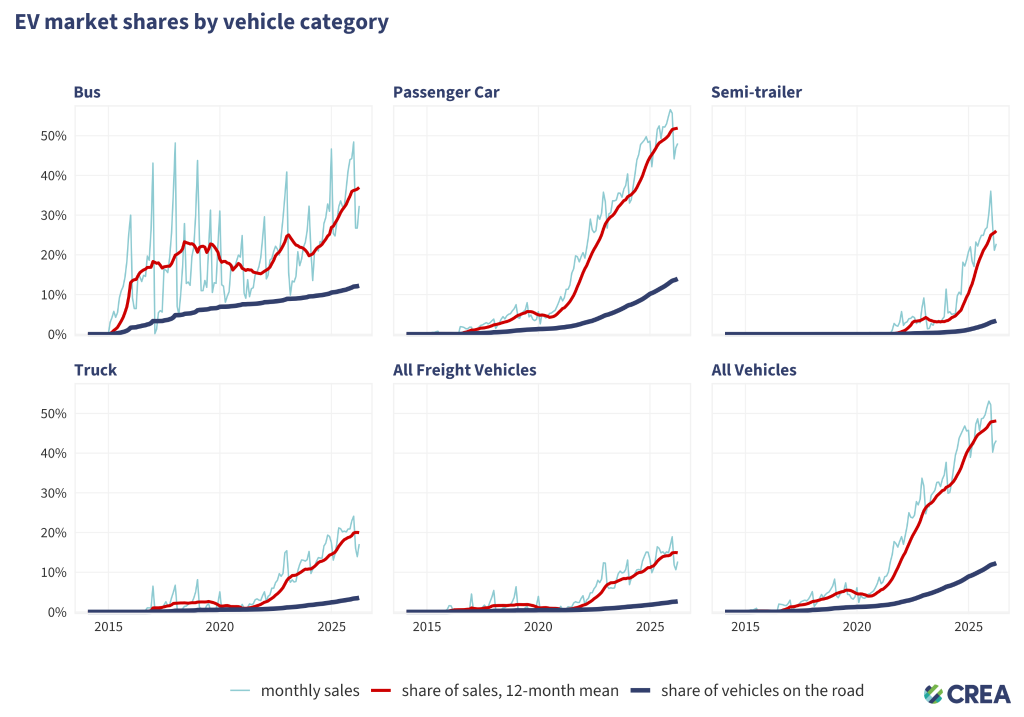
- New Energy Vehicles (NEV) production returned to growth in March, rising 1.2% year on year, although first-quarter output was still down 6.3%. Overall vehicle production also declined in the first quarter, leaving the NEV share of total vehicle output broadly unchanged.
- Export performance was much stronger: in March, exports of new energy passenger vehicles surged 140% year on year, far outpacing the 37% growth in exports of conventional fuel passenger vehicles.
Relevant analysis by CREA:
Reclaiming credibility in China’s steel industry: Climate ambition, financial resilience, and market trust
China’s 15th Five-Year Plan — Implications for climate and energy transition
Analysis: Clean energy drove more than a third of China’s GDP growth in 2025
Analysis: China’s CO2 emissions have now been ‘flat or falling’ for 21 months
Analysis: Coal power drops in China and India for first time in 52 years after clean-energy records
Built to peak: Coal power expansion runs out of room in China
China’s Climate Transition: Outlook 2025