By Vaibhav Raghunandan and Petras Katinas
Vessel sanctions bite Russian oil, with G7+ vessels responsible for almost half of all oil deliveries in April
Key findings
- In April, Russia’s monthly fossil fuel export revenues saw a 6% month-on-month drop, to EUR 585 mn per day, while export volumes marginally increased by 1%.
- Almost half (47%) of Russia’s oil exports in April were transported on G7+ tankers, four percentage points higher than in March. Since January, the share of ‘shadow’ tankers in transporting Russian oil has dropped from 65% to 53%.
- ‘Shadow’ tanker use for Russian crude oil transport fell from 81% in January to 65% in April.
- China’s imports of seaborne Russian crude rose by 8% month-on-month to the highest levels since October 2024. This rise in Russian imports is mainly driven by the drop in global oil prices in April, and Chinese refineries taking advantage to boost their inventories.
- A lower price cap of USD 30 per barrel would have slashed Russia’s oil export revenue by 40% (EUR 138 bn) from the start of the EU sanctions in December 2022 until the end of April 2025. In April, a USD 30 per barrel price cap would have slashed Russian revenues by 38% (EUR 4.13 bn).
Trends in total export revenue
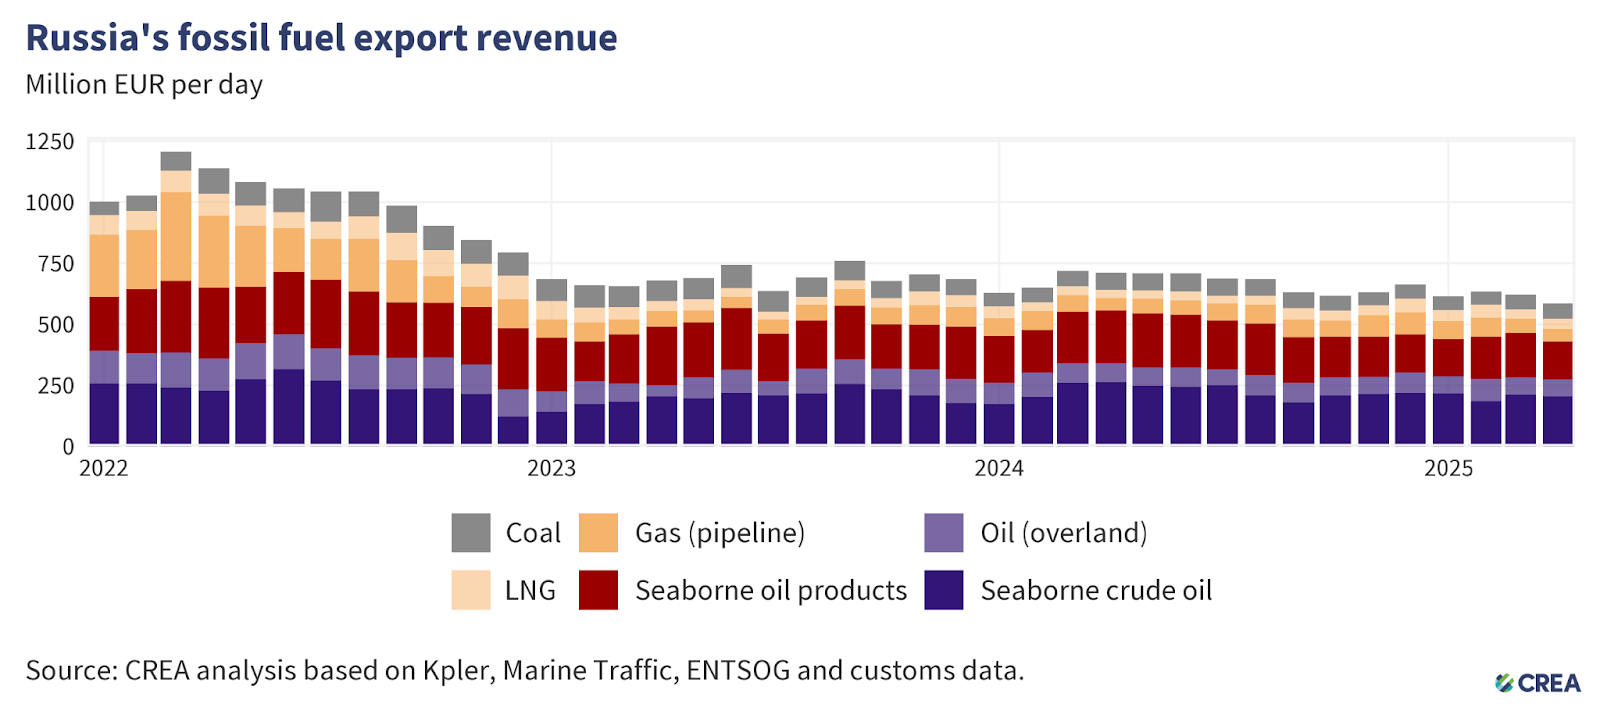
- In April, Russia’s monthly fossil fuel export revenues saw a 6% month-on-month drop, to EUR 585 mn per day, while export volumes marginally increased by 1%.
- Revenues from seaborne crude oil decreased by 14% month-on-month to EUR 204 mn per day, while export volumes surged by 3%.
- Russian revenues from crude oil via pipeline dropped 2% to EUR 70 mn per day.
- Russian liquefied natural gas (LNG) revenues increased by 1% to EUR 40 mn per day, and volumes surged by 7%.
- Revenues from pipeline gas decreased by 10% to EUR 52 mn per day, and the volume of pipeline gas exports also dropped by 4%.
- Revenue from seaborne oil products decreased by 14% month-on-month to EUR 155 mn per day.
- Russian revenues from coal exports increased by 10% to EUR 63 mn per day.
Who is buying Russia’s fossil fuels?
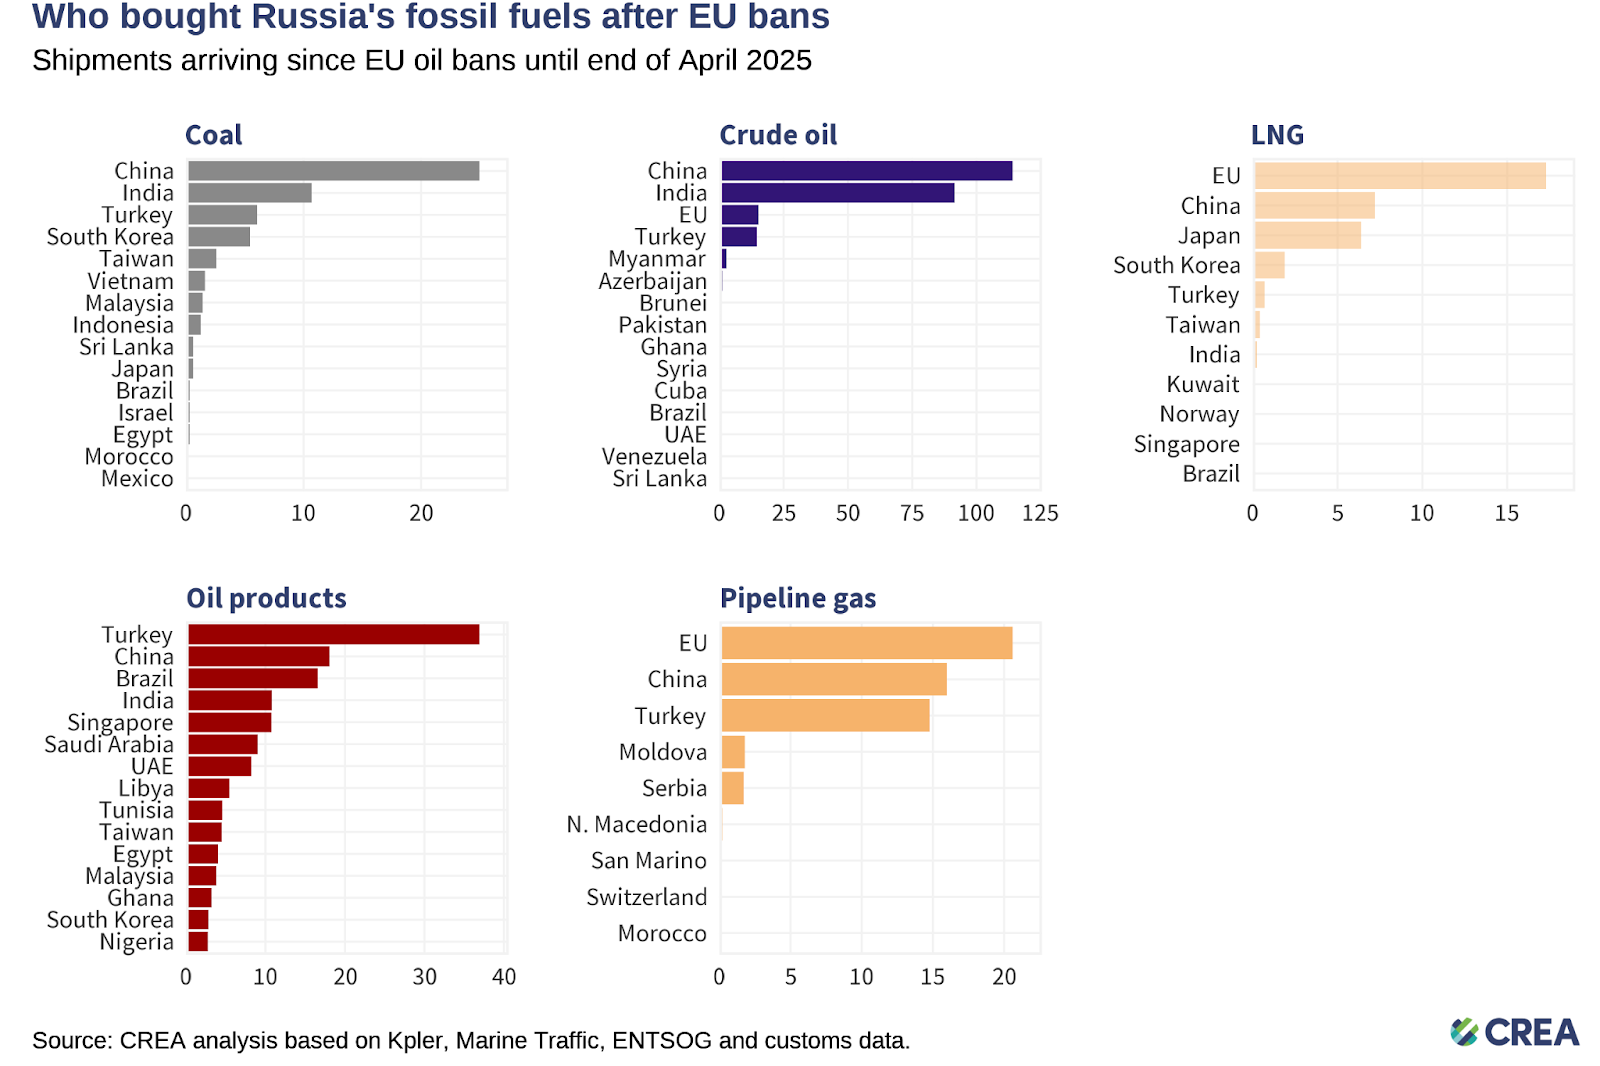
- Coal: From 5 December 2022 until the end of April 2025, China purchased 44% of all of Russia’s coal exports. India (19%), Turkiye (11%), South Korea (10%), and Taiwan (5%) round off the top five buyers list.
- Crude oil: China has bought 47% of Russia’s crude exports, followed by India (38%), the EU (6%), and Turkiye (6%).
- Oil products: Turkiye, the largest buyer, has purchased 26% of Russia’s oil product exports, followed by China (13%), and Brazil (12%).
- LNG: The EU was the largest buyer, purchasing 50% of Russia’s LNG exports, followed by China (21%), and Japan (19%).
- Pipeline gas: The EU was the largest buyer, purchasing 37% of Russia’s pipeline gas, followed by China (29%), and Turkiye (27%).
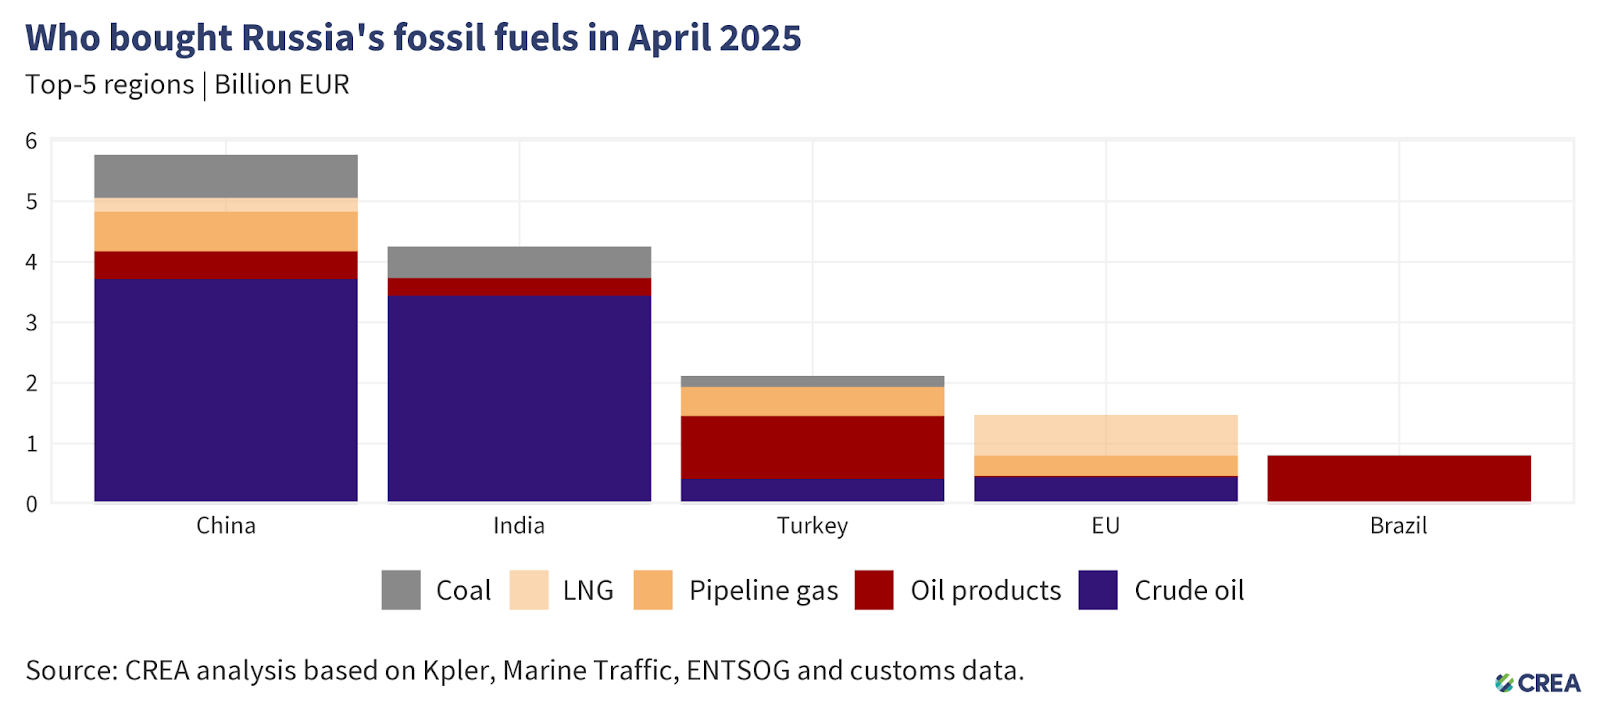
- China remained the largest buyer of Russian fossil fuels in April. Their imports accounted for almost 40% (EUR 5.7 bn) of Russia’s monthly export earnings from the top five importers. Crude oil comprised 64% (EUR 3.7 bn) of China’s imports from Russia.
- China’s imports of seaborne Russian crude rose by 8% month-on-month, and were the highest levels since October 2024. At the same time, China’s global seaborne crude imports saw a 2% reduction month-on-month — their lowest levels this year — with Russian crude comprising 12% of the total imports.
- This rise in Russian imports is strongly indicated as being driven by the drop in global oil prices in April, with Chinese refineries boosting storage inventories due to the cheap oil on offer.
- Additionally there are suggestions that China’s increased volumes of Russian oil are due to higher STS transfers in waters around Singapore and Malaysia to avoid tankers on OFAC sanctions lists.
- In April, India was the second-largest purchaser of Russian fossil fuels, importing fossil fuels worth EUR 4.2 bn. Crude oil accounted for 81% (EUR 3.4 bn) of these imports.
- India’s global imports of crude oil saw a 11% reduction in April, but Russian volumes stayed stable and constituted 40% of their total imports. Their imports of ESPO grade crude rose to the highest levels in the last two quarters.
- Turkiye was Russia’s third-largest importer of fossil fuels, contributing 15% (EUR 2.1 bn) of the total export earnings from its top five importers.
- Almost half (EUR 1 bn) of Turkiye’s imports from Russia consisted of oil products. Their imports of Russian oil products saw a marginal increase in April to 1.8 mn tonnes. Russian oil products constitute 84% of the country’s total imports of oil products in April, with 74% of those deliveries made to two ports, Marmara Ereglisi and Mersin.
- The EU was the fourth-largest buyer of Russian fossil fuels, with its imports accounting for 10% (EUR 1.5 bn) of the top five purchasers. Almost half of these imports were Russian LNG, valued at EUR 673 mn.
- Brazil bought EUR 812 mn of Russian fossil fuels, of which 98% was oil products and 2% was coal. Brazil’s imports of Russian oil products in April were the highest volumes since May 2024 and the third highest volumes since the invasion of Ukraine.
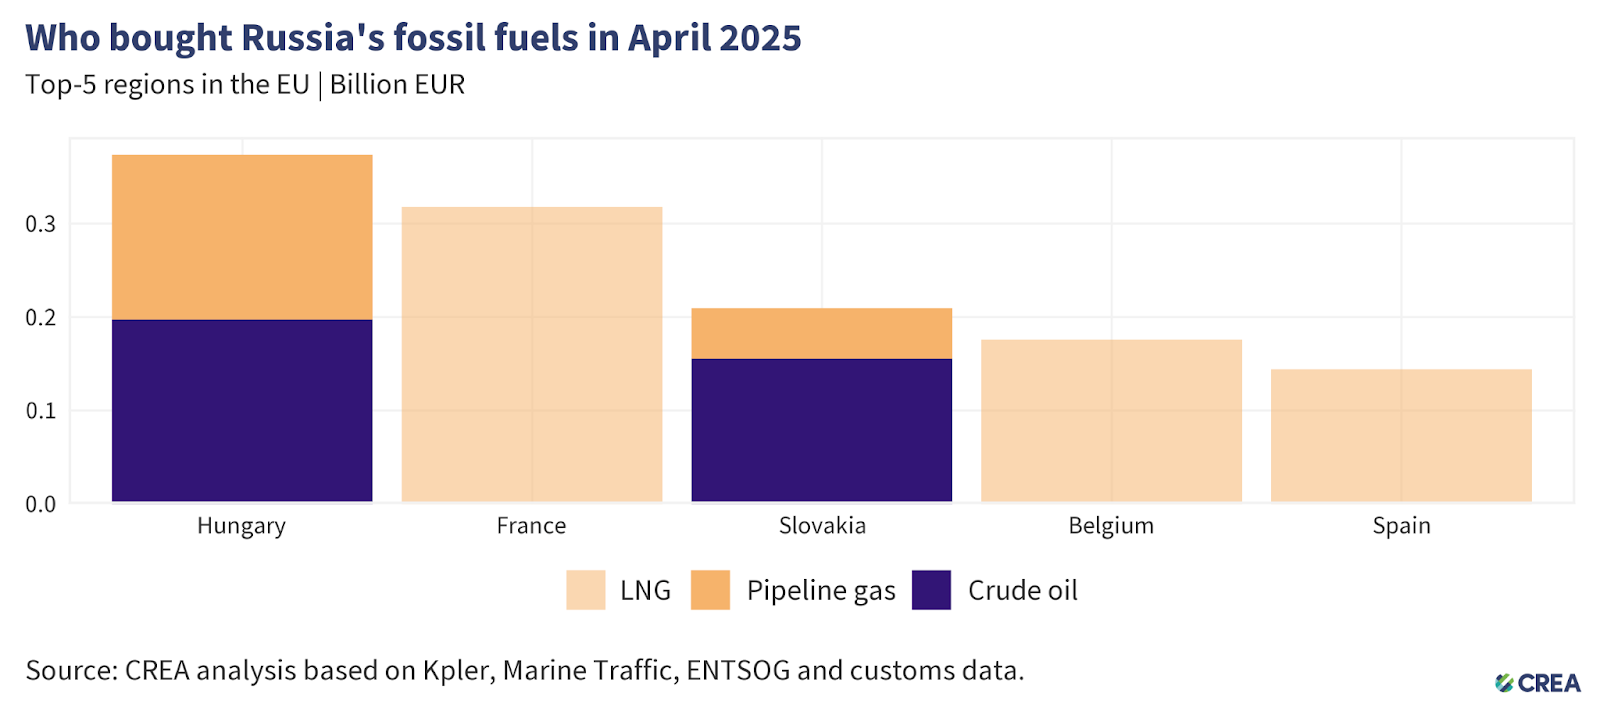
- In April, the five largest EU importers of Russian fossil fuels paid EUR 1.2 bn. The EU does not sanction natural gas, which accounts for over 70% of these imports and is mainly delivered by pipeline or as liquefied gas. The rest was mostly crude oil, which continues to flow to Hungary, Slovakia, and the Czech Republic via the southern branch of the Druzhba pipeline under an EU exemption.
- Hungary was the largest importer, purchasing EUR 373 mn of Russian fossil fuels in April. These included crude oil (EUR 197 mn) and gas via pipeline (EUR 176 mn).
- France was the second-largest importer of Russian fossil fuels within the EU. Its imports, which included Russian LNG, totaled EUR 371 mn. However, the fact that this gas is imported via France does not necessarily mean it is consumed there. A recent study indicates that some Russian LNG entering France through the Dunkerque terminal is delivered to Germany.
- Slovakia, the third-largest buyer within the EU, imported Russian fossil fuels worth EUR 209 mn. 61% of Slovakia’s imports were Russian crude oil, valued at EUR 155 mn and the remaining portion of fossil fuel was pipeline gas, valued at EUR 54 mn. Russian crude oil is refined into oil products and re-exported to Czechia. This is being allowed to continue because Slovakia’s exemption from the ban on exporting oil products made from Russian crude, which ended in December 2024, has been extended until June 2025.
- Belgium was the fourth-highest importer within the EU, purchasing explicitly Russian LNG valued at EUR 175 mn.
- Spain exclusively imported LNG valued at EUR 144 mn.
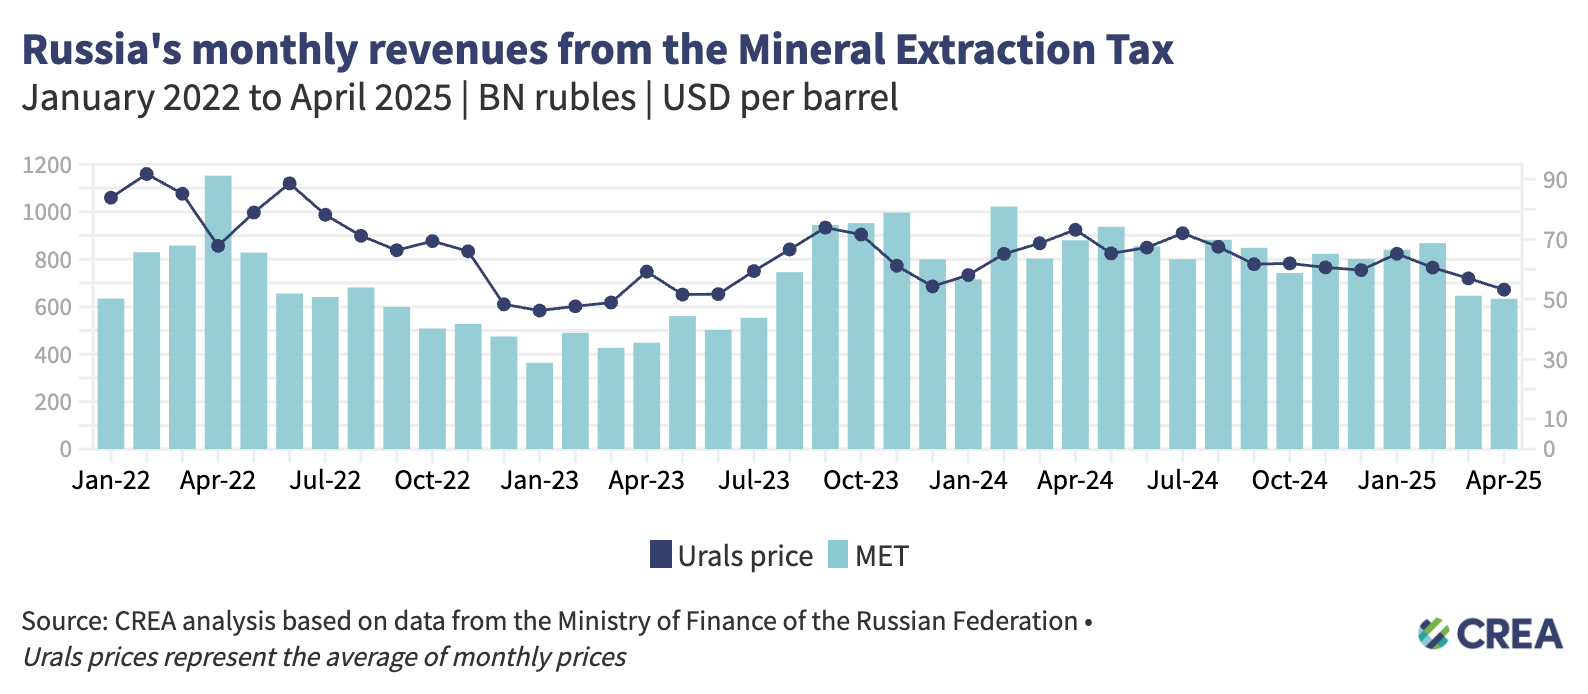
| Russian mineral extraction tax revenues plunge by 28% year-on-year amid falling oil prices and a stronger ruble |
 |
How are oil prices changing?
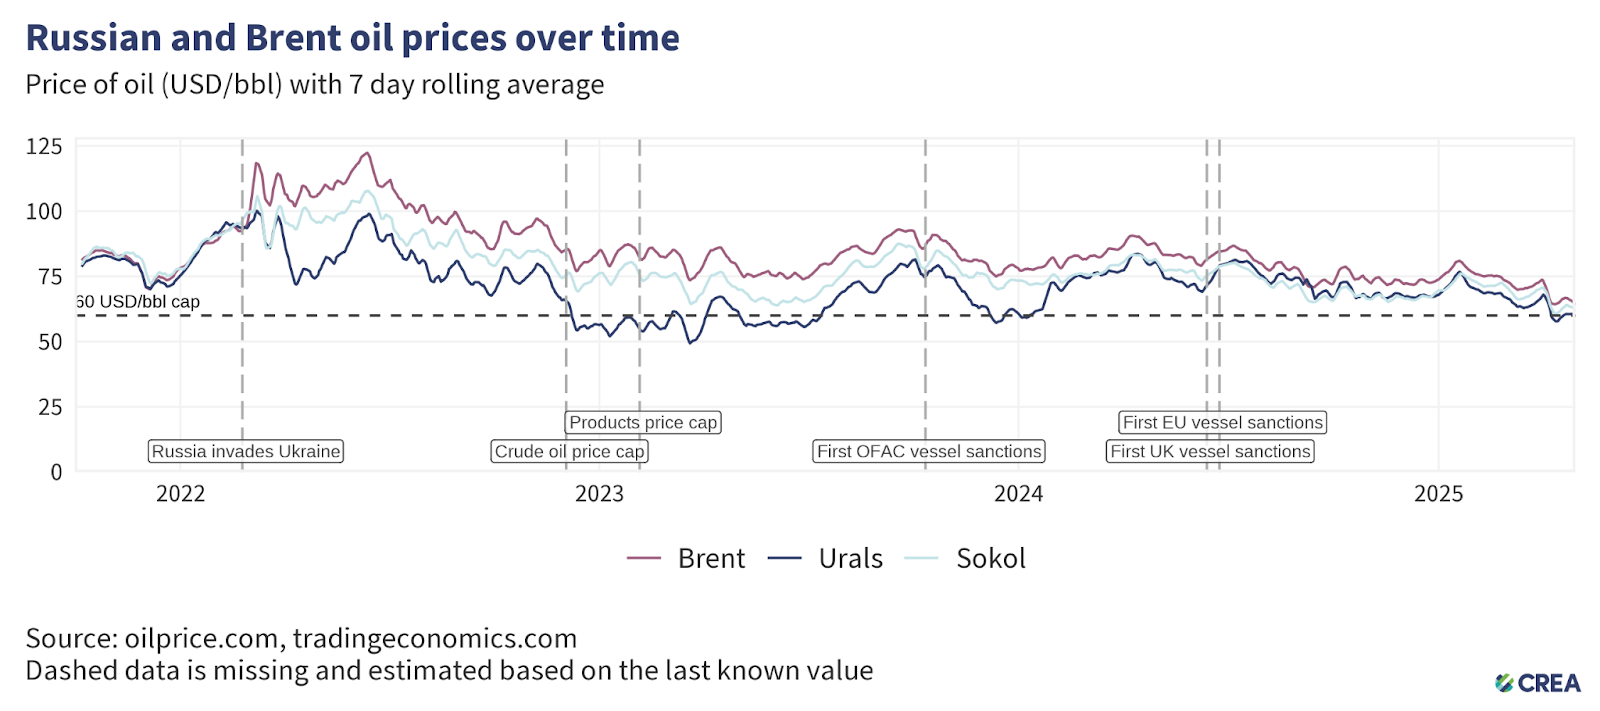
- In April, the average Urals spot price dropped by 7% while staying marginally above the price cap, trading at USD 60.3 per barrel1.
- The monthly average price of Sokol blend of Russian crude oil also dropped by a similar 8% to USD 62.9 per barrel.
- Russian oil prices dropped in conjunction with a global drop in oil prices. The benchmark Brent crude also suffered an 8% month-on-month decrease in April.
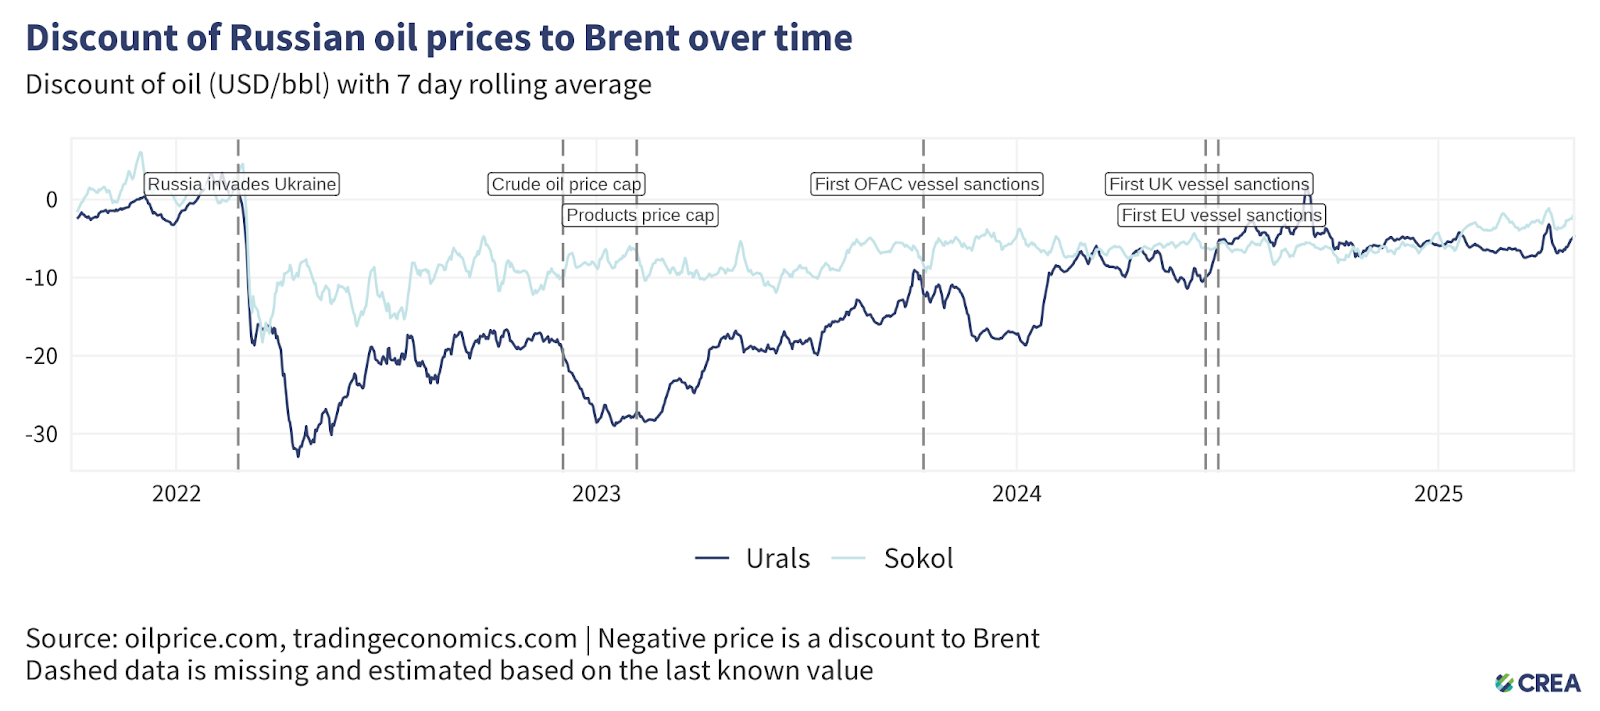
- In April, the discount on Urals-grade crude oil dropped by a significant 20% month-on-month to an average of USD 5.5 per barrel compared to Brent crude oil. In contrast, the discount on the Sokol blend narrowed by 14% to USD 2.7 per barrel.
- Throughout this period, vessels owned or insured by G7+ countries continued to load Russian oil in all Russian port regions, where average exported crude oil prices remained above the price cap level. These cases call for further investigation by enforcement agencies into breaches of sanctions.
G7+ tankers regaining hold on Russian oil after Western sanctions
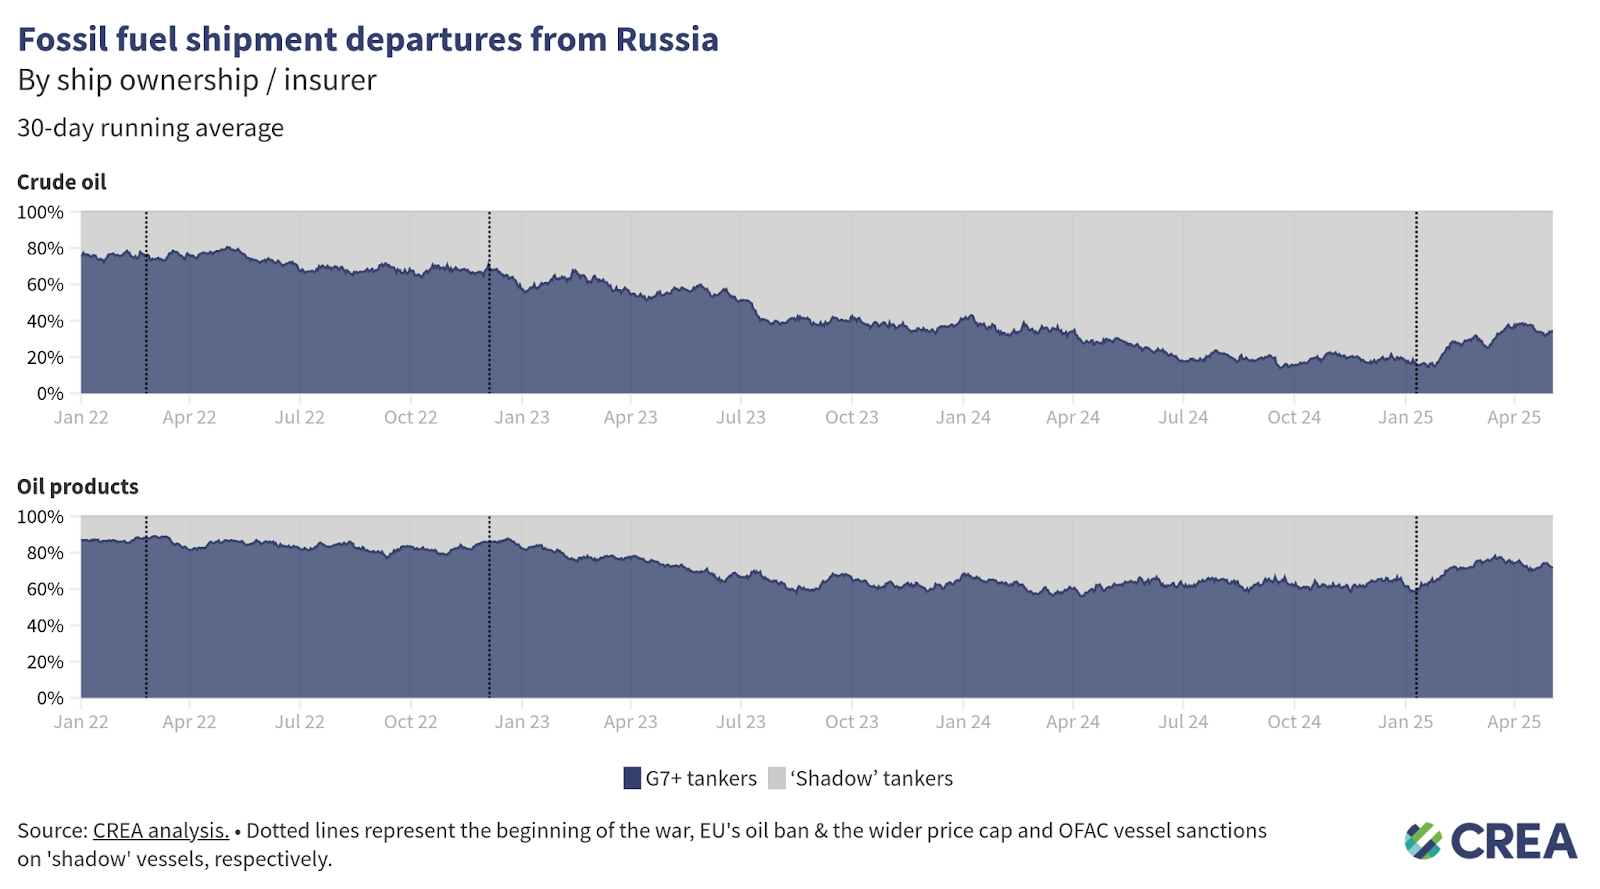
- In April 2025, Russia exported 23.5 mn tonnes of oil by sea — a 7% month-on-month decline. Almost half (47%) of these oil exports were transported on G7+ tankers, four percentage points higher than in March. Since January, the G7+ share in this transport has increased from 35% to 47%, while the share of ‘shadow’ tankers fell from 65% to 53%.
- Seaborne crude oil exports dropped by 5% month-on-month. G7+ tankers handled 35% of crude oil shipments in April, up from just 19% in January. ‘Shadow’ tanker use for crude fell from 81% in January to 65% in April.
- The transport of Russian oil products has generally been less reliant on ‘shadow’ tankers. In April, G7+ tankers accounted for 79% of oil product exports, up from 67% in January. Shadow tankers transported 21% of these volumes, down from 33% at the start of the year.
- Increased enforcement has reduced the capacity of ‘shadow’ tanker operations. By April, 311 tankers had been sanctioned by Western authorities for transporting Russian oil above the cap.
- Since late 2024, Russian Urals crude has consistently traded below the USD 60 per barrel price cap. In April, Urals freight on board (FOB) prices at Primorsk averaged USD 52.86 per barrel, allowing Western-insured tankers to legally load and ship it. Low freight rates and abundant vessel availability kept transport costs manageable. Urals discounts to Brent narrowed to just USD 2.40 per barrel by late April — the tightest spread in over a year — making Russian oil attractive to a wider group of refiners.
‘Shadow’ tankers pose significant risks to ecology & impact of sanctions
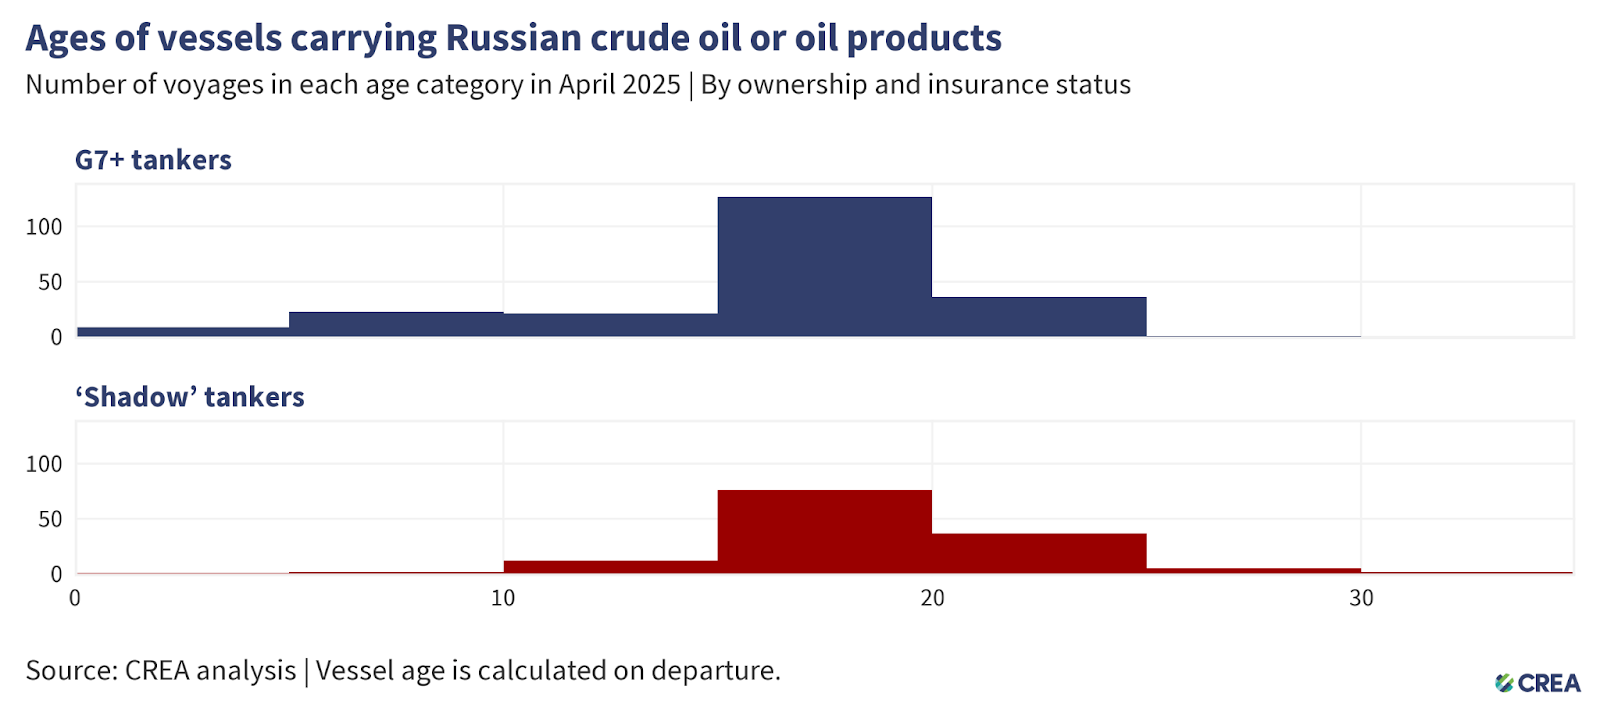
- In April, 352 vessels exported Russian crude oil and oil products, of which 135 were ‘shadow’ tankers. Thirty-two percent of these ‘shadow’ tankers were at least 20 years or older. The oldest tanker transporting Russian oil in April was over 30 years old.
- Older ‘shadow’ tankers transporting Russian oil and petroleum products across EU Member States’ exclusive economic zones, territorial waters, or maritime straits raise environmental and financial concerns due to their age, questionable maintenance records, and insurance coverage. Their insurance potentially lacks sufficient protection & indemnity (P&I) coverage to cover the cost in the event of an oil spill or other catastrophe. In the case of accidents, coastal countries may bear the financial brunt of the cleanup, not to mention the repercussions of damage to their marine ecology.
- The cost of cleanup and compensation resulting from an oil spill from tankers with dubious insurance could amount to over EUR 1 bn for coastal country’s taxpayers.
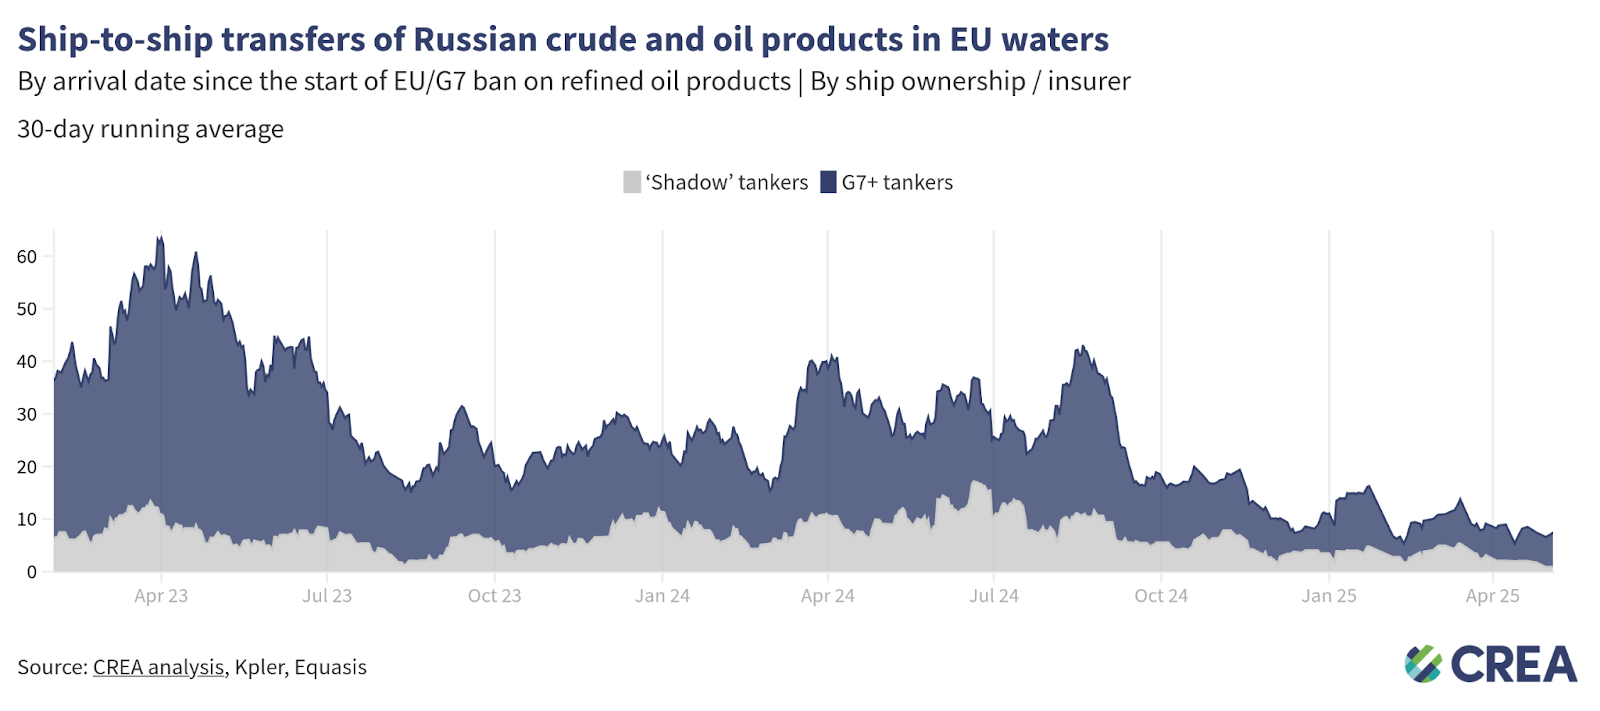
- In April, an estimated EUR 74 mn in Russian oil underwent daily ship-to-ship (STS) transfers in EU waters, which dropped by 25 percentage points. Thirty-four percent of these transfers were facilitated by shadow tankers, while the remainder was conducted by G7+ tankers.
How can Ukraine’s allies tighten the screws?
Russia’s fossil fuel export revenues have fallen since the sanctions were implemented, subsequently constricting Putin’s ability to fund the war. However, much more should be done to limit Russia’s export earnings and constrict the funding of the Kremlin’s war chest. This includes lowering the oil price cap, increasing monitoring and enforcement of sanctions, and banning unsanctioned fossil fuels such as LNG and pipeline fuels that are legally allowed into the EU.
Lowering the oil price cap
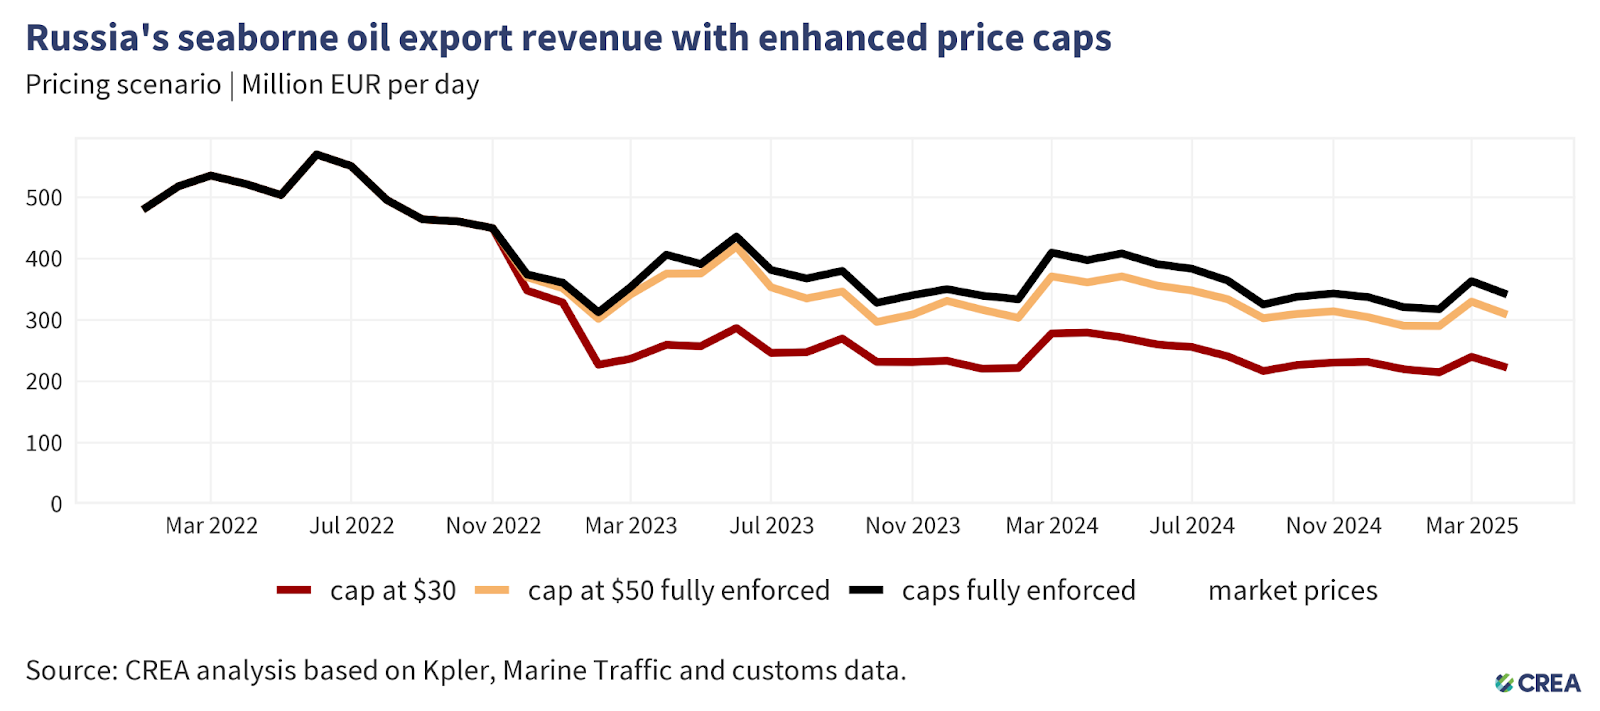
- A lower price cap of USD 30 per barrel (still well above Russia’s production cost, which averages USD 15 per barrel) would have slashed Russia’s oil export revenue by 40% (EUR 138 bn) from the start of the EU sanctions in December 2022 until the end of April 2025. In April alone, a USD 30 per barrel price cap would have slashed Russian revenues by 38% (EUR 4.13 bn).
- Lowering the price cap would be deflationary, reducing Russia’s oil export prices and inducing more production from Russia to make up for the drop in revenue.
- Since introducing sanctions until the end of April 2025, thorough enforcement of the price cap would have cut Russia’s export revenues by 11% (EUR 38.58 bn). In April 2025 alone, full enforcement of the price cap would have reduced revenues by 5% (approximately EUR 0.58 bn).
Restrict the growth of ‘shadow’ tankers & plug the refining loophole
- Russia’s reliance on tankers owned or insured in G7+ countries has fallen due to the growth of ‘shadow’ tankers. This subsequently impacts the coalition’s leverage to lower the price cap and hit Russia’s oil export revenues. Sanctioning countries must prevent Russia’s growth in ‘shadow’ tankers that are immune to the oil price cap policy.
- G7+ countries must also plug the widening refining loophole by banning the importation of oil products produced from Russian crude oil. This would enhance the impact of the sanctions by disincentivising third countries from importing large amounts of Russian crude and helping cut Russian export revenues. Banning the imports of oil products from refineries that process Russian crude oil would also lower the price of Russian oil, as they would struggle to find buyers or expand their market.
Stronger enforcement & monitoring
- Enforcement agencies overseeing the sanctions must take proactive measures against violating entities, including insurers registered in price cap coalition countries, shippers, and vessel owners.
- Despite clear evidence of violations, agencies must do more to enforce penalties against shippers, insurers, or vessel owners. This information must be shared widely in the public domain. Penalties against violating entities increase the perceived risk of being caught and serve as a deterrent.
- Penalties for violating the price cap must be significantly harsher. Current penalties include a 90-day ban on vessels from securing maritime services after violating the price cap, a mere slap on the wrist. If found guilty of violating sanctions, vessels should be fined and banned in perpetuity.
- Sanctions enforcement bodies must continue to sanction ‘shadow’ tankers as doing so hinders Russia’s ability to transport its oil above the price cap. CREA estimates that the Office of Foreign Assets Control (OFAC)’s initial sanctioning of ‘shadow’ tankers widened the discount that Russia offered buyers of its oil and cut Russia’s crude oil export revenues by 5% (EUR 512 mn per month).
- The lack of proper monitoring and enforcement along with rising oil prices have increased Russia’s export revenues to fund its war against Ukraine.
- The G7+ countries should ban STS transfers of Russian oil in G7+ waters. STS transfers undertaken by old ‘shadow’ tankers with questionable maintenance records and insurance pose environmental and financial risks to coastal states and support Russia in logistically exporting high volumes of crude oil. Coastal states should require ‘shadow’ tankers transporting Russian oil through their territorial waters to provide documentation showing adequate maritime insurance. If ‘shadow’ tankers fail to do so, they should be added to the OFAC, UK, and European sanctions list. This policy could limit Russia’s ability to transport its oil on ‘shadow’ tankers, which are exempt from complying with the oil price cap policy.
Relevant reports:
- EU sets 2027 as deadline to phase out all Russian energy, including LNG
- EU to Propose More Sanctions on Russia’s ‘Shadow’ Oil Tankers
- MEP Thijs Reuten: Stop volledig met Russische fossiele brandstoffen
- Moscow’s fading shadow fleet: Russian oil revenues are more vulnerable as ever
| Note on methodology: This monthly report uses CREA’s fossil shipment tracker methodology. The data used for this monthly report is taken as a snapshot at the end of each month. The data provider revises and verifies data on trades and oil shipments throughout the month. We subsequently update this verified data each month to ensure accuracy. This might mean that figures for the previous month change in our updated subsequent monthly reports. For consistency, we do not amend the previous month’s report; instead, we treat the latest one as the most accurate data for revenues and volumes. Russia’s daily revenues for commodities used in this report are derived as an average, using CREA’s pricing methodology. CREA’s estimates of the impact of a revised and lowered price cap have been updated since February 2025. These numbers are a more accurate representation of the revenue losses Russia would incur. Our earlier numbers severely underestimated the impact of a lower price cap due to a bug that we identified that mislabelled commodities in our model. |
- In the previous editions of our monthly report, our price analysis was derived using a moving average of 30 days. In order to more accurately represent the steep drop in global prices — which have led to Russian oil being traded below the price cap — we have removed the moving average from this present analysis. ↩︎