By Vaibhav Raghunandan, Petras Katinas, and Luke Wickenden
India’s crude imports drop to lowest levels since the price cap, while France and Spain’s LNG imports rise by 18% and 27%, respectively.
CORRIGENDUM, 12 February 2026 – The initial December 2025 monthly analysis stated that, ‘Slovakia was the fifth-highest importer, with imports totalling EUR 451 mn. Crude oil delivered via the Druzhba pipeline accounted for 37% of the total (EUR 130 mn), while pipeline gas accounted for EUR 285 mn’. These findings were incorrect and the result of human error. The correct figures are: EUR 194 mn; 85%; EUR 166 mn; and EUR 28 mn, respectively. They have been updated in the analysis. We apologise for the inconvenience.
Key findings
- In December, Russia’s monthly fossil fuel export revenues saw a marginal 2% month-on-month decline to EUR 500 mn per day — the second lowest figure since the full-scale invasion of Ukraine.
- In December, France and Spain increased their imports of Russian LNG by 18% and 27%, respectively.
- In December 2025, 93 ‘shadow’ vessels were operating under false flags at the end of the month. Twenty-six vessels delivered EUR 0.8 bn of Russian crude oil and oil products while flying a false flag.
- Just under half of the volume of Russian oil (46%) transported by tankers flying false flags (1 mn tonnes, valued at EUR 380 mn) transited the Danish Straits — carried by just 13 vessels.
- China’s seaborne crude imports from Russia saw a 23% month-on-month increase, corresponding to an 11% increase in total imports. Russian crude oil saw the biggest bump in China’s December supplies, with imports of Russian ESPO (Eastern Siberia-Pacific Ocean) grade crude rising to the highest levels in four months.
- India’s Russian crude imports recorded a sharp 29% month-on-month reduction to the lowest volumes since the implementation of the price cap policy. These drops occurred despite total imports growing marginally.
- These drops were led by sharp reductions in imports by the Jamnagar refinery (-49%) and a 15% reduction by state-owned refineries in December.
- Entity-based sanctions and price caps have been easily circumvented through special purpose vehicles (SPVs) and ‘shadow’ fleet growth. Considering this, CREA now proposes a full maritime services ban that targets the physical infrastructure of exports, closing these loopholes and imposing uniform, volume-based constraints on Russian oil revenues.
Trends in total export revenue
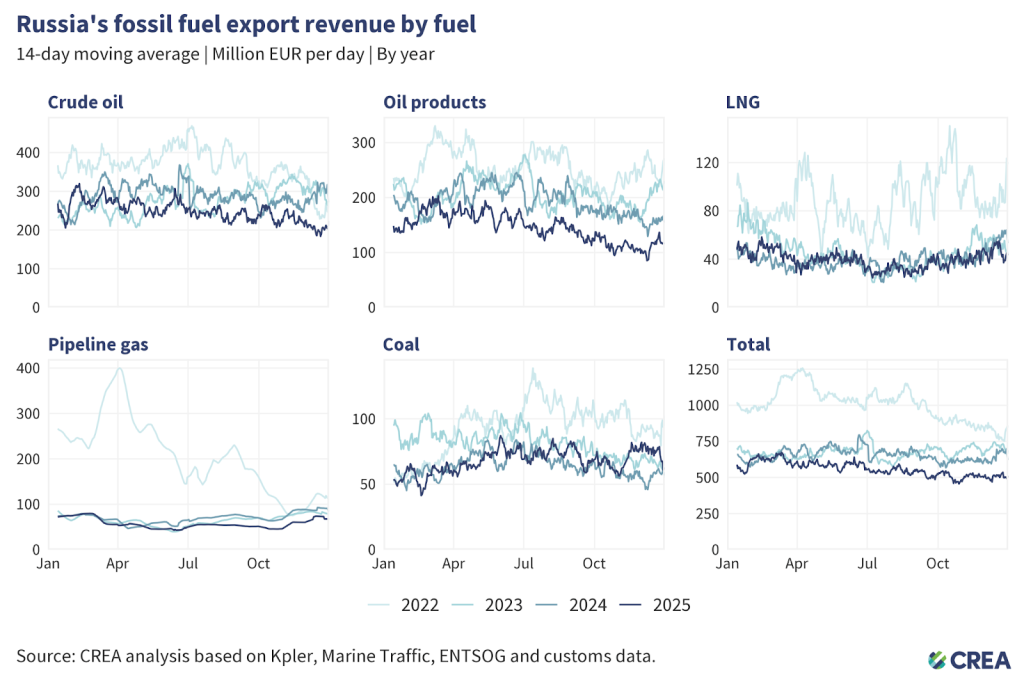
- In December, Russia’s monthly fossil fuel export revenues saw a marginal 2% month-on-month decline to EUR 500 mn per day — the second lowest figure since the full-scale invasion of Ukraine. Monthly export volumes also witnessed a similar 2% month-on-month reduction.
- Total crude oil export revenues dropped by 12% to EUR 198 mn per day. This was largely led by a significant 16% drop in revenues from seaborne crude, which totalled EUR 139 mn per day. The revenue reduction closely matched a similar 12% decline in export volumes.
- Pipeline crude export revenues saw a 2% month-on-month increase to EUR 59 mn per day.
- Liquefied natural gas (LNG) revenues increased by 13% to EUR 48 mn per day, aligning with a similar 16% increase in exported volumes — the highest in 2025.
- Pipeline gas revenues rose by a massive 17% to EUR 70 mn per day.
- Revenues from exports of seaborne oil products saw a steep 10% month-on-month increase, earning Russia EUR 116 mn per day.
- Coal revenues reduced by 11% month-on-month to EUR 67 mn per day.
Who is buying Russia’s fossil fuels?
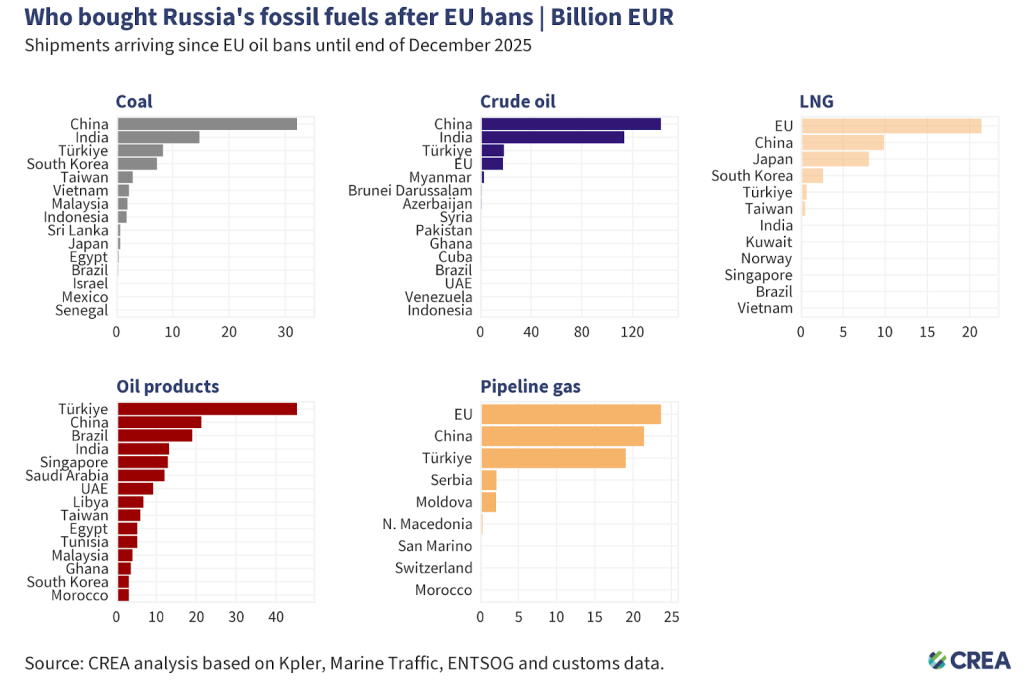
- Russia’s fossil fuel exports remain highly concentrated, with China dominating coal and crude oil purchases, Turkiye dominating purchases of oil products, and the EU remaining the largest buyer of LNG and pipeline gas — showing Moscow’s dependence on a narrow set of key customers.
- Coal: From 5 December 2022 until the end of December 2025, China purchased 43% of all Russian coal exports. India (20%), Turkiye (11%), South Korea (10%), and Taiwan (4%) round out the top five buyers’ list.
- Crude oil: China has bought 47% of Russia’s crude exports, followed by India (38%), Turkiye (6%), and the EU (6%).
- Oil products: Turkiye, the largest buyer, has purchased 27% of Russia’s oil product exports, followed by China (13%), Brazil (11%) and India (8%).
- LNG: The EU remains the largest buyer of Russian LNG, accounting for almost half (49%) of Russia’s total LNG exports, followed by China (23%) and Japan (18%).
- Pipeline gas: The EU is the largest buyer, purchasing 35% of Russia’s pipeline gas, followed by China (31%) and Turkiye (28%).
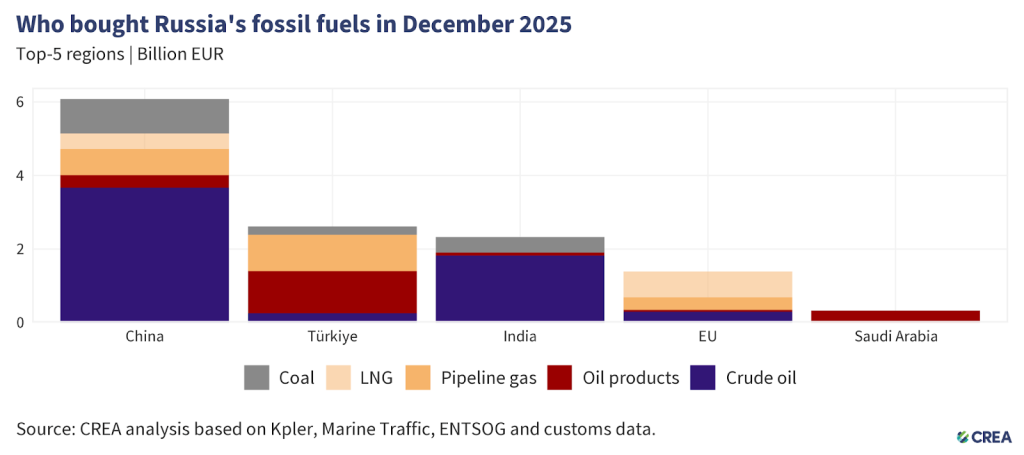
- In December 2025, China remained the largest global buyer of Russian fossil fuels, accounting for 48% (EUR 6 bn) of Russia’s export revenues from the top five importers. Crude oil made up 60% (EUR 3.6 bn) of China’s purchases, followed by coal at 15% (EUR 938 mn) and pipeline gas at 12% (EUR 706 mn). Refined oil products (EUR 339 mn) and LNG (EUR 429 mn) constituted the remainder of their imports.
- China’s seaborne crude imports from Russia saw a 23% month-on-month increase, corresponding to an 11% increase in total imports. Russian crude oil saw the biggest bump in China’s December supplies, with imports of Russian ESPO grade crude rising to the highest levels in four months.
- In a significant shift, indicative of the effect of US sanctions, China’s imports of Urals grade crude rose by 15% month-on-month. China’s imports of Urals grade crude in the final quarter of 2025 were the highest since Q2 2023.
- Turkiye displaced India as the second largest importer, purchasing EUR 2.6 bn of Russian hydrocarbons in December. Refined oil products constituted the largest share at 44% (EUR 1.1 bn) followed by pipeline gas (EUR 989 mn). Crude oil (EUR 258 mn) and coal (EUR 224 mn) constituted the remainder of their imports.
- Turkiye’s imports of Russian crude dropped by a massive 33% in December, even as there was a 9% increase in total imports. While Russia continues to be the country’s biggest supplier, December saw imports diversified from various sources with Norway, Guyana, and Iraq registering large gains in volumes.
- While the SOCAR-owned STAR refinery’s crude supplies remained concentrated towards Russia — which provided 91% of their supply in December — Russian crude imports by the two Tupras-owned refineries have dropped significantly. In December, Russian crude imports by the Tupras Aliaga and Tupras Izmit refineries dropped by a significant 69% month-on-month, even as total imports rose by 21%. The balance was almost entirely accommodated by supplies from Iraq.
- India was the third highest buyer of Russian fossil fuels, importing a total of EUR 2.3 bn of Russian hydrocarbons in December. Crude oil constituted 78% of India’s purchases totalling EUR 1.8 bn. Coal (EUR 424 mn) and oil products (EUR 82 mn) constituted the remainder of India’s monthly imports.
- India’s Russian crude imports recorded a sharp 29% month-on-month reduction to the lowest volumes since the implementation of the price cap policy. These drops occurred despite total imports growing marginally.
- These cuts were led largely by the Jamnagar refinery, which cut its imports from Russia by half in December. The entirety of their imports were supplied by Rosneft, albeit from cargoes purchased before the OFAC sanctions came into effect. State-owned refineries also cut Russian imports by 15% in December.
- The EU was the fourth-largest buyer of Russian fossil fuels, accounting for 11% (EUR 1.3 bn) of Russia’s export revenues from the top five importers. Half of these imports (EUR 700 mn) consisted of LNG. Pipeline gas (EUR 342 mn), crude oil (EUR 296 mn) and oil products (EUR 50 mn) constituted the remainder of their imports.
- While the EU was the fourth biggest importer as a bloc, Hungary was the fourth biggest single country purchasing Russian fossil fuels in December. Their purchases totalled EUR 337 mn in December.
- Saudi Arabia was the fifth-largest importer in December, with all of its purchases totalling EUR 328 mn, consisting of oil products.
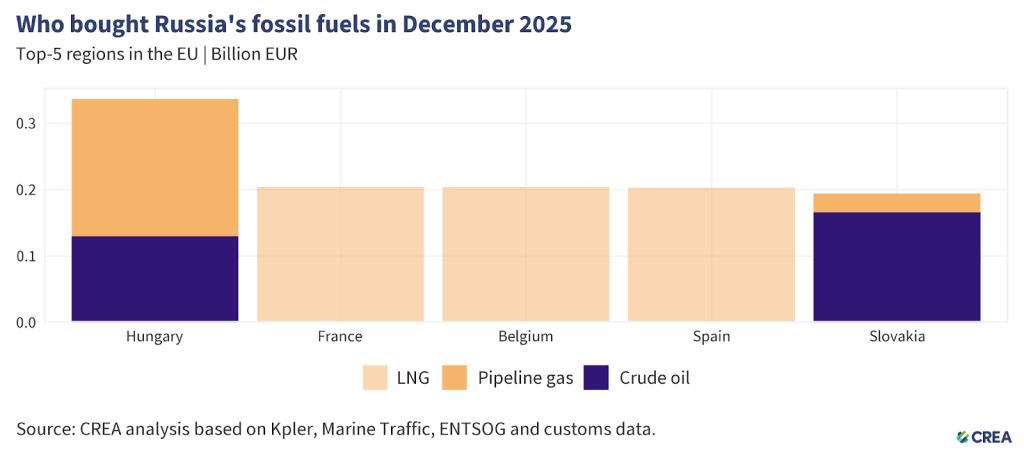
- In December 2025, the five largest EU importers of Russian fossil fuels paid Russia a combined EUR 1.4 bn. Natural gas — unsanctioned by the EU — accounted for 79% of these imports, delivered mainly by pipeline or as liquefied natural gas (LNG). Most of the remaining volumes were crude oil, which continues to reach Hungary and Slovakia via the southern branch of the Druzhba pipeline under an EU exemption. Croatia’s exemption allowing it to import refined Russian vacuum gas oil (VGO) expired on 31 December 2025.
- Hungary was the EU’s largest importer, purchasing EUR 337 mn worth of Russian fossil fuels. This included EUR 130 mn of crude oil and EUR 207 mn of pipeline gas.
- France was the second-largest buyer, importing EUR 204 mn of Russian fossil fuels, all in the form of LNG. France’s LNG imports increased by 13% month-on-month, with an 18% increase from Russia. An outage on the Rhone Link Pipeline suggests France will have less flexibility on the origin of its LNG imports throughout the winter.
- Belgium was the third-biggest importer, importing EUR 204 mn, also entirely in Russian LNG. Belgium’s imports of LNG decreased by 23% month-on-month, with a 20% decrease in imports from Russia. According to Belgian news agencies, since the 14th sanction package on March 27 came into force, imports to Belgium via the Zeebrugge port have increased by 76%.
- Spain, in fourth place, purchased EUR 203 mn of Russian fossil fuels — all in the form of LNG. While Spain’s total LNG imports decreased by 15% month-on-month, imports from the United States and Russia increased by 21% and 27%, respectively in December.
- Slovakia* was the fifth-highest importer, with imports totalling EUR 194 mn. Crude oil delivered via the Druzhba pipeline accounted for 85% of the total (EUR 166 mn), while pipeline gas accounted for EUR 28 mn.
*The initial December 2025 monthly analysis stated that, ‘Slovakia was the fifth-highest importer, with imports totalling EUR 451 mn. Crude oil delivered via the Druzhba pipeline accounted for 37% of the total (EUR 130 mn), while pipeline gas accounted for EUR 285 mn’. These findings were incorrect and the result of human error. They have been corrected. We apologise for the inconvenience.
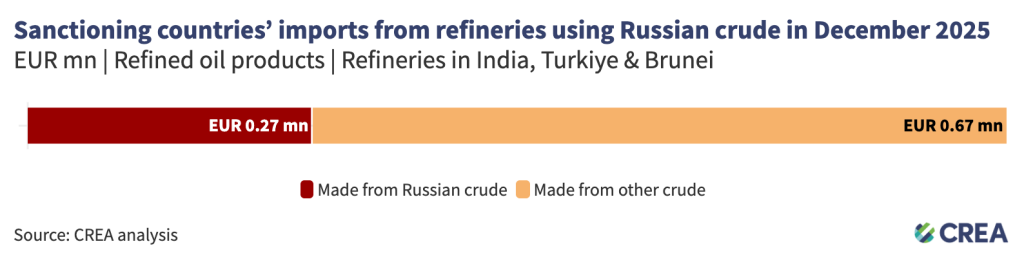
- In December, five refineries in India, Turkiye & Brunei that use Russian crude exported EUR 943 mn of oil products to sanctioning countries. The importers included the EU (EUR 436 mn), USA (EUR 189 mn), UK (EUR 34 mn) and Australia (EUR 283 mn). An estimated EUR 274 mn of these products were refined from Russian crude.
- There was a 9% month-on-month reduction in the refineries’ exports to sanctioning countries. The decrease was led chiefly by the EU and UK, who recorded monthly reductions of 26% and 53%, respectively.
- In contrast to those two, exports to Australia (EUR 284 mn) increased by 9% in December. The biggest exporters to Australia were the Jamnagar refinery in India (EUR 132 mn) and the Hengyi refinery in Brunei (EUR 116 mn).
- There was a 121% increase in exports to the USA totalling EUR 189 mn. These exports originated in the Jamnagar refinery and the Tupras Aliaga refinery in Turkiye.
| EU imports of Russian gas reduce even as power generation from fossil gas rises in 2025 |
 In December 2025, EU imports of Russian gas increased 13% month-on-month, rising by 0.42 bcm compared to November. This growth was driven mainly by LNG imports, which rose 18% (0.33 bcm), while pipeline imports increased 6% (0.10 bcm).In 2025, EU imports of Russian gas declined 31% year-on-year, falling by 16.62 bcm. Pipeline imports dropped sharply 45% (13.68 bcm), while LNG imports fell 13% (2.94 bcm). Since the start of 2025, gas transit via Ukraine has completely stopped, leaving TurkStream as the only pipeline transporting Russian gas to the EU. Despite the overall decline, TurkStream flows increased 8% year-on-year, partially offsetting the loss of Ukrainian transit.While there was a decrease in Russian gas flows into the EU, parallely there was a 10% year-on-year increase in power generation from fossil gas in 2025, equalling a total of 35.2 TWh. The increase means that overall gas imports for power generation increased and other sources made up for the fall in gas from Russia. The increase was weather-driven in the short term, but shows the need to rapidly increase clean electricity generation to reduce reliance on imported fossil fuels.  Coal and gas contributed to 26% of the EU’s total electricity production in 2025, a marginal increase from last year when fossil fuels contributed 24% to the total electricity mix. There was a significant 17% (40.7 TWh) year-on-year increase in solar power generation, with almost every Member State increasing their electricity production from the source in 2025. This increase in solar power generation resulted in fossil gas savings of 81.4 TWh, equal to 11% of the bloc’s total gas in storage at the end of 2025. The growth in generation was driven by a sharp increase in capacity in 2023–24, but capacity growth slowed down in 2025, for the first time since 2016.There was a marginal 2% (11.1 TWh) year-on-year reduction in wind power generation due to poorer wind conditions than the year before. The lack of growth however highlights the lacklustre pace of capacity additions. Weak capacity additions of both wind and solar in 2025 show the need to speed up permitting, resolve grid bottlenecks and address other obstacles to faster deployment.The main reason for the increase in power generation from gas was a massive 15% (48 TWh) year-on-year drop in hydroelectric power generation, mainly due to hot weather and droughts exacerbated by a dry winter. It also meant that hydropower’s share in the total electricity mix dropped from 13% in 2024 to 11% in 2025. |
How are oil prices changing?
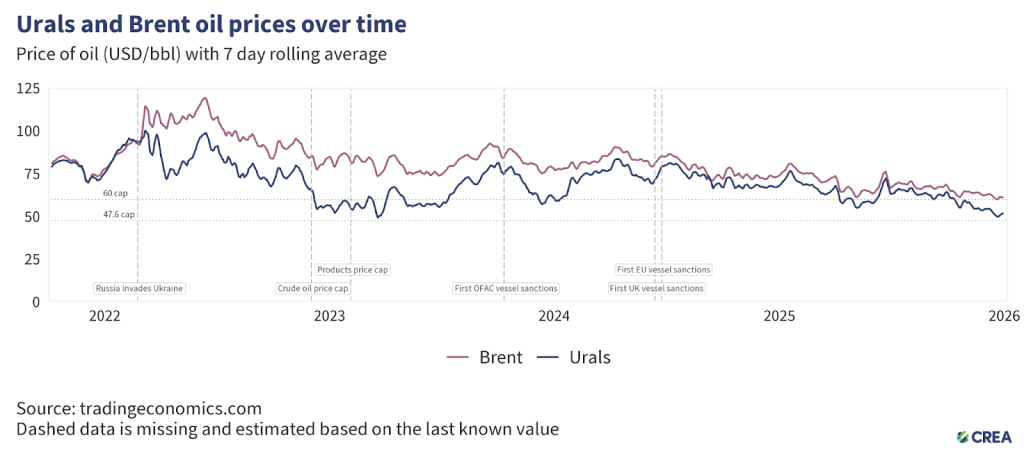
- In December 2025, the average price of Russia’s Urals crude fell by 6% to USD 51.9 per barrel, remaining above the new price cap of USD 47.6 per barrel.
- The lower price cap introduced by the EU, UK, Canada, Norway, Switzerland, and Australia took effect on 3 September. A transitional exemption remained in place until 18 October 2025, allowing the execution of contracts that (i) were signed before 20 July 2025 and (ii) complied with the previous USD 60 cap when concluded.
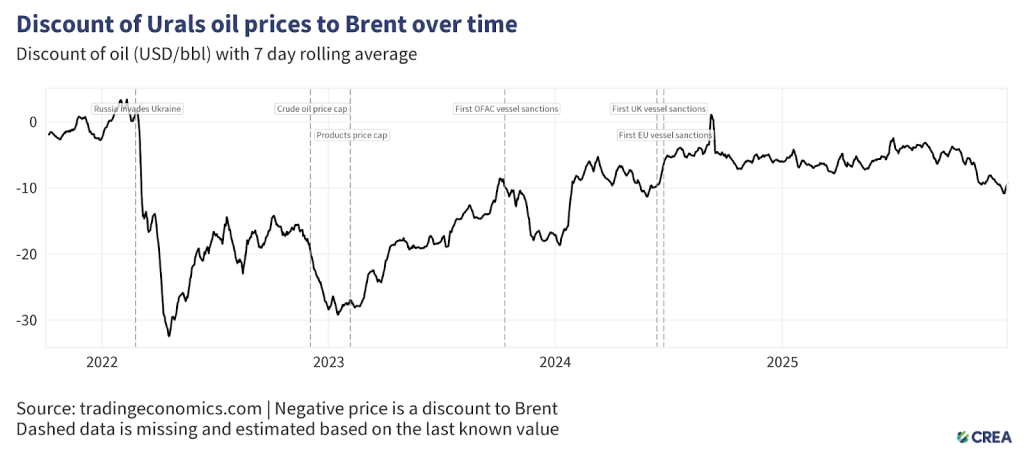
- In December, the discount on Urals crude increased by a massive 14% month-on-month, averaging USD 9.37 per barrel below Brent.
Sanctioned tankers carry the majority of Russian crude despite Western sanctions
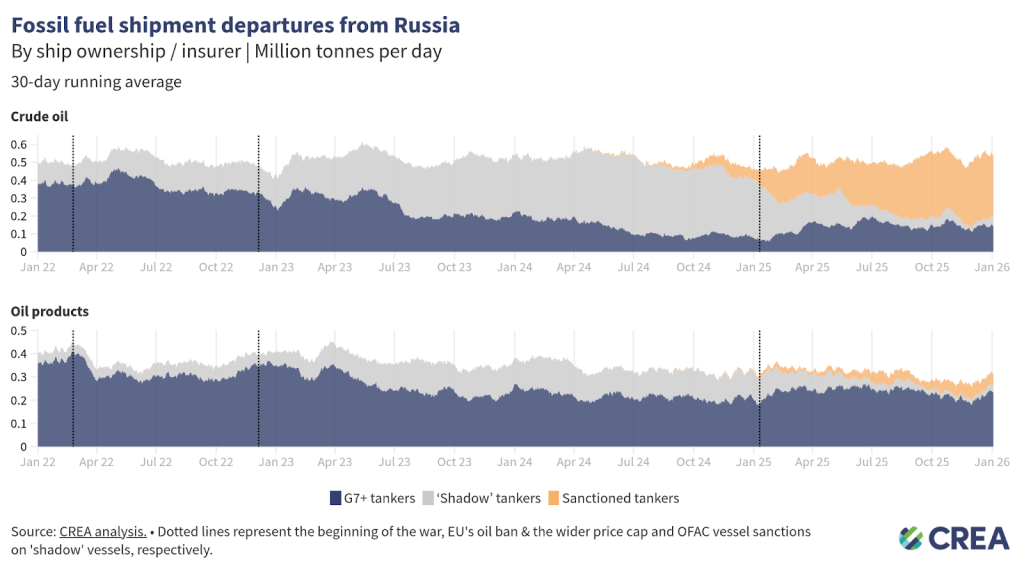
- In December, there was a 10% increase in Russian crude oil exports by sea, with an 8% growth in the volumes transported by G7+ tankers and 12% by ‘shadow’ tankers under sanctions. G7+ tankers were responsible for transporting 43% of Russian crude oil and oil products in December.
- In December, G7+ tankers transported 26% of Russian crude oil exports, while non-sanctioned ‘shadow’ tankers accounted for 6% of the total. The largest share, 68%, was carried by sanctioned ‘shadow’ tankers.
- For oil products, Russia’s dependence on G7+ tankers is higher, with 74% of Russian oil products transported by them in December. Sanctioned ‘shadow’ vessels carried 18% of total Russian oil product volumes, while non-sanctioned ‘shadow’ tankers accounted for 7% of the volume.
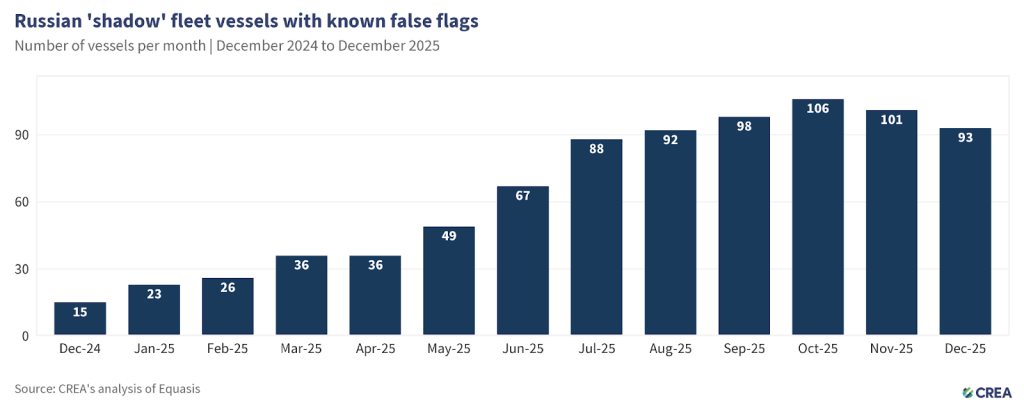
- In December 2025, 93 ‘shadow’ vessels were operating under false flags at the end of the month. Twenty-six vessels delivered EUR 0.8 bn of Russian crude oil and oil products while flying a false flag.
- Just under half of the volume of Russian oil (46%) transported by tankers flying false flags (1 mn tonnes, valued at EUR 380 mn) transited the Danish Straits — carried by just 13 vessels.
‘Shadow’ tankers pose significant risks to ecology & impact of sanctions
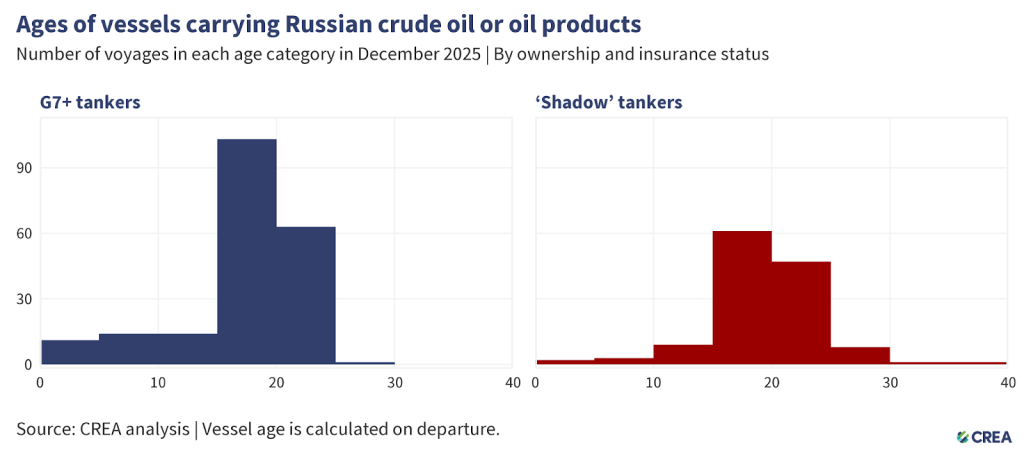
- In December 2025, 338 vessels exported Russian crude oil and oil products. Among them, 206 were G7+ tankers, and the remaining 132 were ‘shadow’ tankers. Additionally, 57 of these ‘shadow’ tankers were at least 20 years old or older.
- The oldest vessel transporting Russian oil in December was constructed 38 years ago.
- Older ‘shadow’ tankers transporting Russian oil through EU waters pose environmental and financial risks due to their age, poor maintenance, and inadequate protection and indemnity (P&I) insurance. In the event of an oil spill or accident, coastal states may face significant cleanup costs and damage to their marine ecosystems.
- The cost of cleanup and compensation from an oil spill by tankers with dubious insurance could amount to over EUR 1 bn for taxpayers in coastal countries.
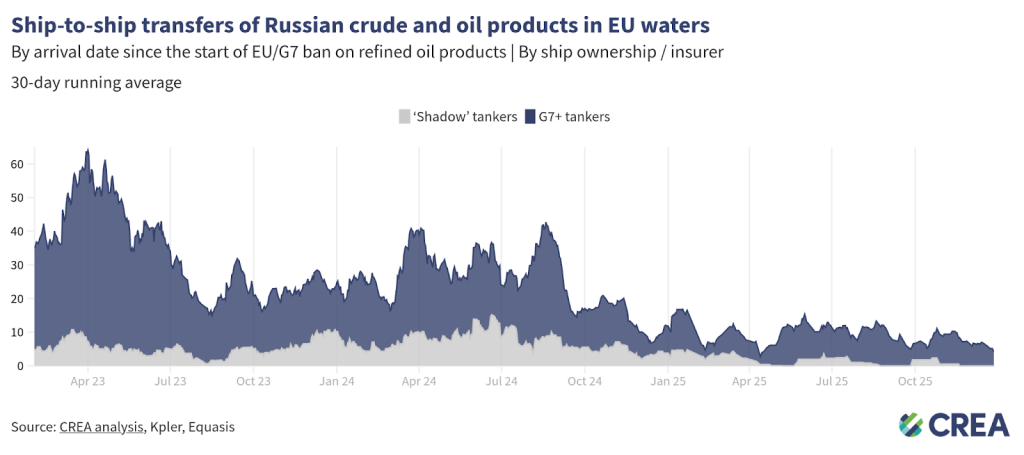
- In December 2025, an estimated EUR 176mn worth of Russian oil was transferred via ship-to-ship (STS) transfers in EU waters.
- Bulgaria (38%), Cyprus (32%), and Malta (16%) accounted for the majority of STS transfers by volume.
- Daily transfers averaged EUR 6 mn — a 30% decrease compared to last month. G7+ tankers conducted 97% of these transfers, while the rest involved ‘shadow’ vessels, which are often uninsured or registered under flags of convenience.
How can Ukraine’s allies tighten the screws?
Russia’s fossil fuel export revenues have fallen since the sanctions were implemented, subsequently constricting Putin’s ability to fund his full-scale invasion of Ukraine. However, much more should be done to limit Russia’s export earnings and constrain the funding of the Kremlin’s war chest.
Implement a G7+ Maritime services ban for Russian oil
The oil price cap has failed to impose a durable constraint on Russian crude exports, working only briefly and selectively for Urals while leaving other grades and export channels largely unaffected. Urals prices dipped below the USD 60 cap only in late 2022 and early 2023 before rebounding, while ESPO crude consistently traded well above the cap due to its structural orientation toward China and Pacific markets.
At the same time, Russia has built a large ‘shadow’ fleet that now carries the majority of crude exports, reducing reliance on Western services. In December, only 26% of Russian crude oil exports were transported by G7+ tankers, while 68% were carried by sanctioned ‘shadow’ vessels. This shift demonstrates that the price cap has neither constrained export volumes nor prevented Russia from selling crude above the cap through alternative logistics and buyers.
For oil products, the situation further exposes the cap’s ineffectiveness. Russia remains heavily dependent on G7+ tankers for refined product exports, which transported 74% of oil product volumes in December, yet the product price caps were set so high — up to USD 100 per barrel for premium products — that they rarely bound market prices and therefore failed to limit revenues.
Combined with the widespread use of intermediaries and SPVs, which legally separate sanctioned producers such as Rosneft and Lukoil from export transactions, Russia can continue exporting both crude and oil products while formally complying with sanctions.
These dynamics show that entity-based sanctions and price caps have been easily circumvented through SPVs and ‘shadow’ fleet growth. Considering this, CREA now proposes a full maritime services ban that targets the physical infrastructure of exports, closing these loopholes and imposing uniform, volume-based constraints on Russian oil revenues.
Restrict the growth of ‘shadow’ tankers & tighten regulations targeting the refining loophole
- Frequent sanctioning of Russian ‘shadow’ vessels has shifted Russian oil back to tankers owned or insured in G7+ countries. Nonetheless, Russian ‘shadow’ tankers still hold sway on the transport of Russian crude oil. In addition, many sanctioned vessels continue to deliver oil to ports globally, with EU and UK sanctions in particular frequently violated. Sanctioning countries must align their vessel lists and enforcement paradigms for a magnified effect on their operations.
- Maritime coastal states should intensify efforts to monitor, inspect, and detain ‘shadow’ fleet vessels that lack legal passage rights, such as unflagged, unlawfully idle, or security-risk vessels. Authorities must enforce and improve environmental and navigation laws within their territorial waters, investigating and boarding suspicious vessels when justified. Crews involved in criminal activity should face prosecution, and noncompliant ships and personnel should be subject to international arrest warrants.
- In its 18th sanctions package, the EU has banned the imports of ‘oil refined from Russian crude’. The regulation bans imports from countries that are ‘net importers’ of crude oil. Net export status does not preclude the import and refining of Russian-origin crude, especially in jurisdictions with flexible or opaque crude sourcing practices. To close this enforcement gap, the exemption should be applied at the refinery level, not the national level. Refined petroleum products should be subject to import restrictions if produced at facilities that have processed Russian crude within the past six months, regardless of the final product’s declared origin or the host country’s net export position.
- The exemptions for countries including the UK, the US, Canada, Norway, and Switzerland create an opportunity for oil products refined from Russian crude to be re-exported to the EU. This gap should be closed to ensure the sanctions are comprehensive and watertight. The EU should work with its partners to encourage them to also ban the importation of oil products from refineries running on Russian crude.
- Imports of oil products or petrochemicals from storage terminals or re-export hubs in non-sanctioning countries that have received a shipment of Russian oil in the previous six months should be prohibited from export to sanctioning jurisdictions. This aims to prevent re-export hubs from obfuscating the origin of imported Russian oil products that are then sent to sanctioning countries, such as suspicious cases observed in Turkiye and Georgia.
Stronger sanctions enforcement & monitoring of violations
- Despite clear evidence of violations, there is a need for stronger enforcement of penalties by agencies against shippers, insurers, and vessel owners. This information must be shared widely in the public domain. Penalties against violating entities increase the perceived risk of being caught and serve as a deterrent.
- Penalties for violating the price cap must be significantly harsher. Current penalties include a 90-day ban on vessels from securing maritime services after violating the price cap, a relatively minor sanction. If found guilty of violating sanctions, vessels should be fined and banned in perpetuity.
- The G7+ countries should ban STS transfers of Russian oil in G7+ waters. STS transfers undertaken by old ‘shadow’ tankers with questionable maintenance records and insurance pose environmental and financial risks to coastal states and support Russia logistically in exporting high volumes of crude oil. Coastal states should require oil tankers suspected of being ‘shadow’ tankers transporting Russian oil through their territorial waters to provide documentation showing adequate maritime insurance. Upon failing to do so, having been identified as a ‘shadow’ tanker, they should be added to the OFAC, UK, and European sanctions lists. This policy could limit Russia’s ability to transport its oil on ‘shadow’ tankers, which are not required to comply with the oil price cap policy.
- To strengthen the integrity of maritime operations, the International Maritime Organization (IMO) must revise its guidelines to enhance transparency regarding maritime insurance. The IMO should mandate that flag states require shipowners and insurers to publicly disclose key financial information, including insurer solvency data, credit ratings from recognised agencies, and audited financial statements. Maritime authorities of coastal states should be legally able and encouraged to detain tankers that fly false flags, which therefore pose environmental and security threats.
Relevant reports:
- Europe tried to slam the door on Russian energy: it didn’t account for Turkey
- The Kremlin’s brazen tactics: Russia’s shadow fleet is doubling as a spy asset, intelligence sources say
- EU primary energy consumption decreased by 1% in 2024
- The British expat tracking Russia’s shadow fleet from his Singapore deck
| Note on methodology: This monthly report uses CREA’s fossil shipment tracker methodology. The data used for this monthly report is taken as a snapshot at the end of each month. The data provider revises and verifies data on trades and oil shipments throughout the month. We subsequently update this verified data each month to ensure accuracy. This might mean that figures for the previous month change in our updated subsequent monthly reports. For consistency, we do not amend the previous month’s report; instead, we treat the latest one as the most accurate data for revenues and volumes. Russia’s daily revenues for commodities used in this report are derived as an average, using CREA’s pricing methodology. The number of vessels with false flags per month is calculated using an end-of-month snapshot. In other words, for each month, vessels were counted if their most recent flag change at the end of the month was to a false flag. This does not account for the vessels with multiple false flag periods (switches between false flags and verified flags, or between different false flags), only the most recent flag status at the end of the month. To calculate the volume and value carried by false flags transiting the Danish Straits, we assume that vessels loading from Russia’s Northern and Western ports (Ust-Luga, Primorsk, Vysotsk, St Petersburg, Murmansk, Arkhangelsk, Kaliningrad) must transit the Danish Straits. CREA’s estimates of the impact of a revised and lowered price cap have been updated since February 2025. These numbers are a more accurate representation of the revenue losses Russia would incur. Our earlier numbers severely underestimated the impact of a lower price cap due to a bug that we identified that mislabelled commodities in our model. |