By Vaibhav Raghunandan and Petras Katinas
The share of Russian crude oil transported by sanctioned tankers rose to 65%, even as volumes of seaborne crude exports saw a 3% reduction
Key findings
- In November, Russia’s monthly fossil fuel export revenues saw a marginal 1% month-on-month decline to EUR 489 mn per day — the lowest they have been since the full-scale invasion of Ukraine.
- G7+ tankers transported 27% of Russian crude oil exports, while non-sanctioned ‘shadow’ tankers accounted for 7% of the total. The largest share, 65%, was carried by sanctioned ‘shadow’ tankers.
- While Spain’s total LNG imports went down by 23% in November, Russian volumes practically doubled — and US import volumes halved in the same period.
- Six refineries in India and Turkiye exported EUR 807 mn of refined oil products partially made from Russian crude to the EU, USA, UK, Australia, and Canada. An estimated EUR 301 mn of these products were refined from Russian crude.
- Australia was the single biggest export destination for refineries using Russian crude. These refineries exported EUR 150 mn of oil products to Australia in November, a 69% month-on-month increase.
- China’s seaborne crude imports from Russia saw an 18% month-on-month decline, even as its global seaborne crude imports remained stable. The lost volumes from Russia were seemingly offset by deliveries from Saudi Arabia and Oman, which saw month-on-month increases of 24% and 28%, respectively.
- India’s Russian crude imports recorded a 4% month-on-month increase to the highest volumes in five months, even as overall import volumes remained stable. While private refiners’ Russian imports suffered marginal reduction, state-owned refineries increased their Russian crude volumes by 22% month-on-month in November.
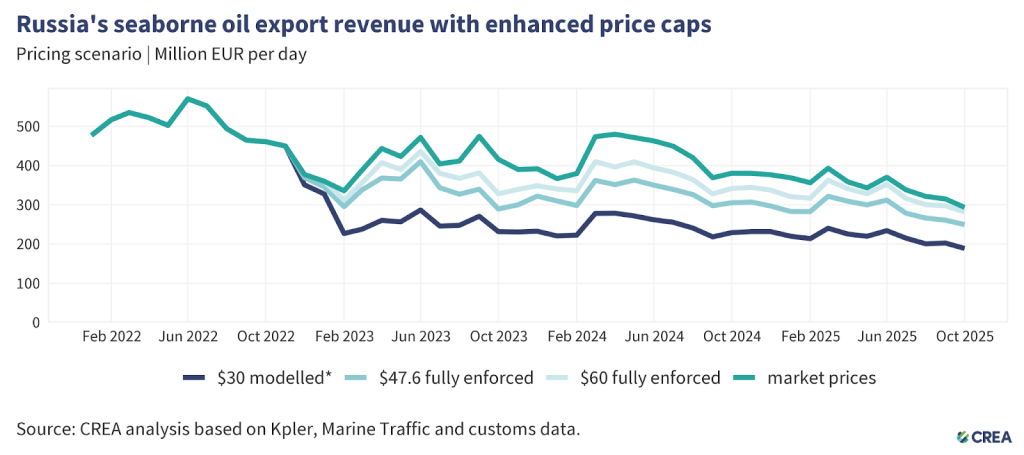
- A lower price cap of USD 30 per barrel would have slashed Russia’s oil export revenue by 39% (EUR 162 bn) from the start of the EU sanctions in December 2022 until the end of November 2025. In November alone, a USD 30 per barrel price cap would have slashed Russian revenues by 33%.
Trends in total export revenue
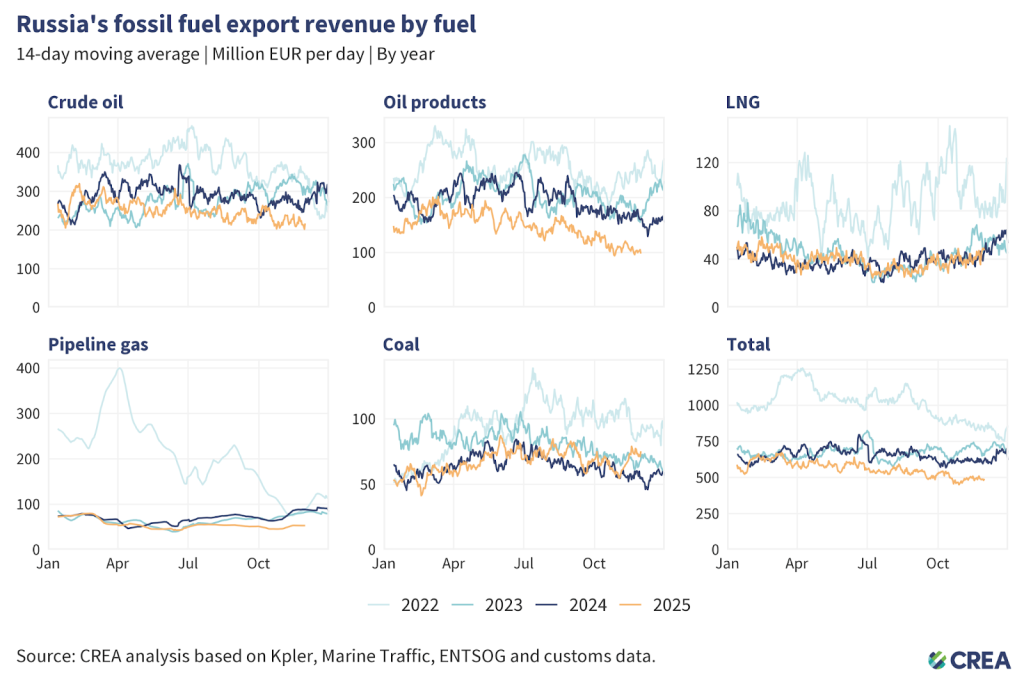
- In November, Russia’s monthly fossil fuel export revenues saw a marginal 1% month-on-month decline to EUR 489 mn per day — the lowest they have been since the full-scale invasion of Ukraine. Despite this drop in revenue, Russia experienced a 3% increase in export volumes in November, suggesting that Russian oil may have deepened discounts through the month.
- Total crude oil export revenues dropped by 6% to EUR 216 mn per day. There was a 7% drop in seaborne crude revenues (EUR 165 mn per day), which closely matched a similar 3% decline in volumes.
- Pipeline crude exports dropped by 5% month-on-month to EUR 52 mn per day.
- Liquefied natural gas (LNG) revenues increased by 19% to EUR 43 mn per day, aligning with a similar 19% increase in exported volumes.
- Pipeline gas revenues rose by a massive 16% to EUR 53 mn per day.
- Revenues from exports of seaborne oil products saw a steep 11% month-on-month decline, earning Russia EUR 104 mn per day.
- Coal revenues rose by 12% month-on-month to EUR 72 mn per day, with exported volumes increasing by 9%. This marks a recovery after a dip in revenues last month.
Who is buying Russia’s fossil fuels?
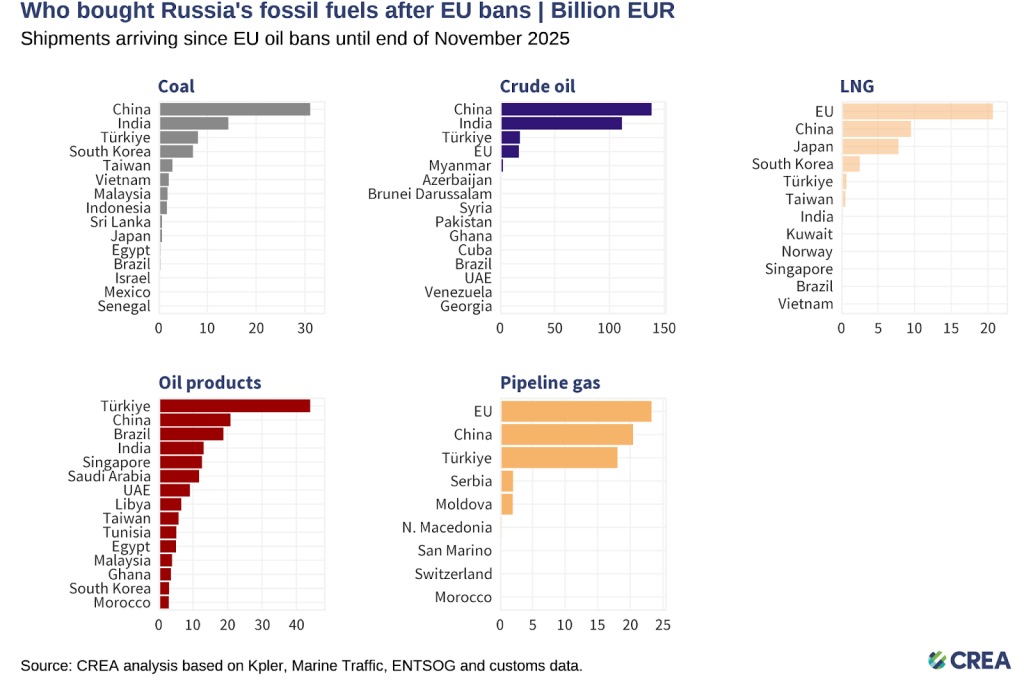
- Russia’s fossil fuel exports remain highly concentrated, with China dominating coal and crude oil purchases, Turkiye dominating purchases of oil products, and the EU still the largest buyer of LNG and pipeline gas — showing Moscow’s dependence on a narrow set of key customers.
- Coal: From 5 December 2022 until the end of November 2025, China purchased 43% of all Russian coal exports. India (20%), Turkiye (11%), South Korea (10%), and Taiwan (4%) round out the top five buyers’ list.
- Crude oil: China has bought 47% of Russia’s crude exports, followed by India (38%), Turkiye (6%), and the EU (6%).
- Oil products: Turkiye, the largest buyer, has purchased 26% of Russia’s oil product exports, followed by China (13%), Brazil (11%) and India (8%).
- LNG: The EU remains the largest buyer of Russian LNG, and has bought almost half (49%) of Russia’s total LNG exports, followed by China (22%) and Japan (18%).
- Pipeline gas: The EU is the largest buyer, purchasing 35% of Russia’s pipeline gas, followed by China (31%) and Turkiye (27%).
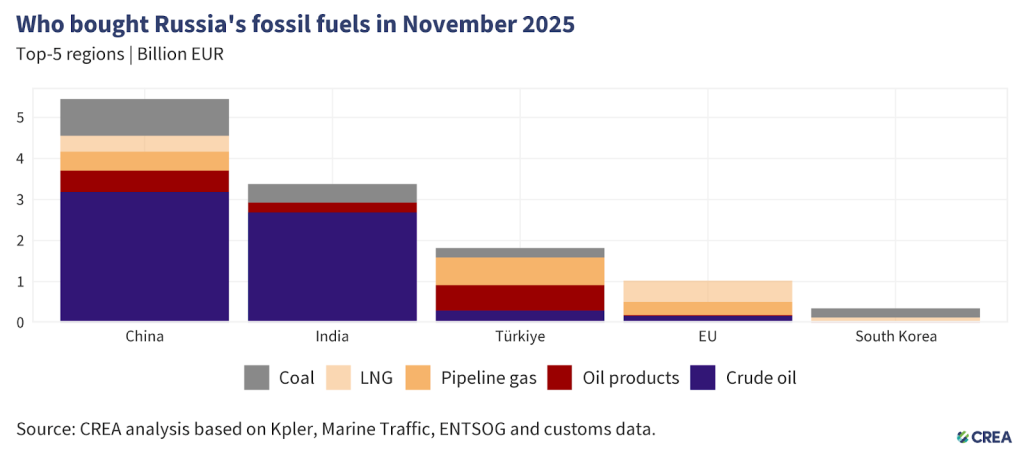
- In November 2025, China remained the largest global buyer of Russian fossil fuels, accounting for 45% (EUR 5.4 bn) of Russia’s export revenues from the top five importers. Crude oil made up 58% (EUR 3.1 bn) of China’s purchases, followed by coal at 16% (EUR 899 mn) and pipeline gas at 8% (EUR 463 mn). Refined oil products (EUR 513 mn) and LNG (EUR 390 mn) constituted the remainder of their imports.
- China’s seaborne crude imports from Russia saw an 18% month-on-month decline, even as their global seaborne crude imports remained stable. The lost volumes from Russia were seemingly compensated by deliveries from Saudi Arabia and Oman, which saw a 24% and 28% month-on-month increase, respectively. According to Chinese government data, crude oil purchases in November were the highest since August 2023.
- While all Russian producers suffered reductions in exports to China, Lukoil and Rosneft suffered the biggest hits of 69% and 18%, respectively, after the US’s sanctions on these two companies came into force on 21 November 2025.
- India remained the second-largest buyer of Russian fossil fuels, importing a total of EUR 3.3 bn of Russian hydrocarbons in November. Crude oil constituted 79% of India’s purchases totalling EUR 2.6 bn. Coal (EUR 457 mn) and oil products (EUR 236 mn) constituted the remainder of India’s monthly imports.
- India’s Russian crude imports recorded a 4% month-on-month increase to the highest volumes in five months, even as overall import volumes remained stable. In fact, India’s purchases may well record another increase in December, as cargoes loaded before the US Office of Foreign Assets Control (OFAC) sanctions kicked in are delivered through the month.
- While private refiners’ imports suffered marginal reduction, state-owned refineries increased their Russian crude volumes by 22% month-on-month in November. This comes as Russian Urals crude is discounted heavily following OFAC sanctions and with the two state leaders meeting and exchanging guarantees on the uninterrupted flow of oil.
- Turkiye was the third-largest importer, purchasing EUR 2.7 bn of Russian hydrocarbons in November. Pipeline gas constituted the largest share at 37% (EUR 675 mn) followed by oil products (EUR 622 mn). Crude oil (EUR 290 mn) and coal (EUR 232 mn) constituted the remainder of their imports.
- Turkiye’s imports of Russian crude and oil products dropped by 26% in November, corresponding with a 16% drop in total imports. The two most imported commodities from Russia, crude oil and diesel, suffered 21% and 27% month-on-month reductions, respectively.
- There were significant shifts in the STAR refinery’s procurement of Russian crude in November, with Lukoil cargoes reducing by 60% month-on-month. Tatneft deliveries remained stable throughout the month. The refinery also received cargoes from the Kazakh state-owned KazMunayGas (KMG) for only the second time in the last 24 months in November.
- The EU was the fourth-largest buyer of Russian fossil fuels, accounting for 8% (EUR 1 bn) of Russia’s export revenues from the top five importers. Half of these imports (EUR 512 mn), consisted of LNG and a further third (EUR 324 mn) constituted pipeline gas. Crude oil (EUR 164 mn) and oil products (EUR 17 mn) constituted the remainder of the imports.
- South Korea remained the fifth-largest importer of Russian fossil fuels. Almost two-thirds of their imports, valued at EUR 226 mn, consisted of coal, followed by LNG (EUR 108 mn) and oil products (EUR 17 mn).
- South Korea’s coal imports from Russia saw a 7% increase in November, corresponding closely with a 5% increase in total imports month-on-month.
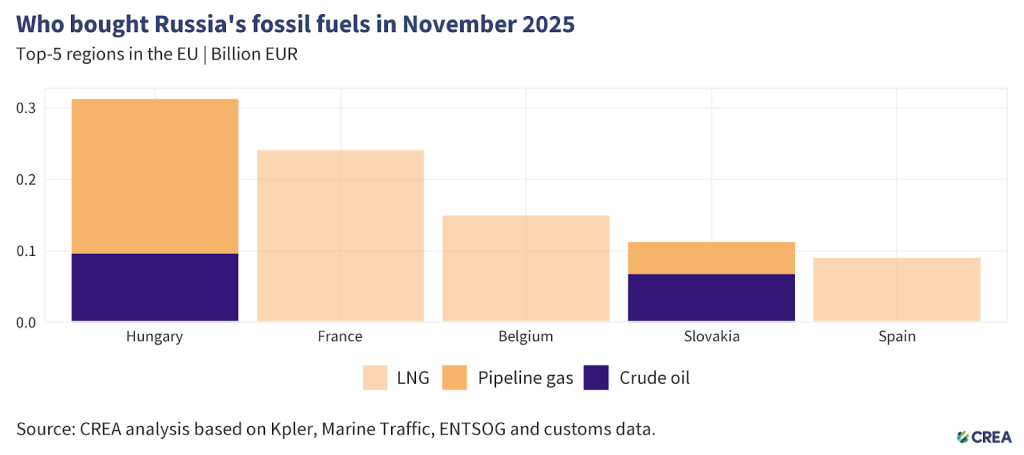
- In November 2025, the five largest EU importers of Russian fossil fuels paid Russia a combined EUR 906 mn. Natural gas — unsanctioned by the EU — accounted for 82% of these imports, delivered mainly by pipeline or as liquefied natural gas (LNG). Most of the remaining volumes were crude oil, which continues to reach Hungary and Slovakia via the southern branch of the Druzhba pipeline under an EU exemption. Croatia also retains an exemption allowing it to import refined Russian vacuum gas oil (VGO) until the end of 2025.
- Hungary was the EU’s largest importer, purchasing EUR 312 mn worth of Russian fossil fuels. This included EUR 96 mn of crude oil and EUR 216 mn of pipeline gas.
- France was the second-largest buyer, importing EUR 241 mn of Russian fossil fuels, all in the form of LNG. However, not all of this gas is consumed domestically — a study shows that some LNG entering through the Dunkerque terminal is subsequently delivered to Germany. France’s LNG imports from Russia rose by 17% month-on-month, similar to a 15% rise in total imports.
- Belgium was the third-biggest importer, importing EUR 150 mn also entirely in Russian LNG. Belgium’s imports of Russian LNG declined by 5% month-on-month, mirroring a similar decline in total imports.
- Slovakia was the fourth-highest importer, with imports totaling EUR 113 mn. Crude oil delivered via the Druzhba pipeline accounted for 60% of the total (EUR 68 mn), while pipeline gas accounted for EUR 45 mn. The derogation allowing Slovak refineries to process Russian crude into oil products and re-export them to Czechia expired on 5 June 2025, which suggests that all refined oil products are consumed domestically.
- Spain, in fifth place, purchased EUR 90 mn Russian fossil fuels — all of it in the form of LNG. While Spain’s total LNG imports went down by 23% in November, Russian volumes practically doubled — and US volumes halved in the same period.
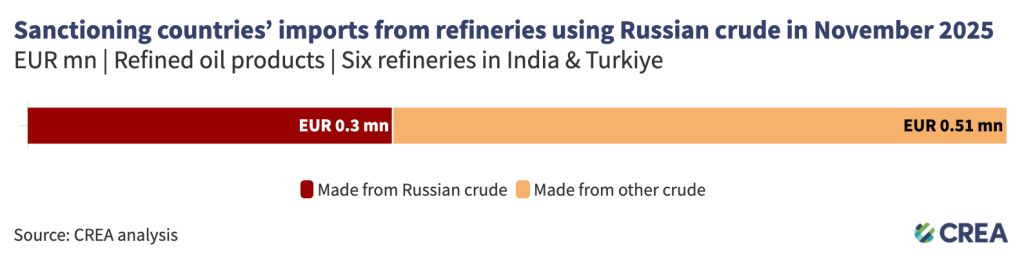
- In November, six refineries in India and Turkiye exported EUR 807 mn of refined oil products partially made from Russian crude to the EU (EUR 465 mn), USA (EUR 110 mn), UK (EUR 51 mn), Australia (EUR 150 mn), and Canada (EUR 31 mn). An estimated EUR 301 mn of these products were refined from Russian crude.
- An estimated EUR 297 mn of oil products exported by these refineries remain without a specified destination.
- There was an 8% month-on-month reduction in the refineries’ exports to sanctioning countries. The decrease was led chiefly by the EU, US, and UK, who recorded monthly reductions of 32%, 40%, and 62%, respectively.
- By contrast, exports to Australia (EUR 150 mn) increased by 69% in November. All of these cargoes originated in the Jamnagar refinery in India. In November, Canada received a shipment of oil from a refinery using Russian crude for the first time in eight months. Australia, Canada, and the US are yet to announce a ban on oil products made from Russian crude.
How are oil prices changing?
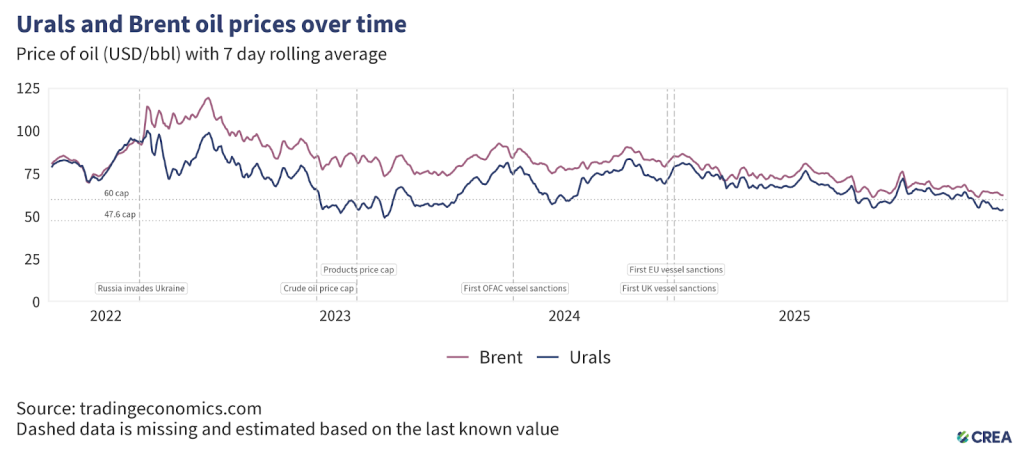
- In November 2025, the average price of Russia’s Urals crude fell by 6% to USD 55 per barrel, remaining above the new price cap of USD 47.6 per barrel.
- The lower price cap introduced by the EU, UK, Canada, Norway, Switzerland, and Australia took effect on 3 September. A transitional exemption remained in place until 18 October 2025, allowing the execution of contracts that (i) were signed before 20 July 2025 and (ii) complied with the previous USD 60 cap when concluded.
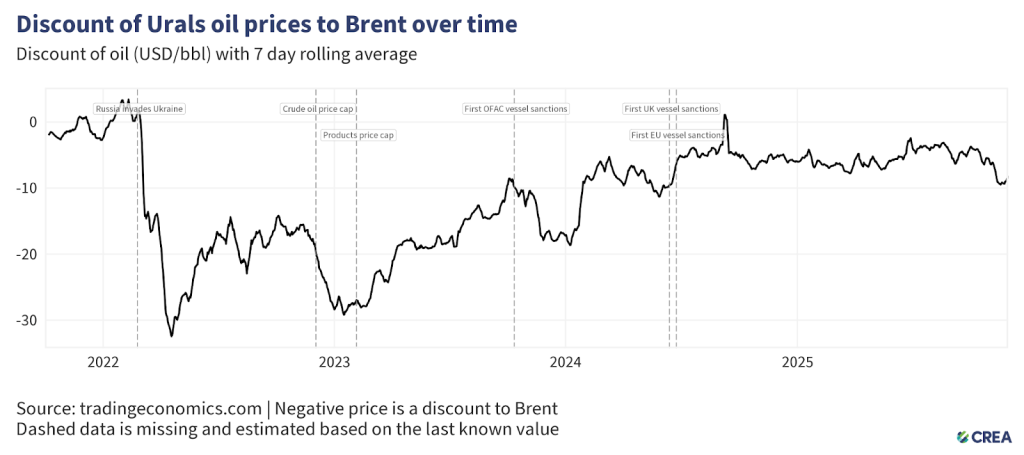
- In November, the discount on Urals crude increased by 4% month-on-month, averaging USD 6.66 per barrel below Brent.
Sanctioned tankers carry the majority of Russian crude despite Western sanctions
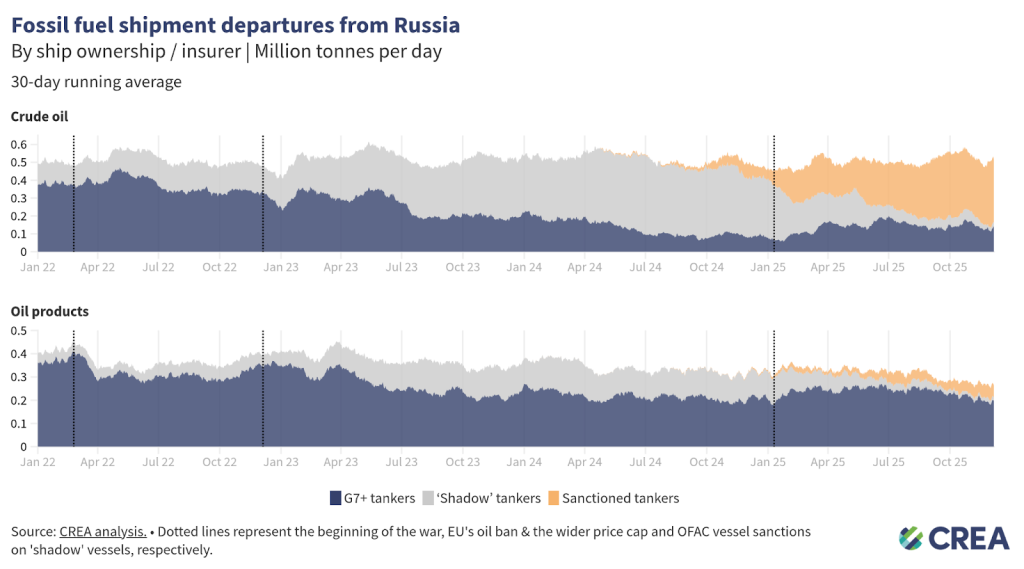
- In November, G7+ tankers transported 27% of Russian crude oil exports, while non-sanctioned ‘shadow’ tankers accounted for 7% of the total. The largest share, 65%, was carried by sanctioned ‘shadow’ tankers.
- For oil products, dependence on G7+ tankers is greater, transporting 74% of Russian refined products. Sanctioned ‘shadow’ vessels carried 20% of total Russian refined oil products, while non-sanctioned ‘shadow’ tankers accounted for only 6% of volumes.
‘Shadow’ tankers pose significant risks to ecology & impact of sanctions
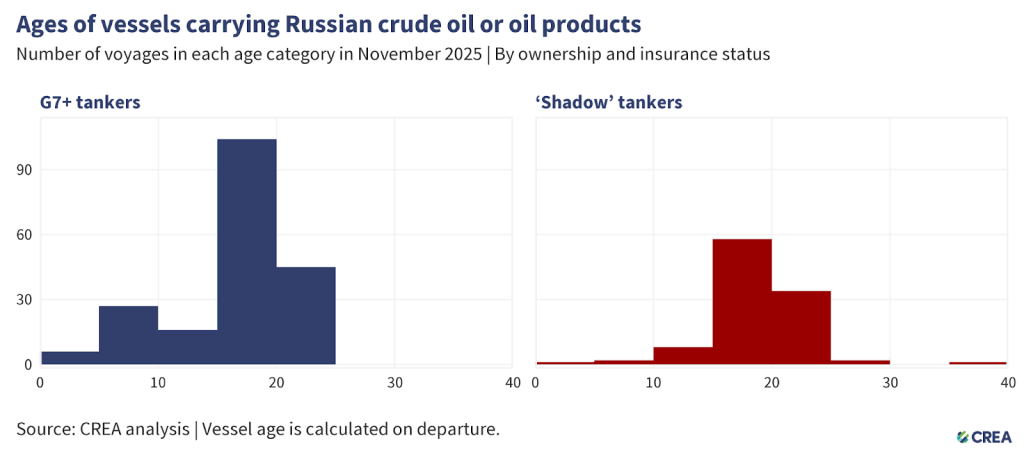
- In November 2025, 304 vessels exported Russian crude oil and oil products. Among them, 198 were G7+ tankers, including 106 ‘shadow’ tankers. Additionally, 37 of these ‘shadow’ tankers were at least 20 years old or older.
- Older ‘shadow’ tankers transporting Russian oil through EU waters pose environmental and financial risks due to their age, poor maintenance, and inadequate protection and indemnity (P&I) insurance. In the event of an oil spill or accident, coastal states may face significant cleanup costs and damage to their marine ecosystems.
- The cost of cleanup and compensation resulting from an oil spill from tankers with dubious insurance could amount to over EUR 1 bn for coastal country’s taxpayers.
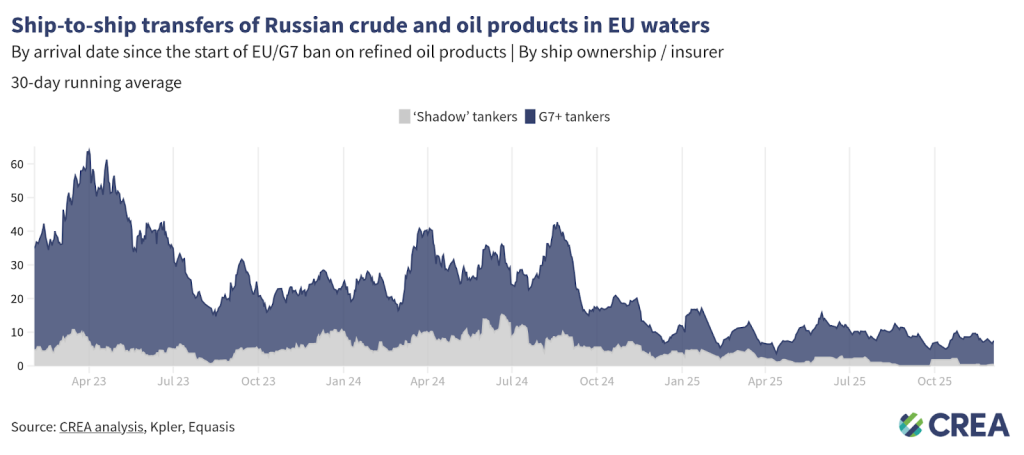
- In November 2025, an estimated EUR 126 mn worth of Russian oil was transferred monthly via ship-to-ship (STS) transfers in EU waters — a 22% month-on-month increase. G7+ tankers conducted 97% of these transfers, while the rest involved ‘shadow’ vessels, which are often uninsured or registered under flags of convenience.
How can Ukraine’s allies tighten the screws?
Russia’s fossil fuel export revenues have fallen since the sanctions were implemented, subsequently constricting Putin’s ability to fund his full-scale invasion of Ukraine. However, much more should be done to limit Russia’s export earnings and constrict the funding of the Kremlin’s war chest. This includes lowering the oil price cap for crude and oil products, increasing monitoring and enforcement of sanctions, and banning unsanctioned fossil fuels such as LNG and pipeline fuels that are legally allowed into the EU.
Lowering the oil price cap
- Since 3 September 2025, there have been two price caps on Russian crude oil. The EU, UK, Canada, Norway, Switzerland, and Australia have implemented a USD 47.6 per barrel price cap on Russian crude. The US, meanwhile, still follows the USD 60 per barrel cap.
- The cap on refined oil products remains unaffected by this divide. Since a larger set of the original price-cap coalition is now adhering to the lowered cap, CREA is modelling the effect of full enforcement.
- A lower price cap of USD 30 per barrel (still well above Russia’s production cost, which averages USD 15 per barrel) would have slashed Russia’s oil export revenue by 39% (EUR 162 bn) from the start of the EU sanctions in December 2022 until the end of November 2025. In November alone, a USD 30 per barrel price cap would have slashed Russian revenues by 33% (EUR 2.66 bn).
- Lowering the price cap would be deflationary, reducing Russia’s oil export prices and inducing more production from Russia to offset the drop in revenue.
- In November 2025 alone, full enforcement of the USD 47.6 per barrel price cap would have reduced revenues by approximately 13% (EUR 1.01 bn).
Restrict the growth of ‘shadow’ tankers & tighten regulations targeting the refining loophole
- Frequent sanctioning of Russian ‘shadow’ vessels has shifted Russian oil back to tankers owned or insured in G7+ countries. Nonetheless, Russian ‘shadow’ tankers still hold sway on the transport of Russian crude oil. In addition, many sanctioned vessels continue to deliver oil to ports globally, with EU and UK sanctions in particular frequently violated. Sanctioning countries must align their vessel lists and enforcement paradigms for a magnified effect on their operations.
- Maritime coastal states should intensify efforts to monitor, inspect, and detain ‘shadow’ fleet vessels that lack legal passage rights, such as unflagged, unlawfully idle, or security-risk vessels. Authorities must enforce and improve environmental and navigation laws within their territorial waters, investigating and boarding suspicious vessels when justified. Crews involved in criminal activity should face prosecution, with noncompliant ships and personnel subject to international arrest warrants.
- In its 18th sanctions package, the EU has banned the imports of ‘oil refined from Russian crude’. The regulation bans imports from countries that are ‘net importers’ of crude oil. Net export status does not preclude the import and refining of Russian-origin crude, especially in jurisdictions with flexible or opaque crude sourcing practices. To close this enforcement gap, the exemption should be applied at the refinery level, not the national level. Refined petroleum products should be subject to import restrictions if produced at facilities that have processed Russian crude within the past six months, regardless of the final product’s declared origin or the host country’s net export position.
- The current grace period provides Russia as well as traders buying oil refined using Russian crude with excessive time to adjust supply chains and maintain oil revenue. A shorter 60-day wind‑down period, focused on high‑risk refined products like diesel and jet fuel, would reduce Russia’s fiscal gains and limit circumvention opportunities. It would also give the EU sufficient time to secure alternative suppliers.
- The exemption of countries including the UK, US, Canada, Norway, and Switzerland creates an opportunity for oil products refined from Russian crude to be re-exported to the EU. This gap should be closed to ensure the sanctions are comprehensive and watertight. The EU should work with its partners to encourage them to also ban the importation of oil products from refineries running on Russian crude.
Stronger enforcement & monitoring of the price cap
- Despite clear evidence of violations, there is a need for stronger enforcement of penalties by agencies against shippers, insurers, and vessel owners. This information must be shared widely in the public domain. Penalties against violating entities increase the perceived risk of being caught and serve as a deterrent.
- Penalties for violating the price cap must be significantly harsher. Current penalties include a 90-day ban on vessels from securing maritime services after violating the price cap, a relatively minor sanction. If found guilty of violating sanctions, vessels should be fined and banned in perpetuity.
- The G7+ countries should ban STS transfers of Russian oil in G7+ waters. STS transfers undertaken by old ‘shadow’ tankers with questionable maintenance records and insurance pose environmental and financial risks to coastal states and support Russia logistically in exporting high volumes of crude oil. Coastal states should require oil tankers suspected of being ‘shadow’ tankers transporting Russian oil through their territorial waters to provide documentation showing adequate maritime insurance. Upon failing to do so, having been identified as a ‘shadow’ tanker, they should be added to the OFAC, UK, and European sanctions list. This policy could limit Russia’s ability to transport its oil on ‘shadow’ tankers, which are not required to comply with the oil price cap policy.
- To strengthen the integrity of maritime operations, the International Maritime Organization (IMO) must revise its guidelines to enhance transparency regarding maritime insurance. The IMO should mandate that flag states require shipowners and insurers to publicly disclose key financial information, including insurer solvency data, credit ratings from recognized agencies, and audited financial statements. Maritime authorities of coastal states should be legally able and encouraged to detain tankers that fly false flags which therefore pose environmental and security threats.
Relevant reports:
- Attacks on the ‘shadow’ fleet hit Russia’s soft spot: the oil trade
- Australia’s biggest super funds accused of profiting from Russian ‘blood oil’
- Russia’s ‘shadow vessels’ using false flags to skirt sanctions
| Note on methodology: This monthly report uses CREA’s fossil shipment tracker methodology. The data used for this monthly report is taken as a snapshot at the end of each month. The data provider revises and verifies data on trades and oil shipments throughout the month. We subsequently update this verified data each month to ensure accuracy. This might mean that figures for the previous month change in our updated subsequent monthly reports. For consistency, we do not amend the previous month’s report; instead, we treat the latest one as the most accurate data for revenues and volumes. Russia’s daily revenues for commodities used in this report are derived as an average, using CREA’s pricing methodology. CREA’s estimates of the impact of a revised and lowered price cap have been updated since February 2025. These numbers are a more accurate representation of the revenue losses Russia would incur. Our earlier numbers severely underestimated the impact of a lower price cap due to a bug that we identified that mislabelled commodities in our model. |