South Africa’s Johannesburg and the cities and provinces surrounding it regularly suffer from high levels of air pollution, but the past month’s pollution levels have stood out as exceptionally high. This article uses data and CREA’s in-house analysis and modeling tools to make sense of the reasons behind and sources of pollution in the past month.
If you’re not familiar with the air pollutants PM2.5, PM10, SO2 and NO2, I recommend starting by reading the fact box at the end of the article.
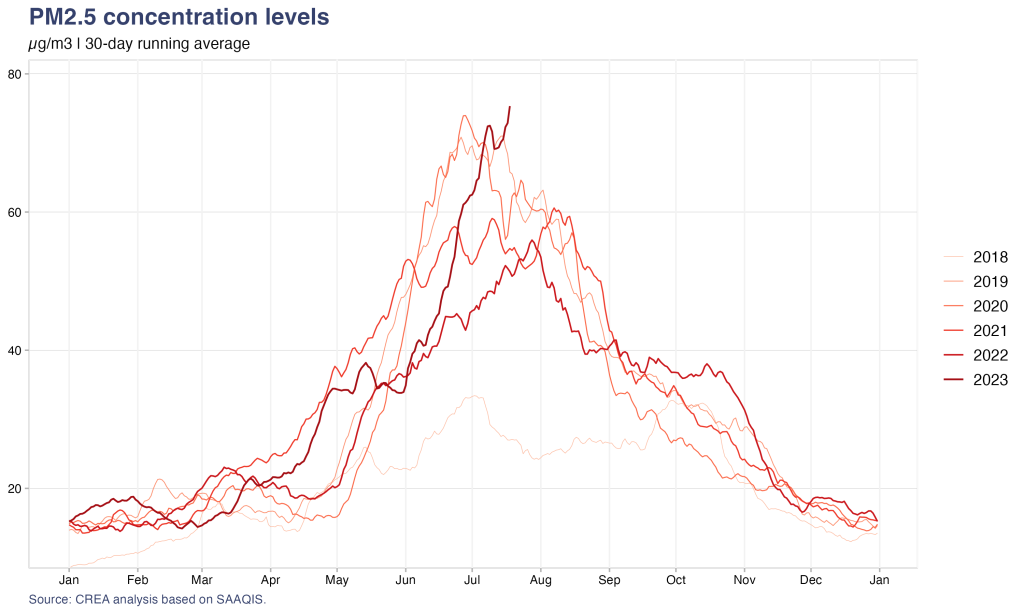
1) In the past 30 days, average PM2.5 concentrations in Johannesburg reached the highest monthly average level since at least 2018, 72 micrograms per meter cube. That’s almost five times the WHO guideline for 24 hours. This guideline shouldn’t be exceeded more than 3-4 times per year, but in Johannesburg the average for the past 30 days exceeds it severalfold.
2) Adverse weather cannot account for the high pollution levels. Pollution levels vary widely depending on weather conditions, especially wind patterns and vertical mixing of air. The southern hemisphere winter, June to August, typically sees much higher pollution levels than the rest of the year. The main reason for this is that weather conditions in the winter a much more prone to smog formation. Some emissions sources can also increase in the winter, but not by sufficiently much to account for the three-fold increase in average PM2.5 pollution levels.
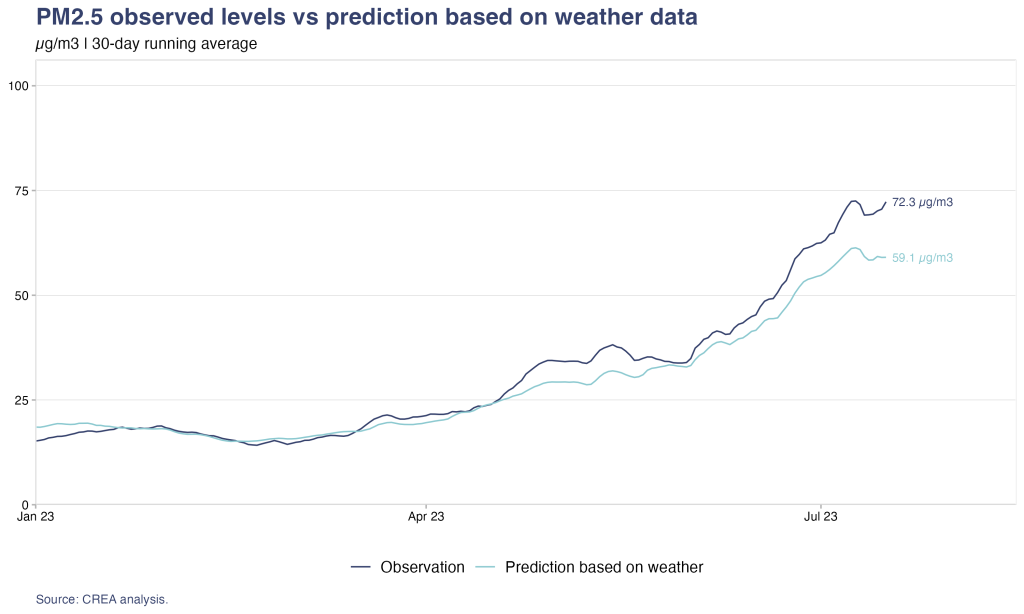
CREA’s machine learning models enable us to predict pollution levels in Johannesburg based on weather conditions, assuming emissions are at a typical level. However, our predicted 30-day average PM2.5 level for Johannesburg based on weather conditions is 59 ug/m3, very much an average value for this time of the year. This concentration is still alarmingly high, but it indicates that weather conditions have been typical, not exceptionally prone to smog formation.
Our models show a 13 ug/m3 “anomaly”, a difference between predicted and measured pollution levels, indicating that this difference is due to differences in emissions levels between this year and earlier years.
3) Open fires detected from satellites rose and peaked earlier than typical this year. For a few weeks in June-July, there were many more fires affecting air quality in Johannesburg than in earlier years. However, more recently, the number of fires has fallen to a more typical level, but the higher-than-average pollution has intensified.

Our machine learning models take into account fires detected from satellites when predicting air quality. We can gauge the impact of fires by excluding the fires from the input data to the model. Doing this shows that the larger than average number of fires contributed to the high pollution levels, but the contribution was around 2 ug/m3 out of the 13 ug/m3 anomaly.

4) The days with the highest PM2.5 levels have also had high levels of NO2 and SO2, and a high ratio of PM2.5 to PM10. If open fires were the main culprit, we would expect a low PM2.5 to PM10 ratio and low SO2 levels, as open fires emit a lot of coarser particles and no SO2. NO2 is associated with all fossil fuel burning, including gasoline and diesel used in transport and gensets, but SO2 is only associated with burning of coal and fuel oil in power plants and industry, as gasoline and diesel have most of the sulfur contained in crude oil removed during refining.

5) Other possible sources of increased emissions include power plants and industrial plants around Johannesburg, particularly in Mpumalanga. Satellite-based measurements of NO2 levels, which correlate closely with the amount of fossil fuel burning, show a significant increase year-on-year in Mpumalanga, but a drop in Gauteng. Therefore, increases in local emissions are unlikely to play a role. Eskom has reportedly been working hard to increase power generation at its decrepit power plants, and increasing the use of diesel to make up for shortfalls in available capacity which is likely a significant part of the explanation.

NO2 levels detected from satellites in June-July 2022 (left) and 2023.
6) Our earlier modeling shows that coal power plants are capable of causing pollution in Johannesburg at the levels observed in the past months, further implicating them as one of the sources behind the episodes.
| Fact box: What are PM2.5, PM10, SO2 and NO2? PM2.5 is particles smaller than 2.5 micrometers. That limit matters because they’re small enough to pass from lungs to the bloodstream and wreak havoc on all our internal organs. Combustion of coal, oil and biomass generates PM2.5 directly. Natural dust and road dust also contribute. Many gaseous pollutants from coal, oil, gas and biomass, as well as from agriculture, form PM2.5 particles through chemical reactions in the atmosphere. PM10 is particles smaller than 10 micrometers. So it includes PM2.5 but also larger particles. This size cut-off matters because these particles are too small to be caught by the defenses in our nose and mouth and upper airways and therefore make their way into the lungs. They’re called respirable particles. SO2 is a pollutant generated from burning fuels that contain sulfur, mainly coal or fuel oil. South African power plants and industries lack control devices for SO2 routinely required in many other countries; therefore the SO2 emissions are huge. NO2 is generated from all fuel-burning, as it’s generated from the nitrogen in the air in high temperatures. Both SO2 and NO2 turn into PM2.5 particles in the atmosphere through chemical reactions. PM2.5, SO2 and NO2 are all dangerous pollutants that increase the risk of death and many diseases. During air pollution episodes caused by open fires, e.g. crop residue burning, in many parts of the world, what we see is a very high ratio of PM10 to PM2.5, because open fires emit a lot of coarser particles because the combustion process is very inefficient and obviously there are no emission control devices to filter out the larger particles. We also see low NO2 and SO2 concentrations relative to PM2.5 and PM10 because open fires emit almost no SO2 and emit much less NO2 in relation to PM than combustion sources. |